| Param | Original file | Final file |
|---|---|---|
| Filename | modeM0/AS1T05_015T01_9000005026_35069cztM0_level2.evt | modeM0/AS1T05_015T01_9000005026_35069cztM0_level2_quad_clean.evt |
| Size (bytes) | 481,524,480 | 61,513,920 |
| Size | 459.2 MB | 58.7 MB |
| Events in quadrant A | 2,770,152 | 369,201 |
| Events in quadrant B | 3,299,668 | 374,662 |
| Events in quadrant C | 3,069,664 | 369,925 |
| Events in quadrant D | 5,054,828 | 347,785 |
| Mode SS | |||
|---|---|---|---|
| Quadrant | BADHDUFLAG | Total packets | Discarded packets |
| A | 0 | 118 | 0 |
| B | 0 | 118 | 0 |
| C | 0 | 118 | 0 |
| D | 0 | 118 | 0 |
| Mode M9 | |||
|---|---|---|---|
| Quadrant | BADHDUFLAG | Total packets | Discarded packets |
| A | 0 | 18 | 0 |
| B | 0 | 18 | 0 |
| C | 0 | 18 | 0 |
| D | 0 | 19 | 0 |
| Mode M0 | |||
|---|---|---|---|
| Quadrant | BADHDUFLAG | Total packets | Discarded packets |
| A | 0 | 11769 | 3 |
| B | 0 | 13281 | 2 |
| C | 0 | 12326 | 2 |
| D | 0 | 19180 | 2 |
| Quadrant | Total seconds | Saturated seconds | Saturation percentage |
|---|---|---|---|
| A | 5727 | 4 | 0.069845% |
| B | 5727 | 136 | 2.374716% |
| C | 5727 | 44 | 0.768291% |
| D | 5727 | 189 | 3.300157% |
Noise dominated data is calculated using 1-second bins in cleaned event files. If a bin has >2000 counts, and if more than 50% of those come from <1% of pixels, then it is considered to be noise-dominated and hence unusable.
| Quadrant | # 1 sec bins | Bins with >0 counts | Bins with >2000 counts | High rate bins dominated by noise | Noise dominated (total time) | Noise dominated (detector-on time) | Marked lightcurve |
|---|---|---|---|---|---|---|---|
| A | 7430 | 5728 | 0 | 0 | 0.00% | 0.00% | 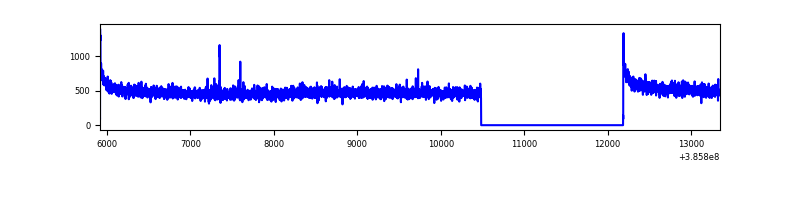 |
| B | 7430 | 5728 | 91 | 91 | 1.22% | 1.59% | 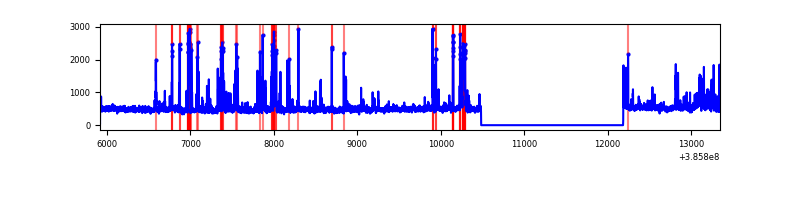 |
| C | 7430 | 5728 | 41 | 41 | 0.55% | 0.72% | 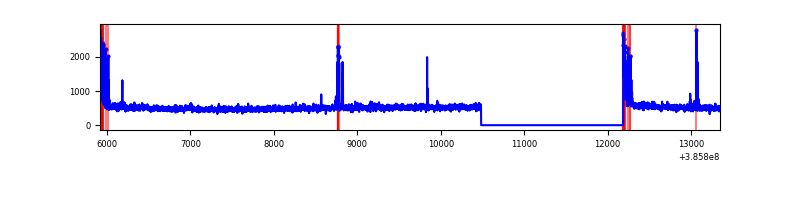 |
| D | 7430 | 5728 | 170 | 170 | 2.29% | 2.97% | 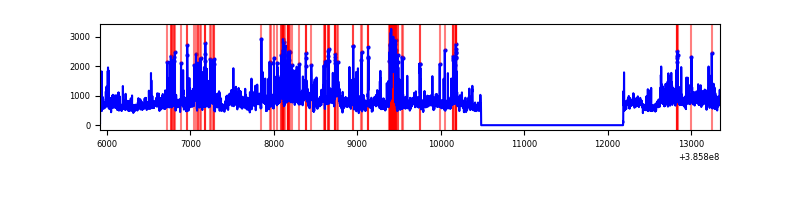 |
Top three noisy pixels from each quadrant. If the there are fewer than three noisy pixels in the level2.evt file, extra rows are filled as -1
| Pixel properties | Quadrant properties | ||||||
|---|---|---|---|---|---|---|---|
| Quadrant | DetID | PixID | Counts | Sigma | Mean | Median | Sigma |
| A | 10 | 83 | 79292 | 564.23 | 692 | 678 | 139.3 |
| A | 13 | 6 | 13089 | 89.08 | 692 | 678 | 139.3 |
| A | 13 | 254 | 9015 | 59.84 | 692 | 678 | 139.3 |
| B | 5 | 172 | 463404 | 3518.76 | 677 | 658 | 131.5 |
| B | 0 | 190 | 75758 | 571.06 | 677 | 658 | 131.5 |
| B | 0 | 189 | 37256 | 278.29 | 677 | 658 | 131.5 |
| C | 15 | 214 | 241232 | 1571.56 | 664 | 669 | 153.1 |
| C | 0 | 10 | 145039 | 943.15 | 664 | 669 | 153.1 |
| C | 12 | 250 | 57943 | 374.16 | 664 | 669 | 153.1 |
| D | 8 | 195 | 1364376 | 8450.52 | 661 | 643 | 161.4 |
| D | 2 | 250 | 254035 | 1570.17 | 661 | 643 | 161.4 |
| D | 10 | 203 | 219982 | 1359.16 | 661 | 643 | 161.4 |
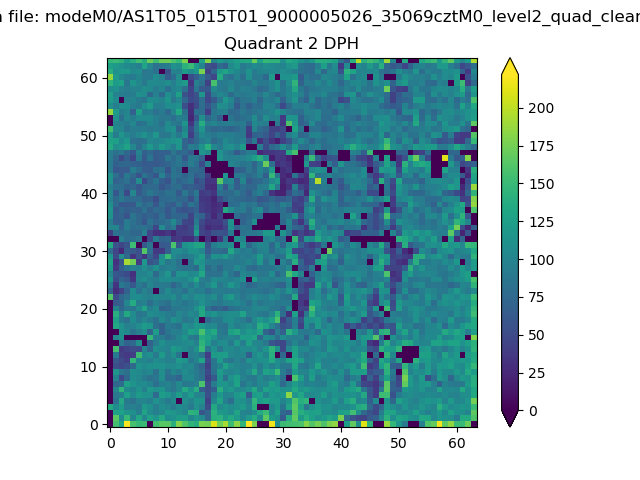
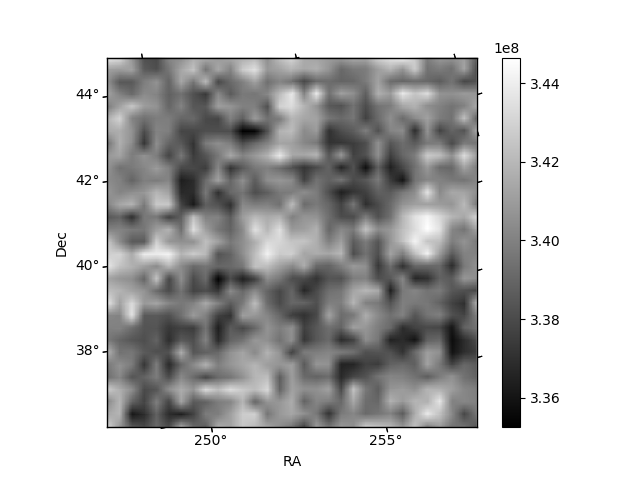
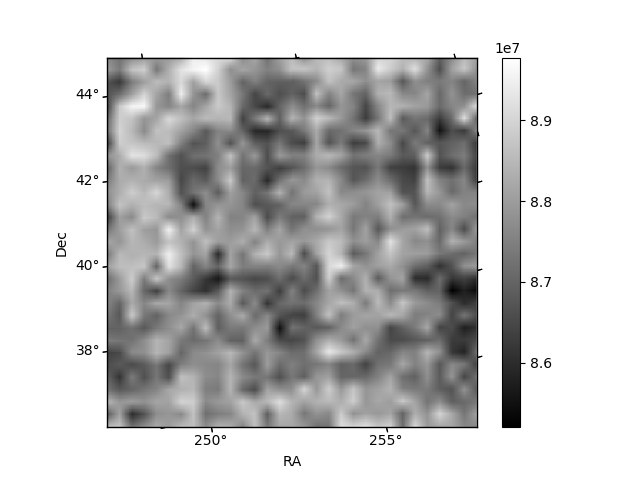
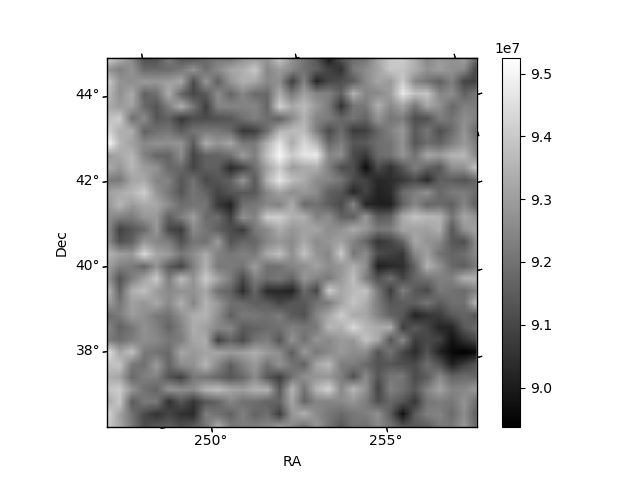
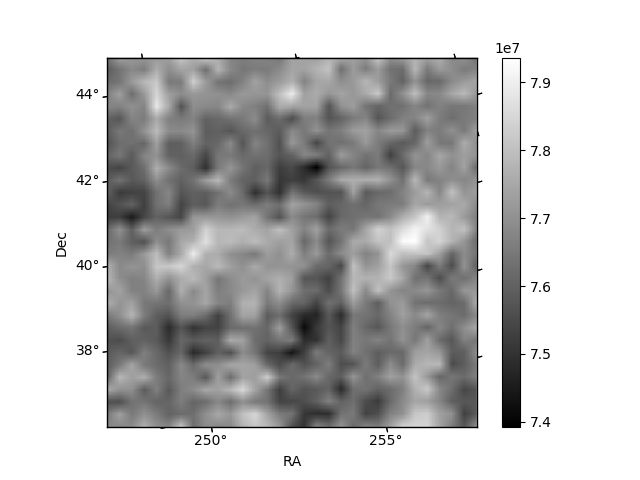
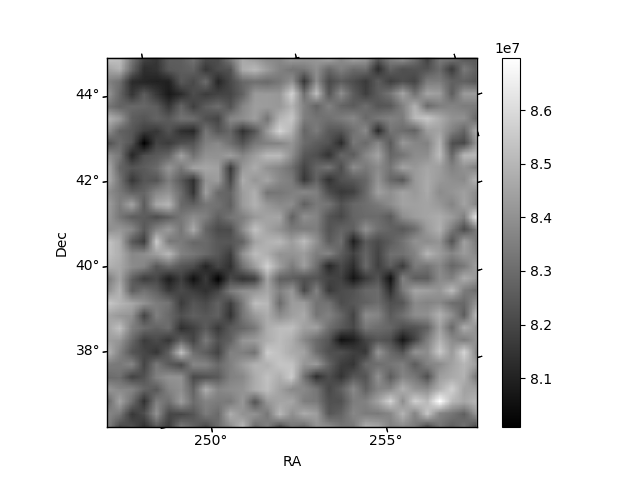
Histogram calculated using DETX and DETY for each event in the final _common_clean file
| Quadrant A | 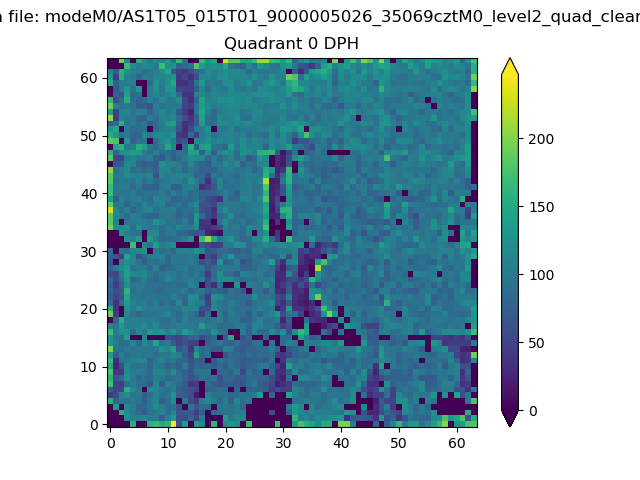 |
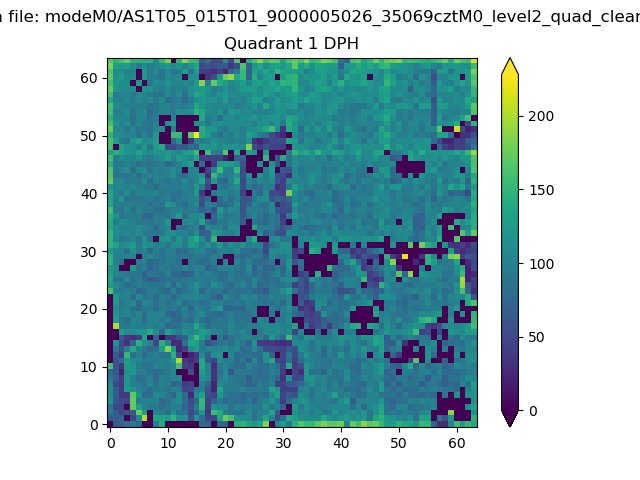 |
Quadrant B |
|---|---|---|---|
| Quadrant D | 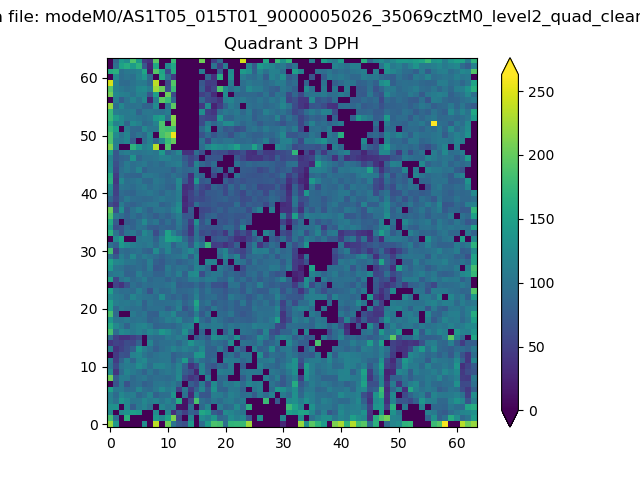 |
 |
Quadrant C |
| Plot type | Count rate plots | Images |
|---|---|---|
| Comparison with Poisson distribution Blue bars denote a histogram of data divided into 1 sec bins. Red curve is a Poisson curve with rate = median count rate of data. |
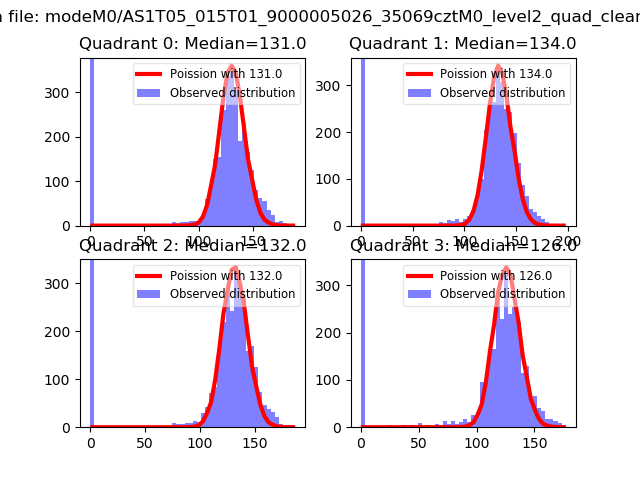 |
 |
| Quadrant-wise count rates Data is divided into 100 sec bins |
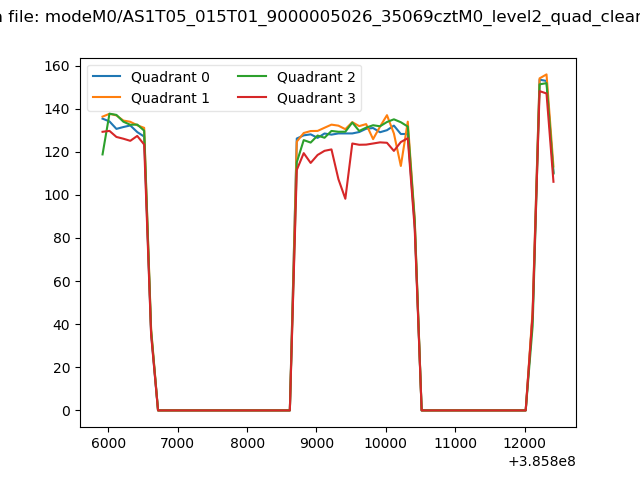 |
|
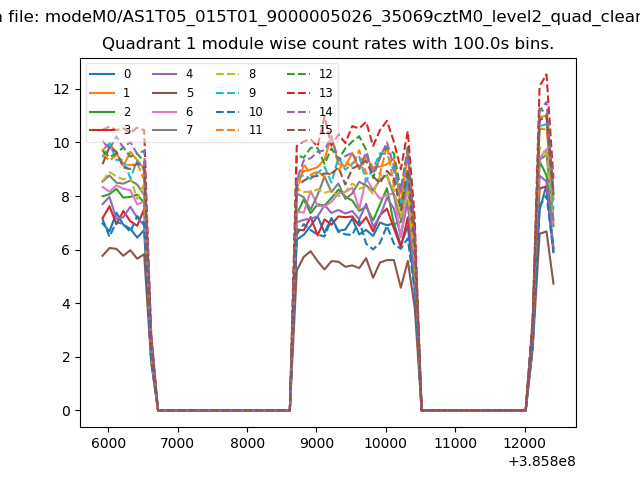
| Module-wise count rates for Quadrant A Data is divided into 100 sec bins |
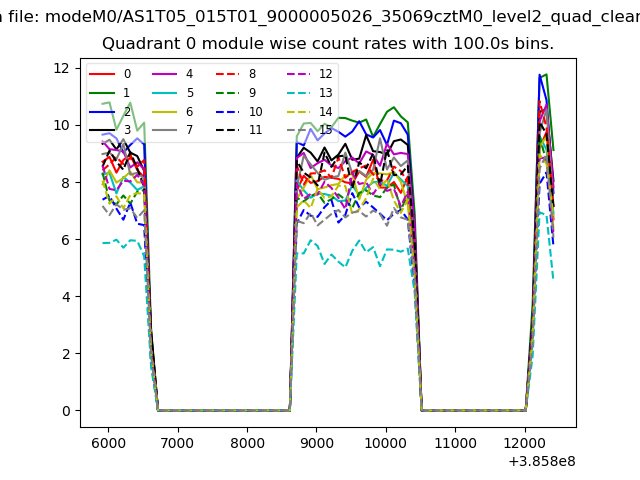 |
 |
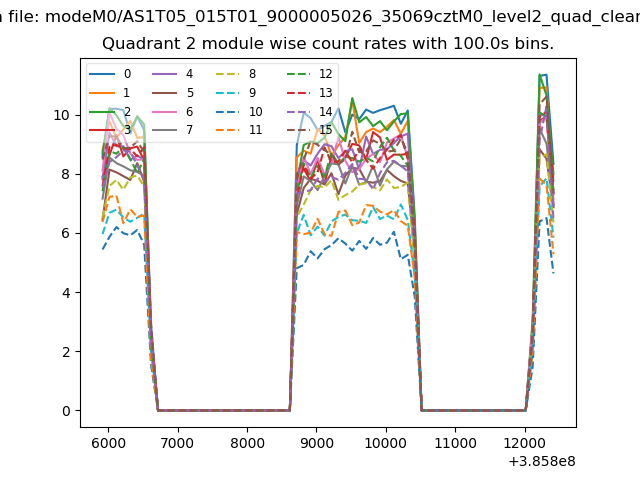
| Module-wise count rates for Quadrant B Data is divided into 100 sec bins |
 |
 |
| Module-wise count rates for Quadrant C Data is divided into 100 sec bins |
 |
 |
| Module-wise count rates for Quadrant D Data is divided into 100 sec bins |
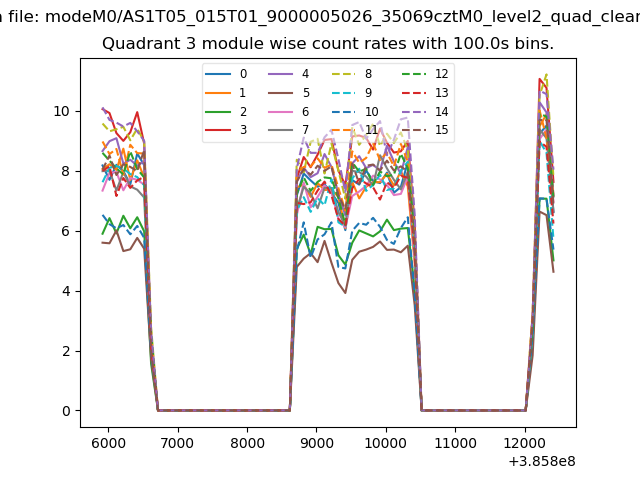 |
 |
| Parameter | Plot |
|---|---|
| CZT HV Monitor | 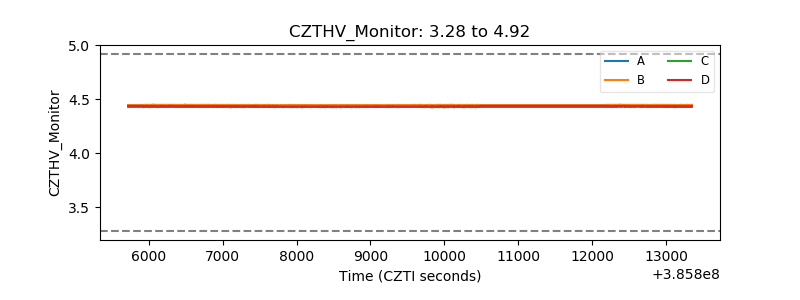 |
| D_VDD | 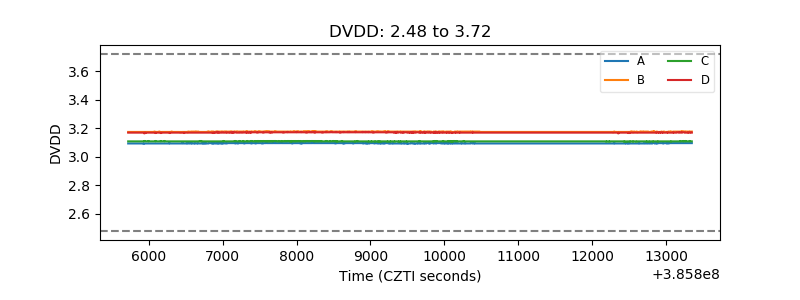 |
| Temperature 1 | 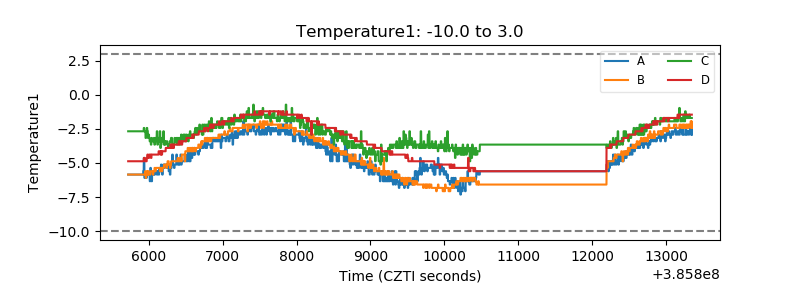 |
| Veto HV Monitor | 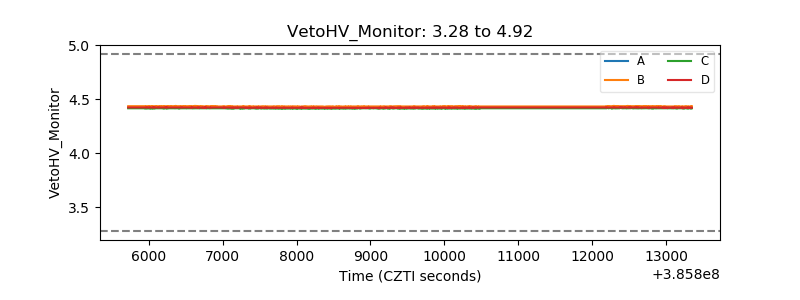 |
| Veto LLD | 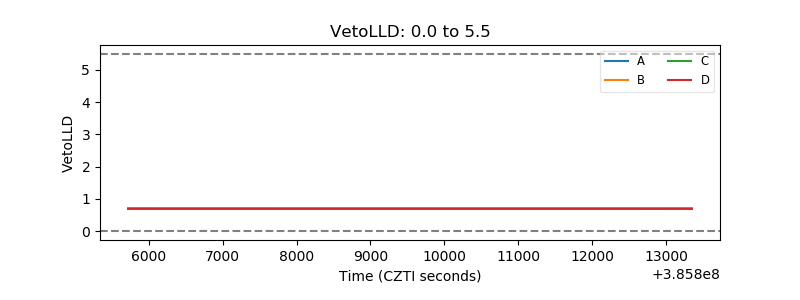 |
| Alpha Counter | 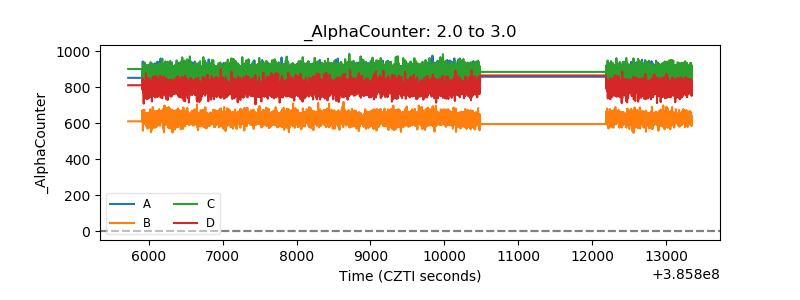 |
| _CPM_Rate | 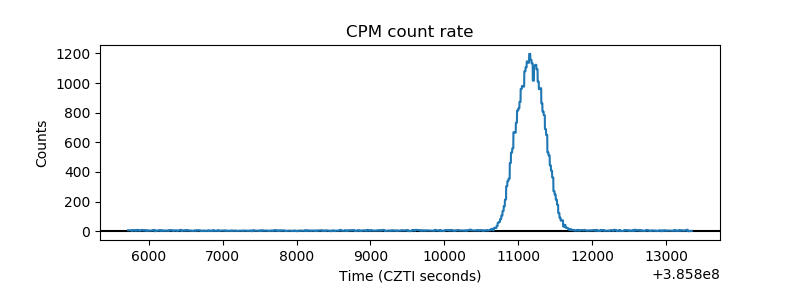 |
| CZT Counter | 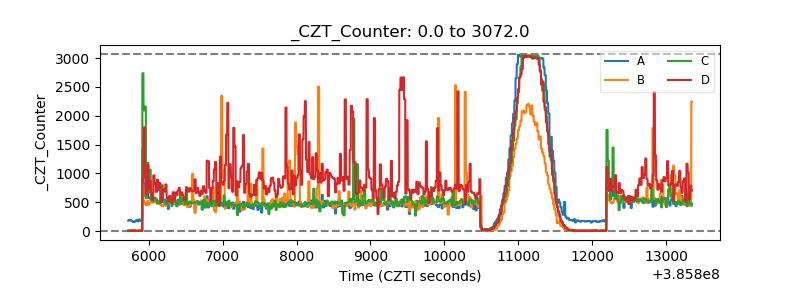 |
| +2.5 Volts monitor | 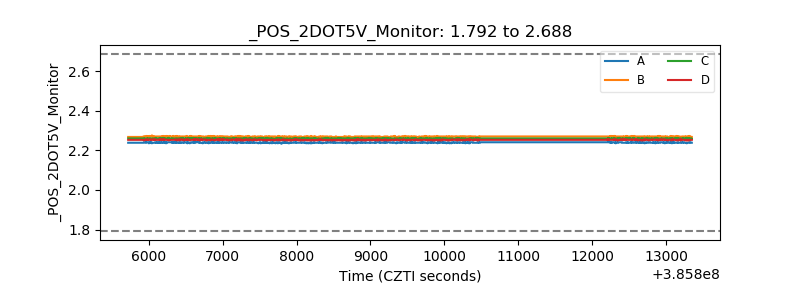 |
| +5 Volts monitor | 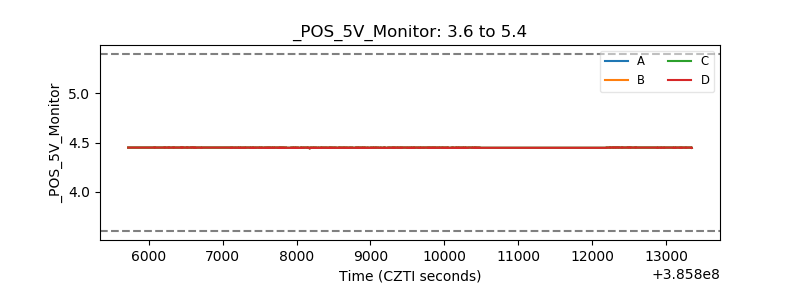 |
| _ROLL_ROT | 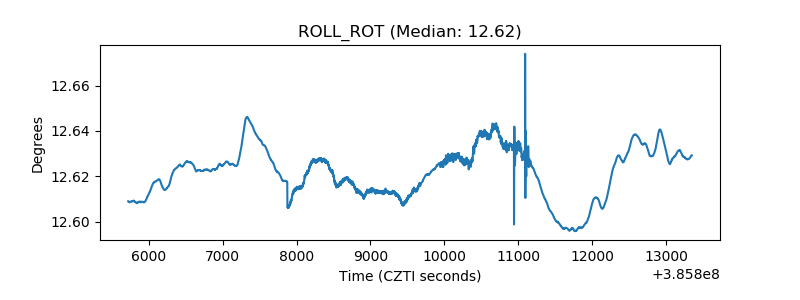 |
| _Roll_DEC | 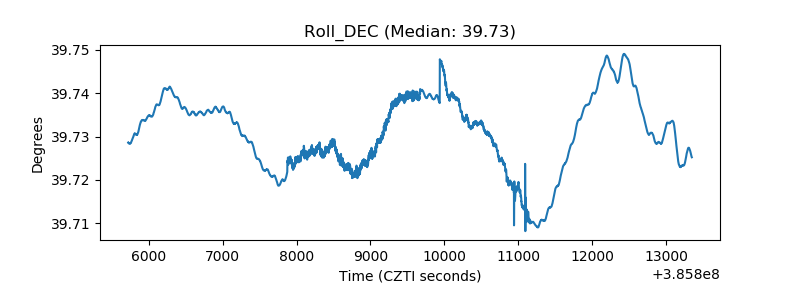 |
| _Roll_RA | 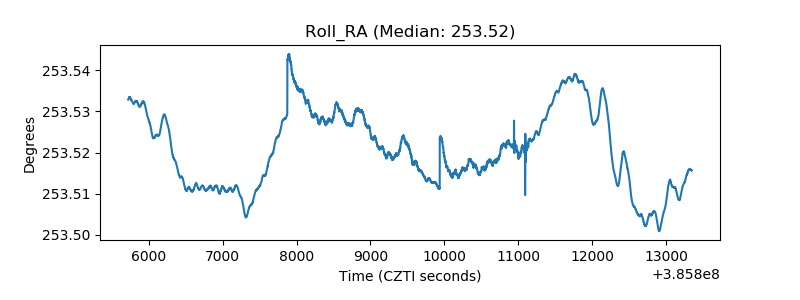 |
| Veto Counter | 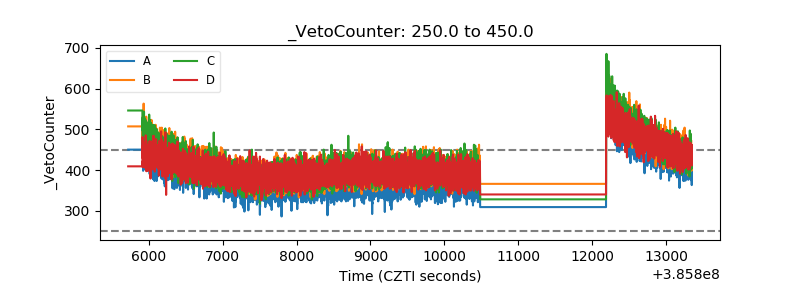 |