| Param | Original file | Final file |
|---|---|---|
| Filename | modeM0/AS1A10_123T17_9000005018_35039cztM0_level2.evt | modeM0/AS1A10_123T17_9000005018_35039cztM0_level2_quad_clean.evt |
| Size (bytes) | 538,796,160 | 72,904,320 |
| Size | 513.8 MB | 69.5 MB |
| Events in quadrant A | 3,017,671 | 453,878 |
| Events in quadrant B | 3,146,808 | 460,120 |
| Events in quadrant C | 3,227,662 | 450,869 |
| Events in quadrant D | 6,493,161 | 397,422 |
| Mode M0 | |||
|---|---|---|---|
| Quadrant | BADHDUFLAG | Total packets | Discarded packets |
| A | 0 | 13003 | 3 |
| B | 0 | 13339 | 2 |
| C | 0 | 13138 | 2 |
| D | 0 | 23757 | 2 |
| Mode SS | |||
|---|---|---|---|
| Quadrant | BADHDUFLAG | Total packets | Discarded packets |
| A | 0 | 132 | 0 |
| B | 0 | 132 | 0 |
| C | 0 | 132 | 0 |
| D | 0 | 132 | 0 |
| Mode M9 | |||
|---|---|---|---|
| Quadrant | BADHDUFLAG | Total packets | Discarded packets |
| A | 0 | 30 | 0 |
| B | 0 | 30 | 0 |
| C | 0 | 30 | 0 |
| D | 0 | 30 | 0 |
| Quadrant | Total seconds | Saturated seconds | Saturation percentage |
|---|---|---|---|
| A | 6376 | 7 | 0.109787% |
| B | 6376 | 34 | 0.533250% |
| C | 6376 | 15 | 0.235257% |
| D | 6376 | 598 | 9.378921% |
Noise dominated data is calculated using 1-second bins in cleaned event files. If a bin has >2000 counts, and if more than 50% of those come from <1% of pixels, then it is considered to be noise-dominated and hence unusable.
| Quadrant | # 1 sec bins | Bins with >0 counts | Bins with >2000 counts | High rate bins dominated by noise | Noise dominated (total time) | Noise dominated (detector-on time) | Marked lightcurve |
|---|---|---|---|---|---|---|---|
| A | 9363 | 6378 | 0 | 0 | 0.00% | 0.00% | 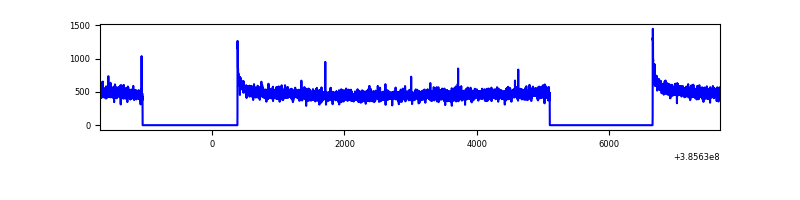 |
| B | 9362 | 6376 | 18 | 18 | 0.19% | 0.28% | 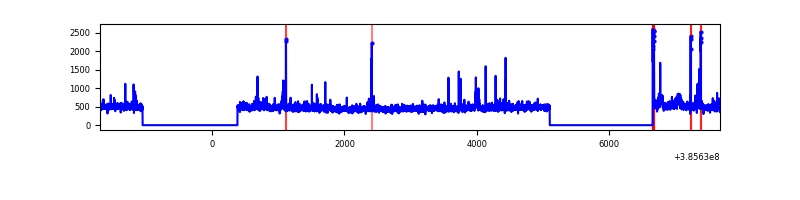 |
| C | 9363 | 6378 | 9 | 9 | 0.10% | 0.14% | 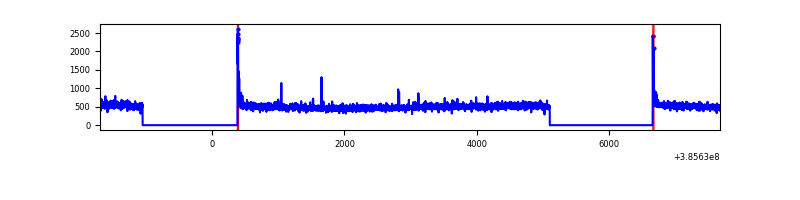 |
| D | 9363 | 6378 | 629 | 629 | 6.72% | 9.86% | 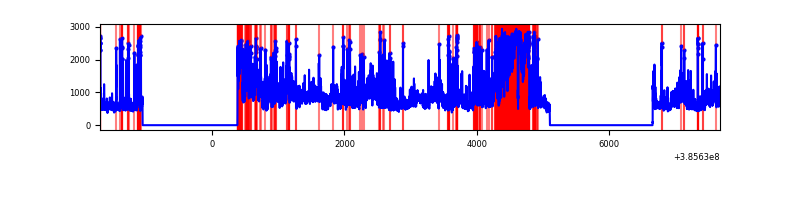 |
Top three noisy pixels from each quadrant. If the there are fewer than three noisy pixels in the level2.evt file, extra rows are filled as -1
| Pixel properties | Quadrant properties | ||||||
|---|---|---|---|---|---|---|---|
| Quadrant | DetID | PixID | Counts | Sigma | Mean | Median | Sigma |
| A | 10 | 83 | 79227 | 515.75 | 755 | 737 | 152.2 |
| A | 13 | 6 | 11044 | 67.72 | 755 | 737 | 152.2 |
| A | 15 | 169 | 9580 | 58.1 | 755 | 737 | 152.2 |
| B | 5 | 172 | 113025 | 772.46 | 749 | 729 | 145.4 |
| B | 5 | 200 | 27542 | 184.44 | 749 | 729 | 145.4 |
| B | 4 | 232 | 24143 | 161.06 | 749 | 729 | 145.4 |
| C | 15 | 214 | 265197 | 1547.21 | 735 | 741 | 170.9 |
| C | 0 | 10 | 50390 | 290.47 | 735 | 741 | 170.9 |
| C | 14 | 67 | 33235 | 190.11 | 735 | 741 | 170.9 |
| D | 14 | 52 | 1877388 | 10889.85 | 707 | 687 | 172.3 |
| D | 8 | 195 | 809231 | 4691.7 | 707 | 687 | 172.3 |
| D | 13 | 249 | 445194 | 2579.32 | 707 | 687 | 172.3 |
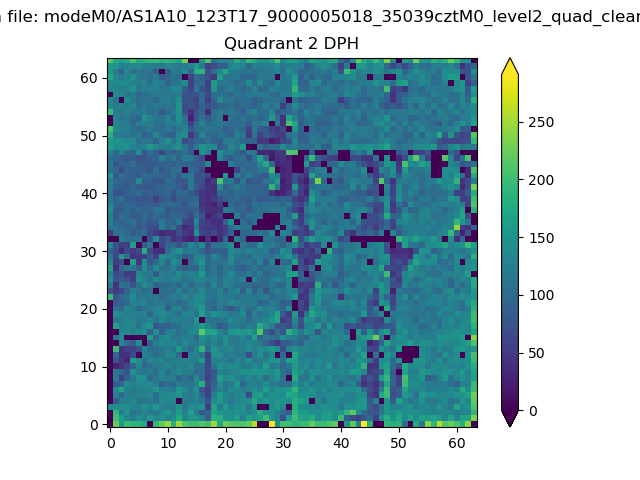
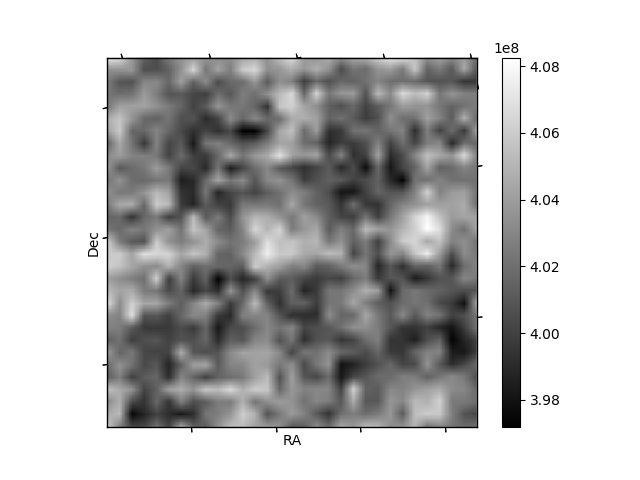
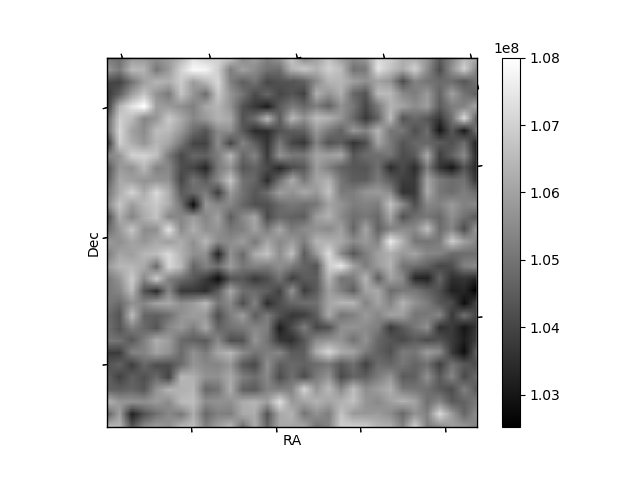
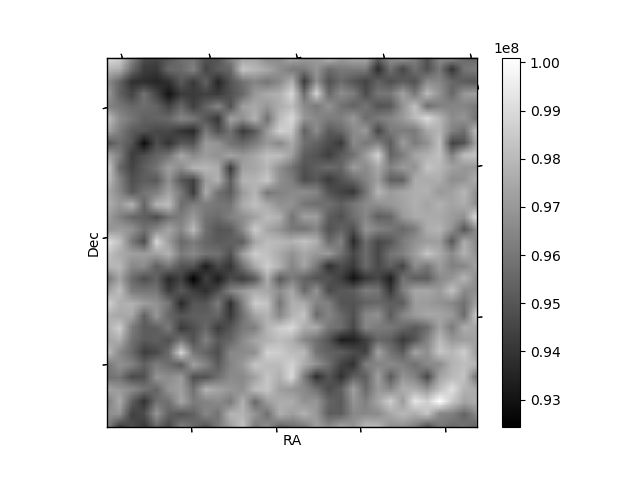
Histogram calculated using DETX and DETY for each event in the final _common_clean file
| Quadrant A | 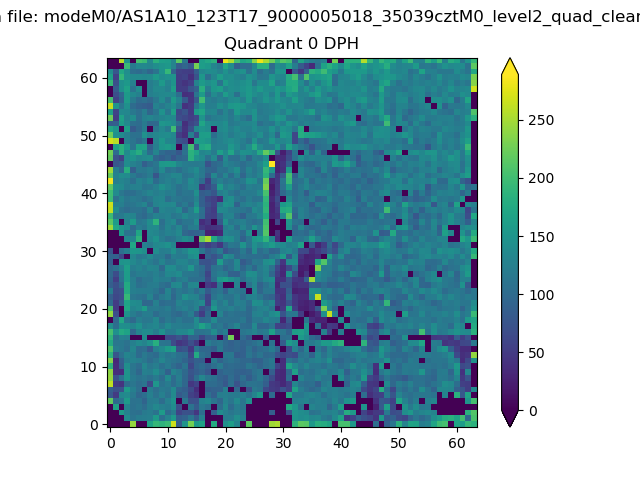 |
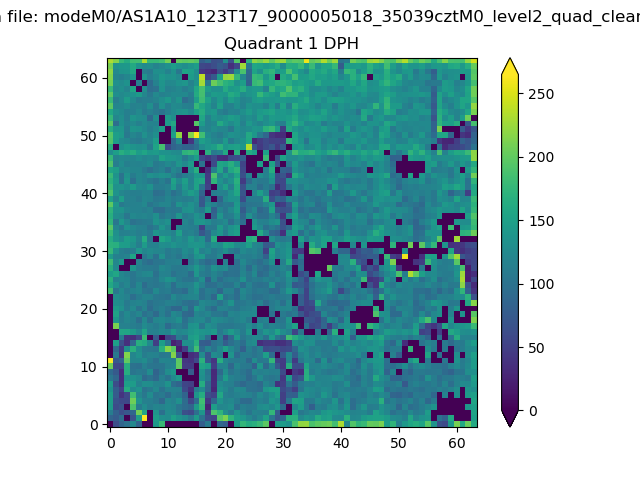 |
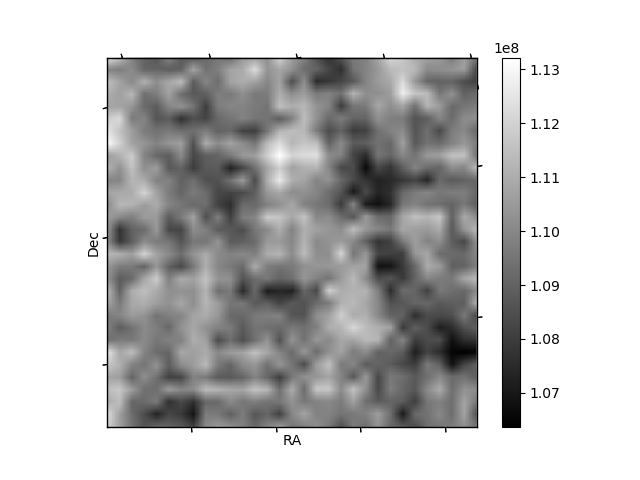
Quadrant B |
|---|---|---|---|
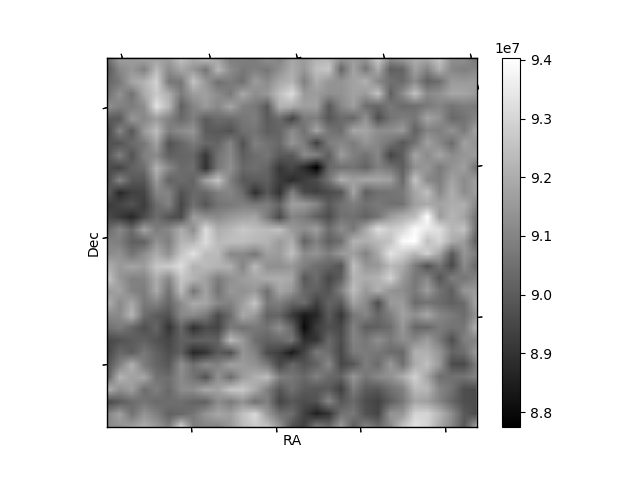
| Quadrant D | 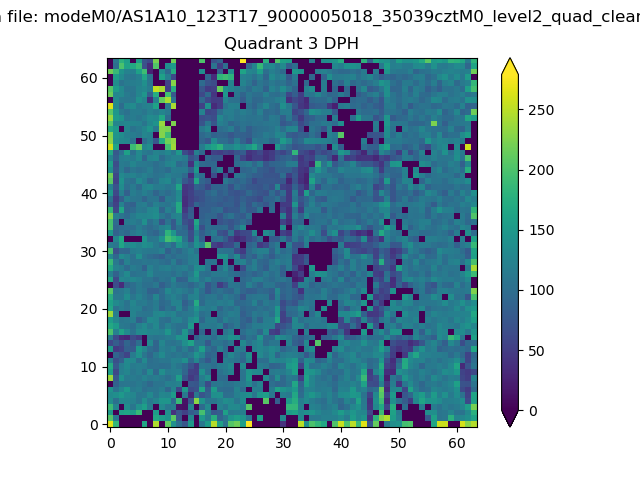 |
 |
Quadrant C |
| Plot type | Count rate plots | Images |
|---|---|---|
| Comparison with Poisson distribution Blue bars denote a histogram of data divided into 1 sec bins. Red curve is a Poisson curve with rate = median count rate of data. |
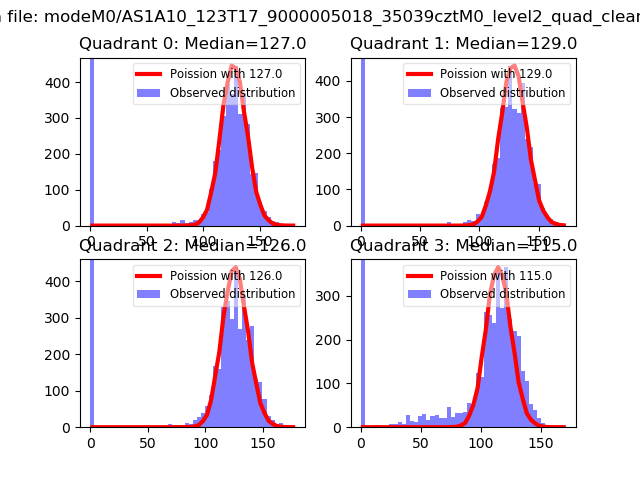 |
 |
| Quadrant-wise count rates Data is divided into 100 sec bins |
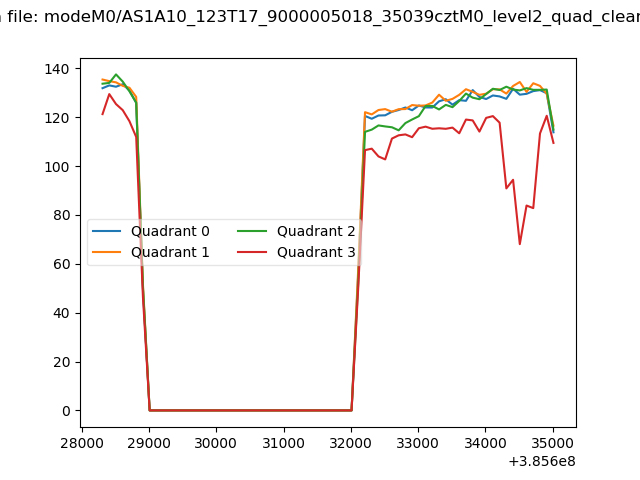 |
|
| Module-wise count rates for Quadrant A Data is divided into 100 sec bins |
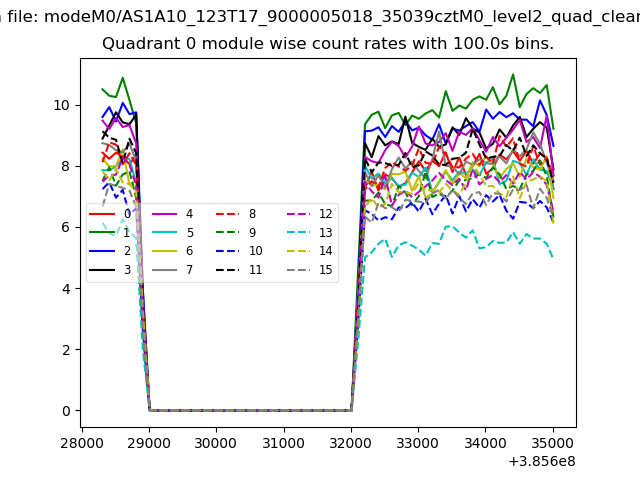 |
 |
| Module-wise count rates for Quadrant B Data is divided into 100 sec bins |
 |
 |
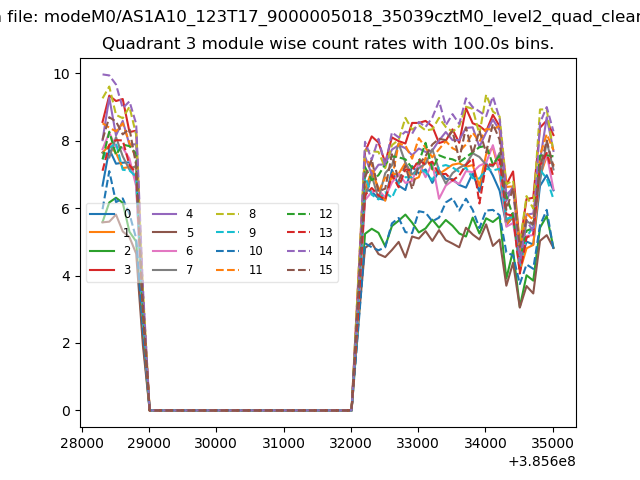
| Module-wise count rates for Quadrant C Data is divided into 100 sec bins |
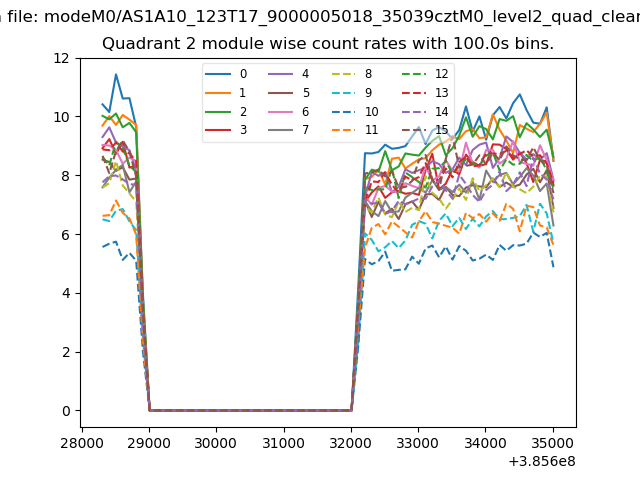 |
 |
| Module-wise count rates for Quadrant D Data is divided into 100 sec bins |
 |
 |
| Parameter | Plot |
|---|---|
| CZT HV Monitor | 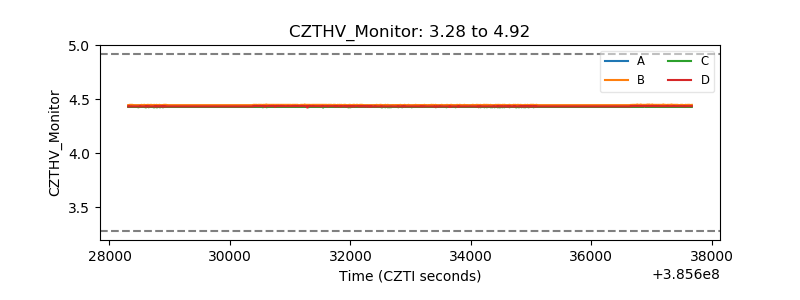 |
| D_VDD | 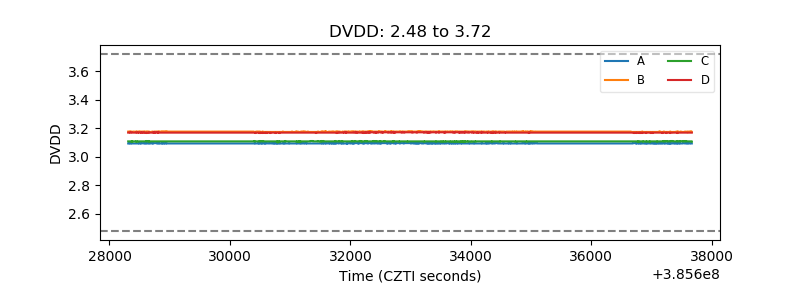 |
| Temperature 1 | 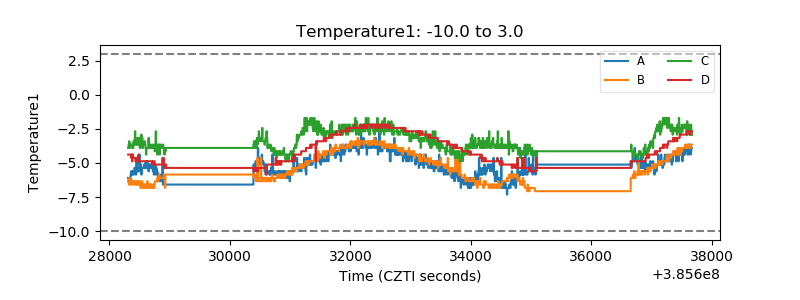 |
| Veto HV Monitor | 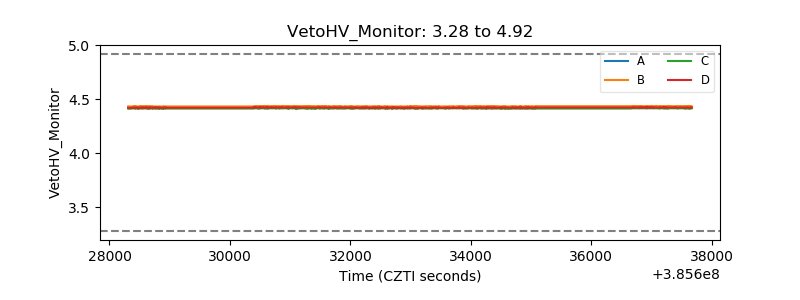 |
| Veto LLD | 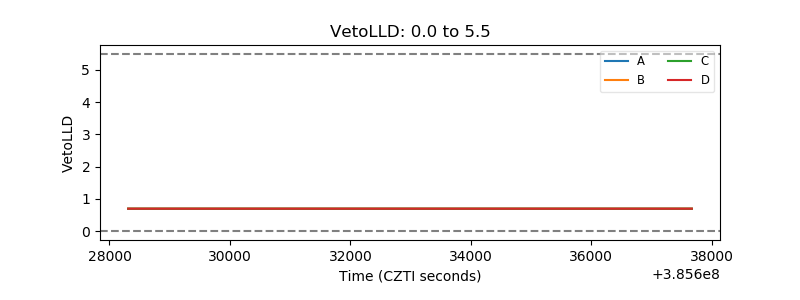 |
| Alpha Counter | 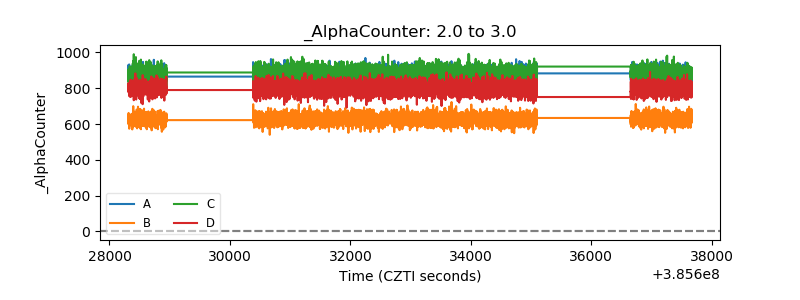 |
| _CPM_Rate | 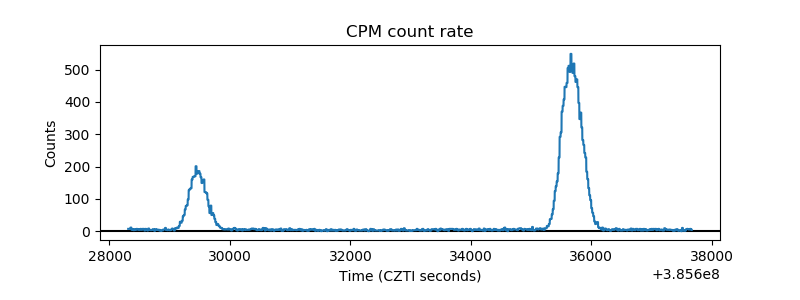 |
| CZT Counter | 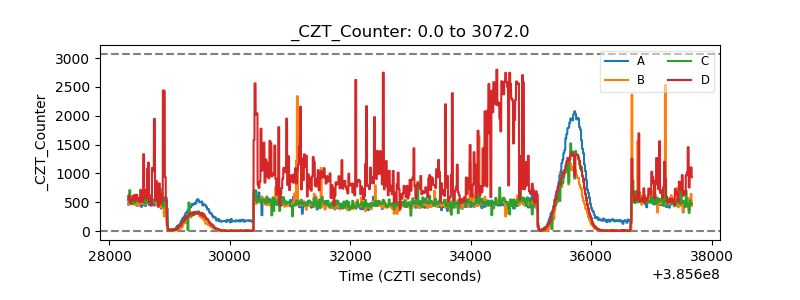 |
| +2.5 Volts monitor | 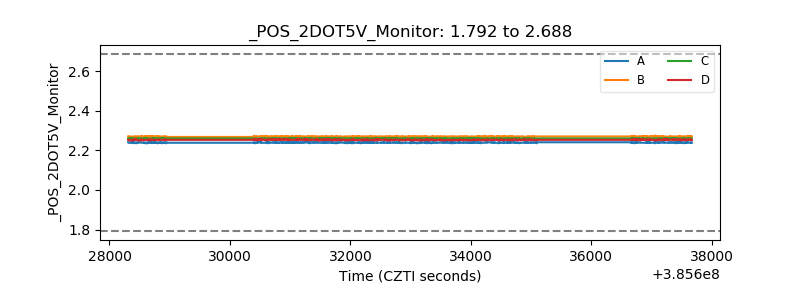 |
| +5 Volts monitor | 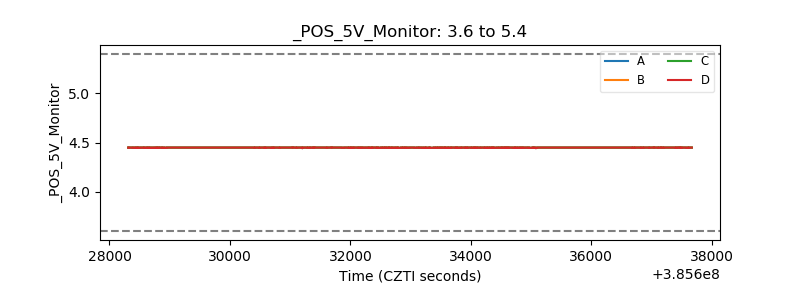 |
| _ROLL_ROT | 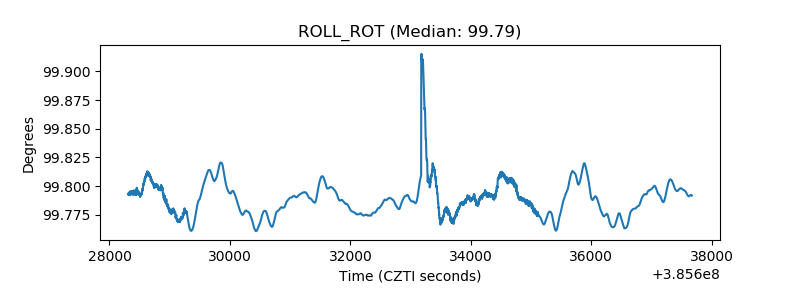 |
| _Roll_DEC | 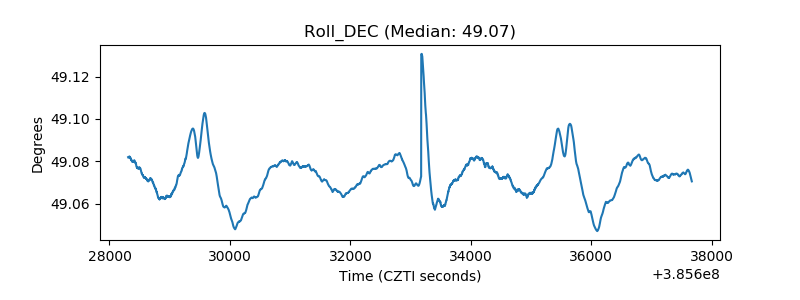 |
| _Roll_RA | 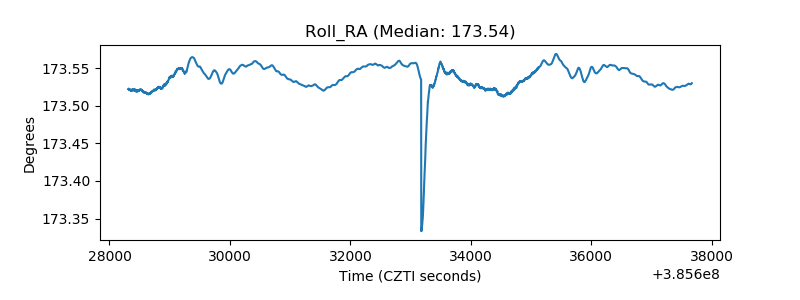 |
| Veto Counter | 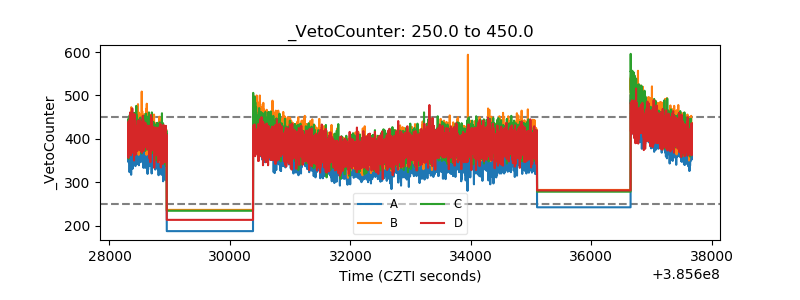 |