| Param | Original file | Final file |
|---|---|---|
| Filename | modeM0/AS1A10_123T17_9000005018_35036cztM0_level2.evt | modeM0/AS1A10_123T17_9000005018_35036cztM0_level2_quad_clean.evt |
| Size (bytes) | 447,713,280 | 78,019,200 |
| Size | 427.0 MB | 74.4 MB |
| Events in quadrant A | 2,893,271 | 486,598 |
| Events in quadrant B | 3,293,011 | 495,013 |
| Events in quadrant C | 3,078,264 | 488,412 |
| Events in quadrant D | 3,875,582 | 461,968 |
| Mode M0 | |||
|---|---|---|---|
| Quadrant | BADHDUFLAG | Total packets | Discarded packets |
| A | 0 | 12584 | 3 |
| B | 0 | 13804 | 2 |
| C | 0 | 12828 | 2 |
| D | 0 | 15764 | 2 |
| Mode SS | |||
|---|---|---|---|
| Quadrant | BADHDUFLAG | Total packets | Discarded packets |
| A | 0 | 128 | 0 |
| B | 0 | 128 | 0 |
| C | 0 | 128 | 0 |
| D | 0 | 128 | 0 |
| Mode M9 | |||
|---|---|---|---|
| Quadrant | BADHDUFLAG | Total packets | Discarded packets |
| A | 0 | 26 | 0 |
| B | 0 | 26 | 0 |
| C | 0 | 26 | 0 |
| D | 0 | 26 | 0 |
| Quadrant | Total seconds | Saturated seconds | Saturation percentage |
|---|---|---|---|
| A | 6163 | 7 | 0.113581% |
| B | 6163 | 116 | 1.882200% |
| C | 6163 | 13 | 0.210936% |
| D | 6163 | 40 | 0.649035% |
Noise dominated data is calculated using 1-second bins in cleaned event files. If a bin has >2000 counts, and if more than 50% of those come from <1% of pixels, then it is considered to be noise-dominated and hence unusable.
| Quadrant | # 1 sec bins | Bins with >0 counts | Bins with >2000 counts | High rate bins dominated by noise | Noise dominated (total time) | Noise dominated (detector-on time) | Marked lightcurve |
|---|---|---|---|---|---|---|---|
| A | 8820 | 6162 | 0 | 0 | 0.00% | 0.00% | 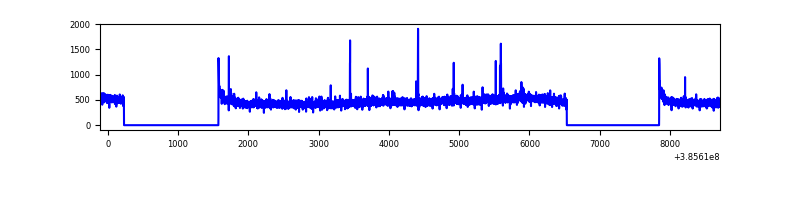 |
| B | 8820 | 6162 | 92 | 92 | 1.04% | 1.49% | 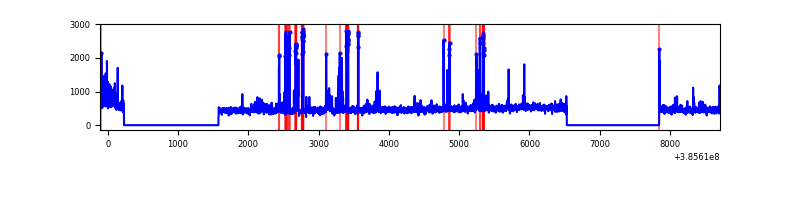 |
| C | 8820 | 6162 | 11 | 11 | 0.12% | 0.18% | 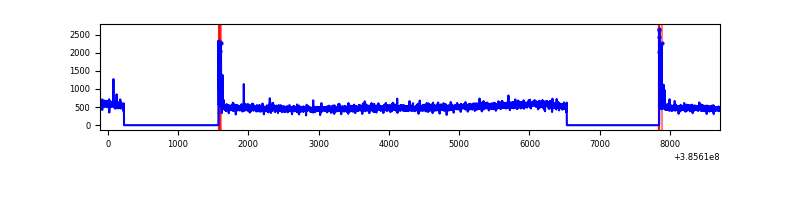 |
| D | 8820 | 6163 | 31 | 31 | 0.35% | 0.50% | 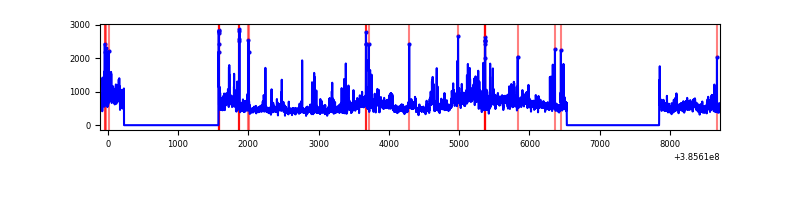 |
Top three noisy pixels from each quadrant. If the there are fewer than three noisy pixels in the level2.evt file, extra rows are filled as -1
| Pixel properties | Quadrant properties | ||||||
|---|---|---|---|---|---|---|---|
| Quadrant | DetID | PixID | Counts | Sigma | Mean | Median | Sigma |
| A | 10 | 83 | 79581 | 544.3 | 713 | 698 | 144.9 |
| A | 10 | 255 | 13888 | 91.01 | 713 | 698 | 144.9 |
| A | 13 | 6 | 12853 | 83.87 | 713 | 698 | 144.9 |
| B | 5 | 200 | 292564 | 2133.82 | 706 | 686 | 136.8 |
| B | 5 | 172 | 55854 | 403.31 | 706 | 686 | 136.8 |
| B | 0 | 190 | 54162 | 390.94 | 706 | 686 | 136.8 |
| C | 15 | 214 | 257634 | 1584.18 | 699 | 703 | 162.2 |
| C | 0 | 10 | 61336 | 373.85 | 699 | 703 | 162.2 |
| C | 14 | 67 | 23098 | 138.08 | 699 | 703 | 162.2 |
| D | 8 | 195 | 809437 | 4777.65 | 693 | 674 | 169.3 |
| D | 2 | 249 | 93474 | 548.2 | 693 | 674 | 169.3 |
| D | 13 | 249 | 72675 | 425.34 | 693 | 674 | 169.3 |
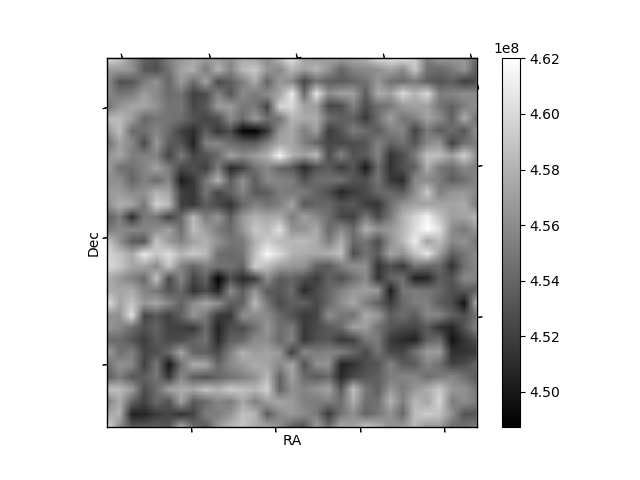
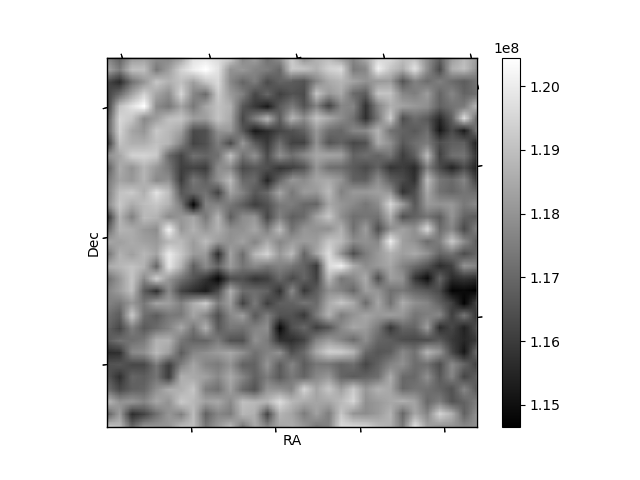
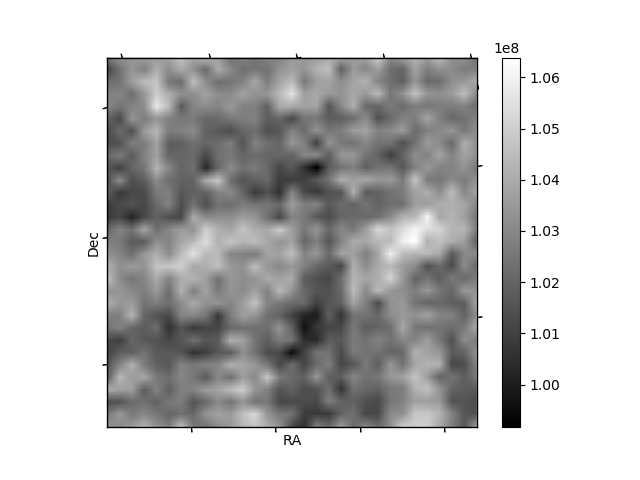
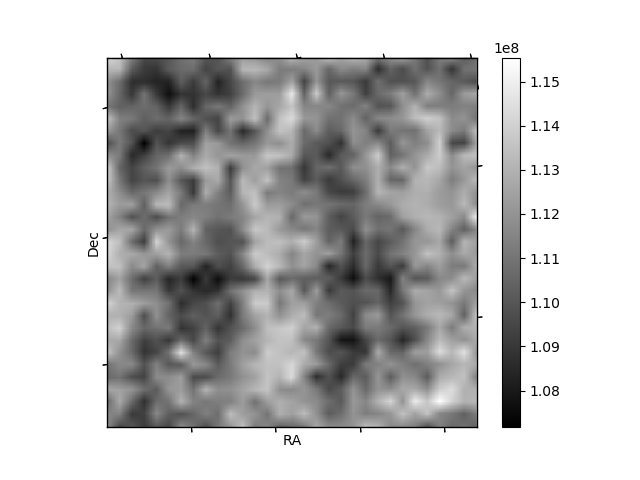
Histogram calculated using DETX and DETY for each event in the final _common_clean file
| Quadrant A | 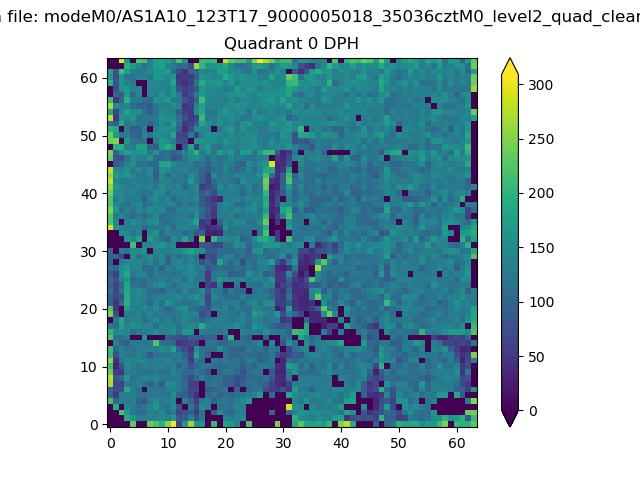 |
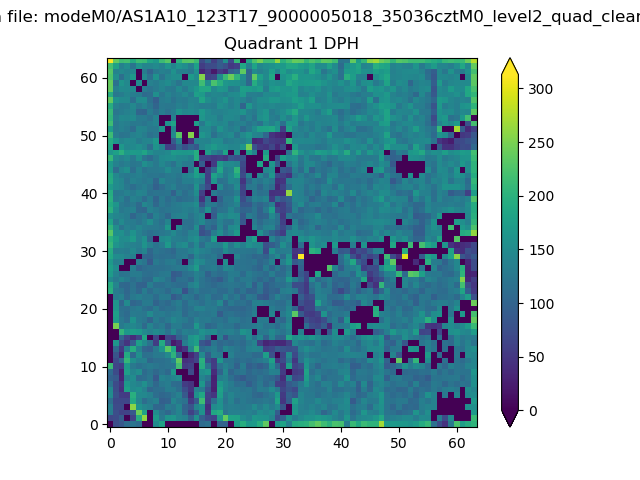 |
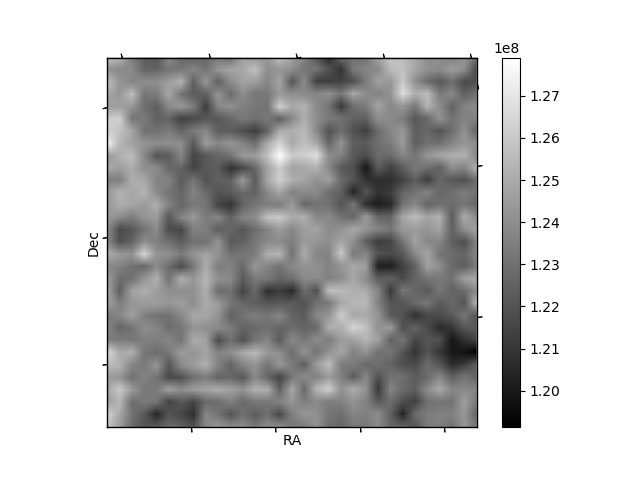
Quadrant B |
|---|---|---|---|
| Quadrant D | 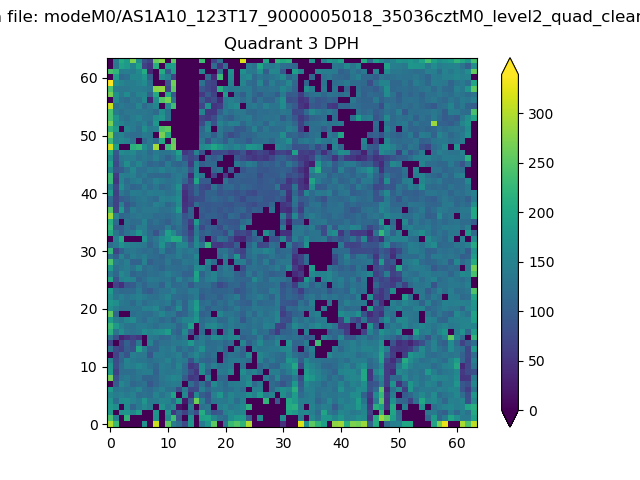 |
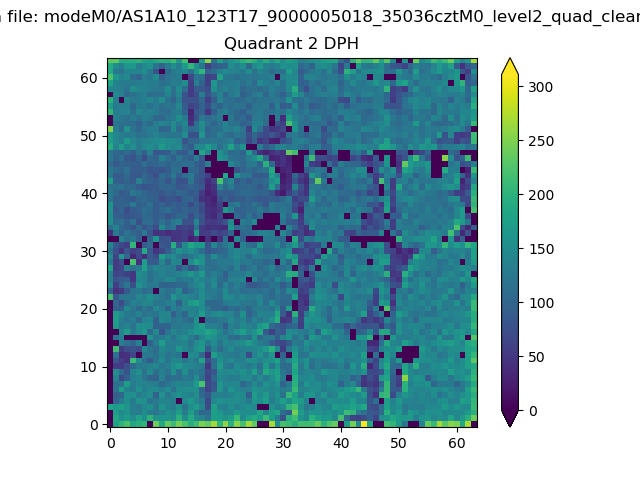 |
Quadrant C |
| Plot type | Count rate plots | Images |
|---|---|---|
| Comparison with Poisson distribution Blue bars denote a histogram of data divided into 1 sec bins. Red curve is a Poisson curve with rate = median count rate of data. |
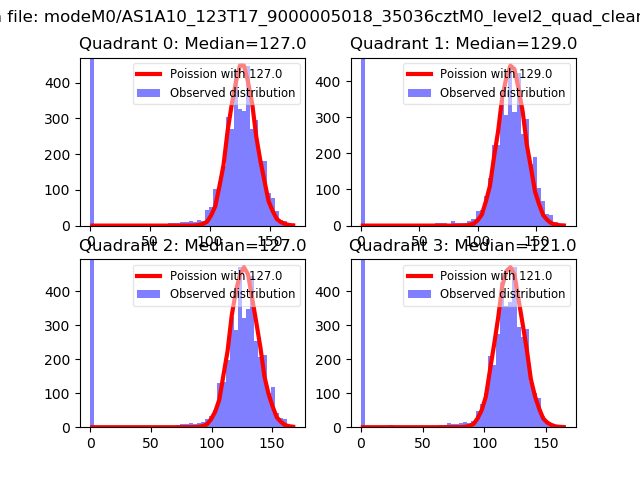 |
 |
| Quadrant-wise count rates Data is divided into 100 sec bins |
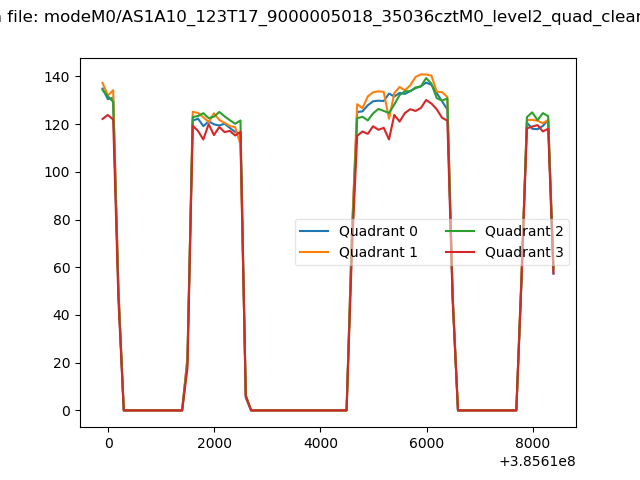 |
|
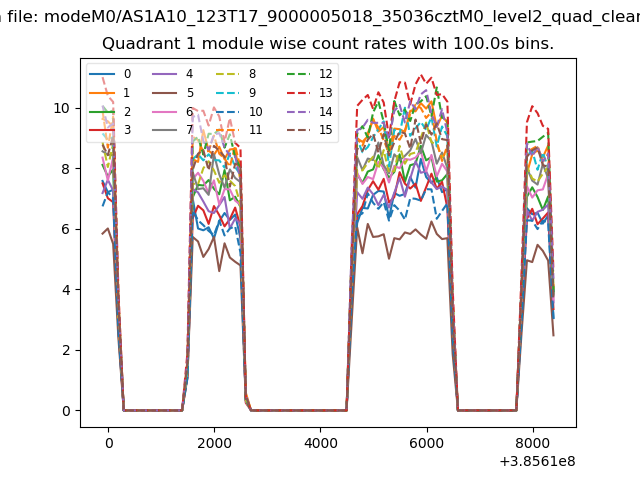
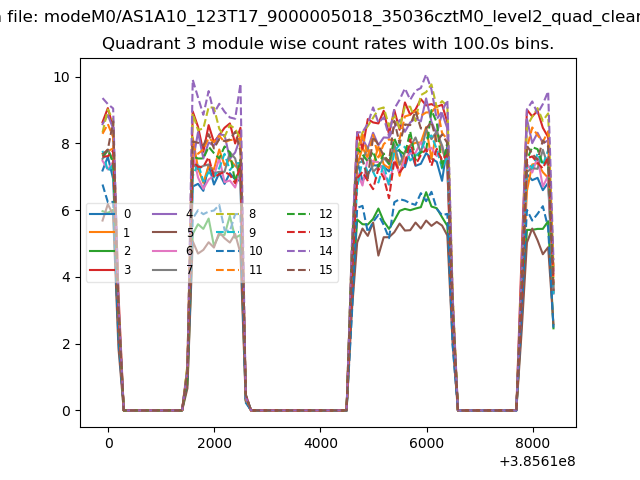
| Module-wise count rates for Quadrant A Data is divided into 100 sec bins |
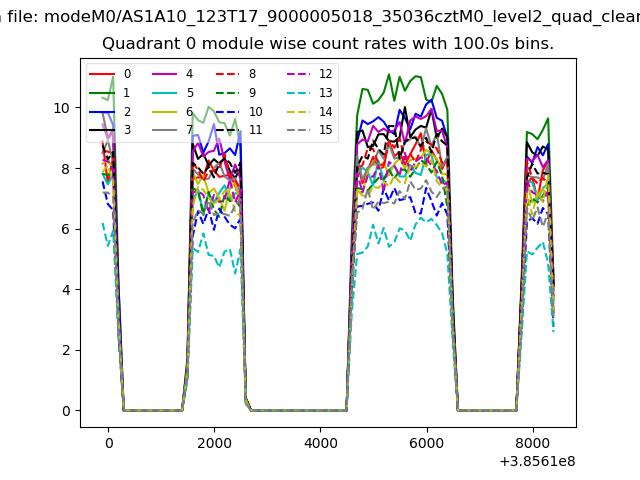 |
 |
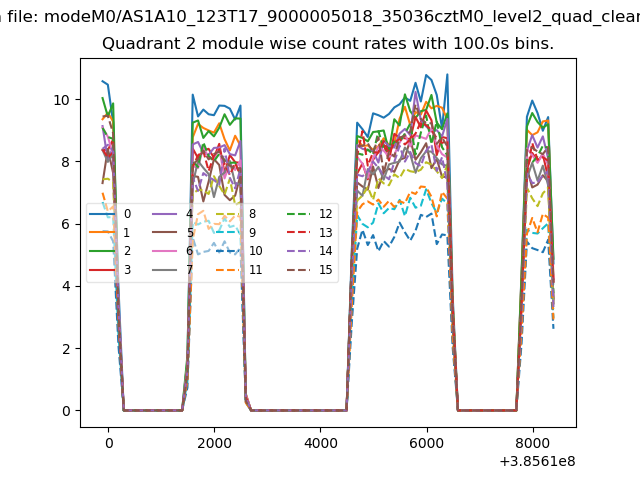
| Module-wise count rates for Quadrant B Data is divided into 100 sec bins |
 |
 |
| Module-wise count rates for Quadrant C Data is divided into 100 sec bins |
 |
 |
| Module-wise count rates for Quadrant D Data is divided into 100 sec bins |
 |
 |
| Parameter | Plot |
|---|---|
| CZT HV Monitor | 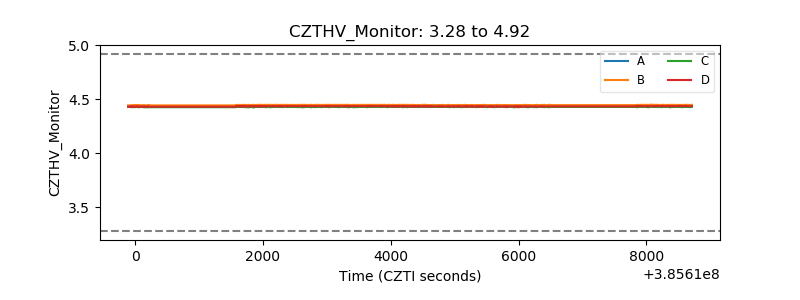 |
| D_VDD | 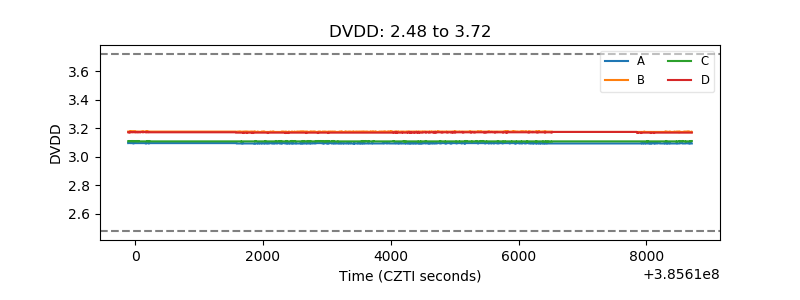 |
| Temperature 1 | 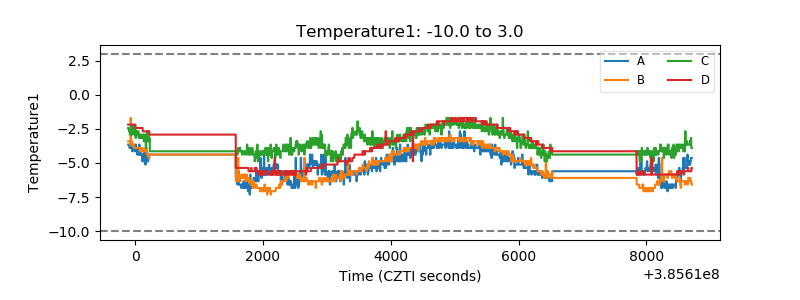 |
| Veto HV Monitor | 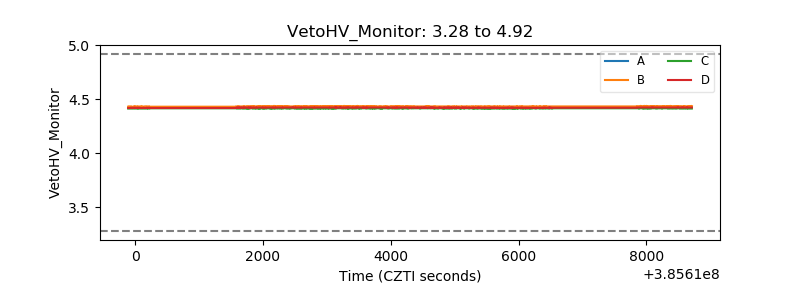 |
| Veto LLD | 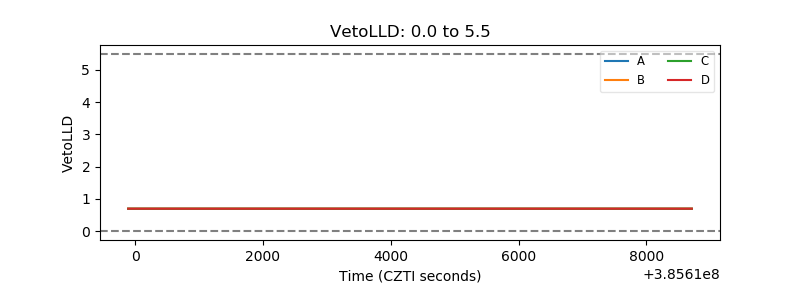 |
| Alpha Counter | 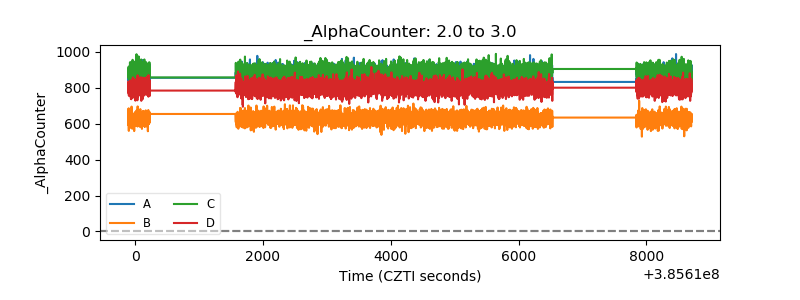 |
| _CPM_Rate | 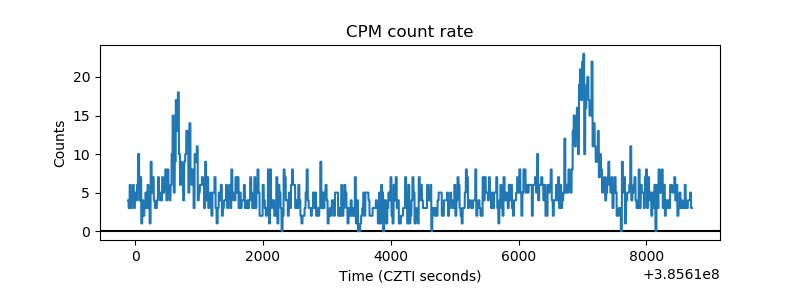 |
| CZT Counter | 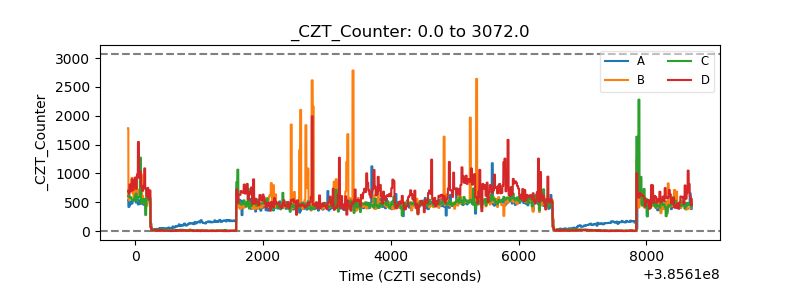 |
| +2.5 Volts monitor | 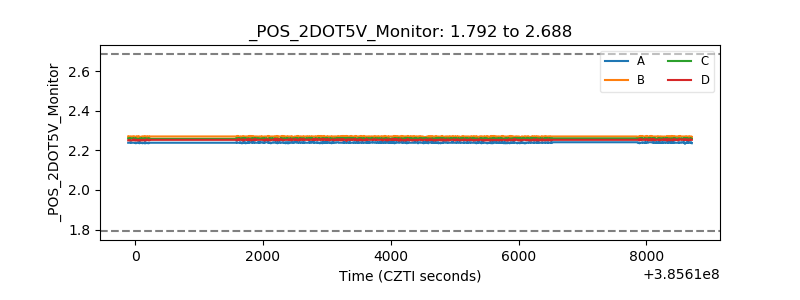 |
| +5 Volts monitor | 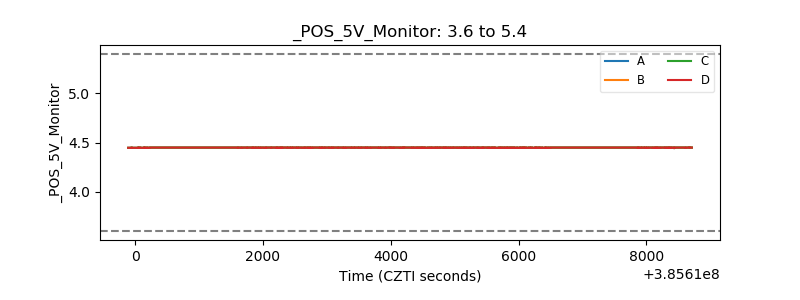 |
| _ROLL_ROT | 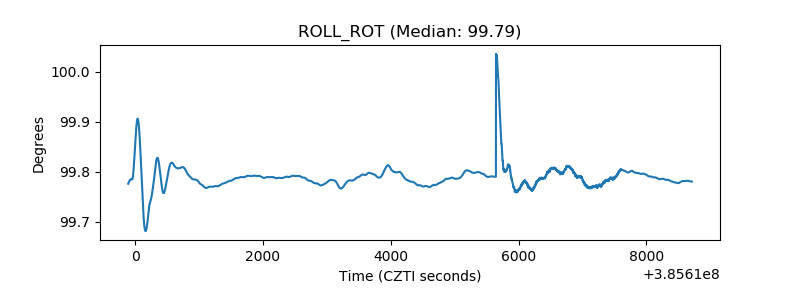 |
| _Roll_DEC | 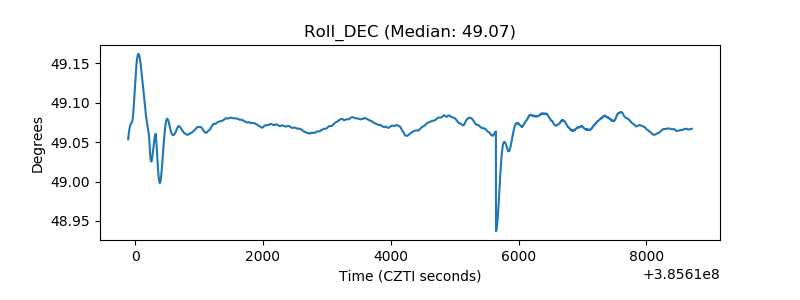 |
| _Roll_RA | 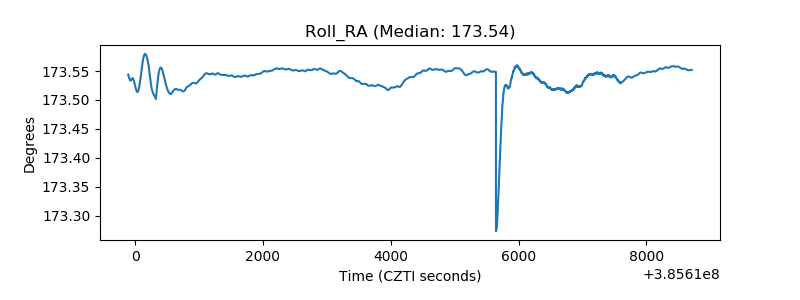 |
| Veto Counter | 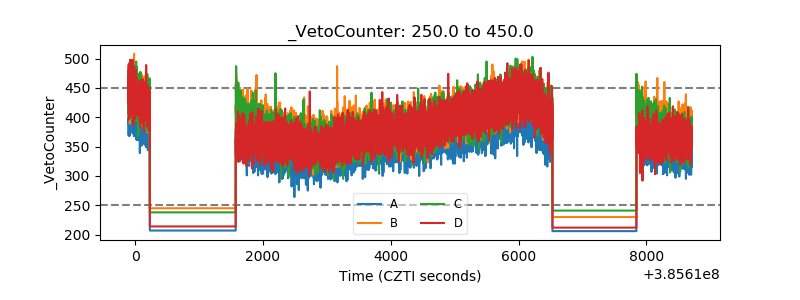 |