| Param | Original file | Final file |
|---|---|---|
| Filename | modeM0/AS1A10_057T01_9000005022_35061cztM0_level2.evt | modeM0/AS1A10_057T01_9000005022_35061cztM0_level2_quad_clean.evt |
| Size (bytes) | 445,927,680 | 63,305,280 |
| Size | 425.3 MB | 60.4 MB |
| Events in quadrant A | 2,403,090 | 407,793 |
| Events in quadrant B | 2,936,564 | 405,781 |
| Events in quadrant C | 2,713,209 | 399,556 |
| Events in quadrant D | 5,111,622 | 351,675 |
| Mode M0 | |||
|---|---|---|---|
| Quadrant | BADHDUFLAG | Total packets | Discarded packets |
| A | 0 | 10362 | 3 |
| B | 0 | 11897 | 2 |
| C | 0 | 10890 | 2 |
| D | 0 | 18732 | 2 |
| Mode M9 | |||
|---|---|---|---|
| Quadrant | BADHDUFLAG | Total packets | Discarded packets |
| A | 0 | 29 | 0 |
| B | 0 | 29 | 0 |
| C | 0 | 29 | 0 |
| D | 0 | 30 | 0 |
| Mode SS | |||
|---|---|---|---|
| Quadrant | BADHDUFLAG | Total packets | Discarded packets |
| A | 0 | 102 | 0 |
| B | 0 | 102 | 0 |
| C | 0 | 102 | 0 |
| D | 0 | 102 | 0 |
| Quadrant | Total seconds | Saturated seconds | Saturation percentage |
|---|---|---|---|
| A | 5018 | 5 | 0.099641% |
| B | 5018 | 184 | 3.666800% |
| C | 5018 | 65 | 1.295337% |
| D | 5018 | 413 | 8.230371% |
Noise dominated data is calculated using 1-second bins in cleaned event files. If a bin has >2000 counts, and if more than 50% of those come from <1% of pixels, then it is considered to be noise-dominated and hence unusable.
| Quadrant | # 1 sec bins | Bins with >0 counts | Bins with >2000 counts | High rate bins dominated by noise | Noise dominated (total time) | Noise dominated (detector-on time) | Marked lightcurve |
|---|---|---|---|---|---|---|---|
| A | 7111 | 5019 | 1 | 1 | 0.01% | 0.02% | 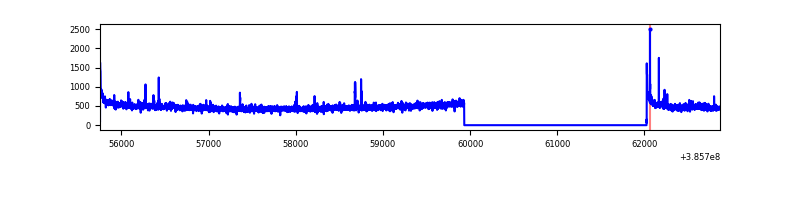 |
| B | 7111 | 5019 | 158 | 158 | 2.22% | 3.15% | 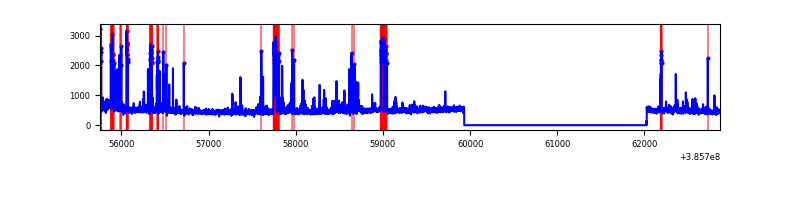 |
| C | 7111 | 5019 | 58 | 58 | 0.82% | 1.16% | 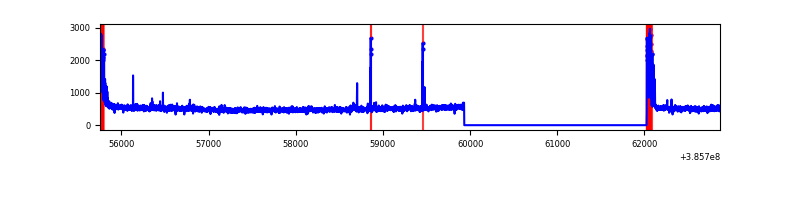 |
| D | 7111 | 5019 | 523 | 523 | 7.35% | 10.42% | 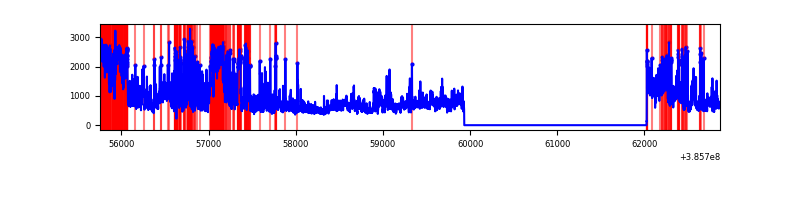 |
Top three noisy pixels from each quadrant. If the there are fewer than three noisy pixels in the level2.evt file, extra rows are filled as -1
| Pixel properties | Quadrant properties | ||||||
|---|---|---|---|---|---|---|---|
| Quadrant | DetID | PixID | Counts | Sigma | Mean | Median | Sigma |
| A | 10 | 83 | 78842 | 664.6 | 589 | 578 | 117.8 |
| A | 9 | 143 | 16724 | 137.11 | 589 | 578 | 117.8 |
| A | 13 | 6 | 10561 | 84.77 | 589 | 578 | 117.8 |
| B | 5 | 172 | 351560 | 3199.97 | 578 | 562 | 109.7 |
| B | 5 | 200 | 258970 | 2355.85 | 578 | 562 | 109.7 |
| B | 4 | 232 | 23101 | 205.48 | 578 | 562 | 109.7 |
| C | 15 | 214 | 209814 | 1564.59 | 579 | 584 | 133.7 |
| C | 0 | 10 | 186842 | 1392.81 | 579 | 584 | 133.7 |
| C | 12 | 250 | 28338 | 207.54 | 579 | 584 | 133.7 |
| D | 8 | 195 | 1139623 | 8495.8 | 559 | 545 | 134.1 |
| D | 12 | 227 | 367962 | 2740.38 | 559 | 545 | 134.1 |
| D | 13 | 249 | 363535 | 2707.36 | 559 | 545 | 134.1 |
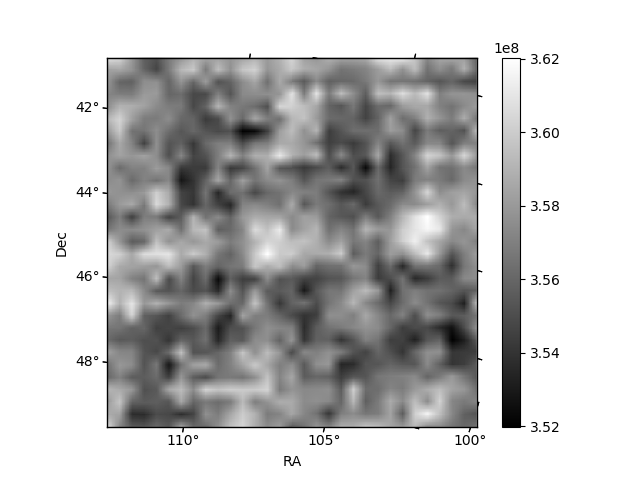
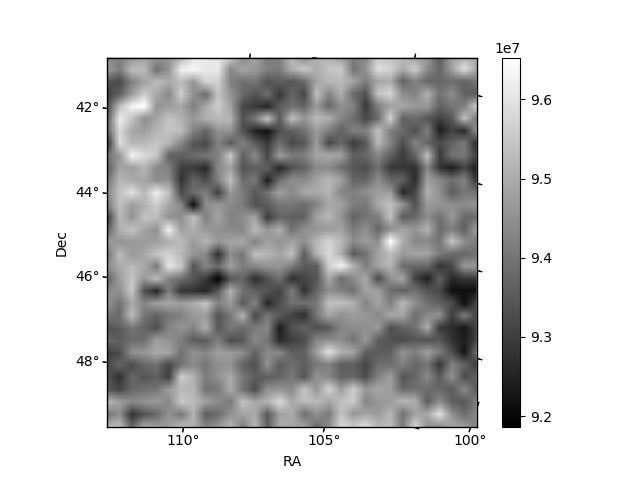
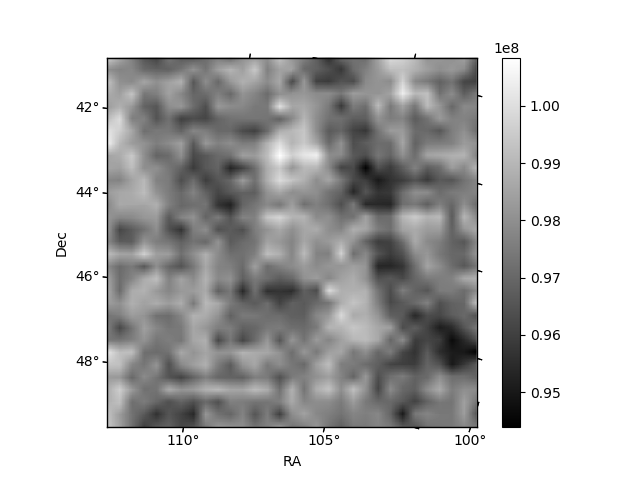
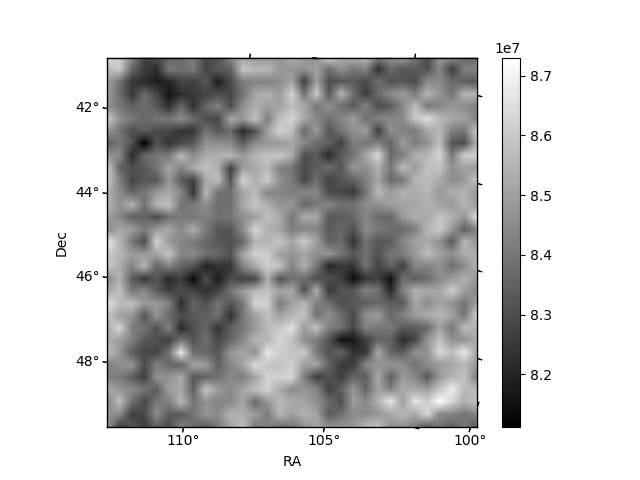
Histogram calculated using DETX and DETY for each event in the final _common_clean file
| Quadrant A | 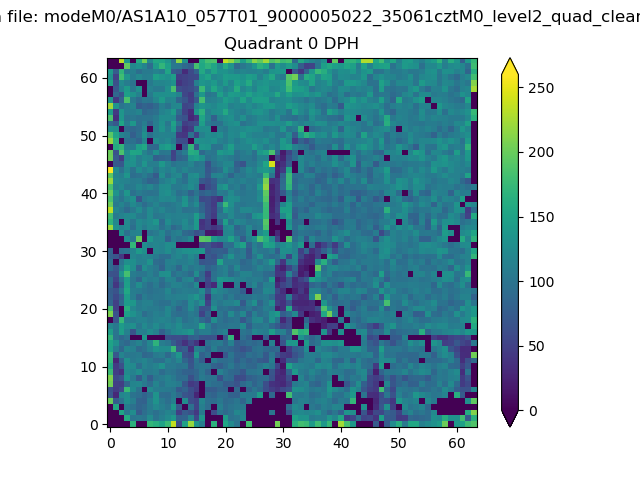 |
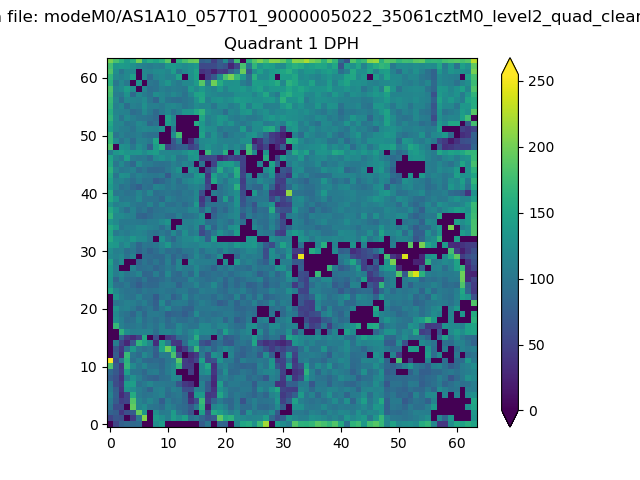 |
Quadrant B |
|---|---|---|---|
| Quadrant D | 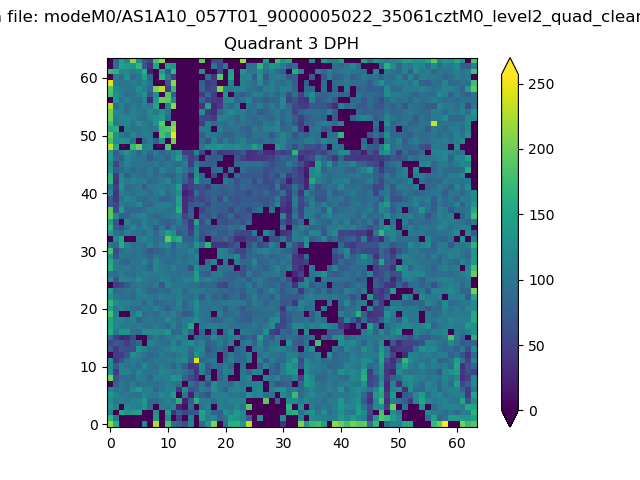 |
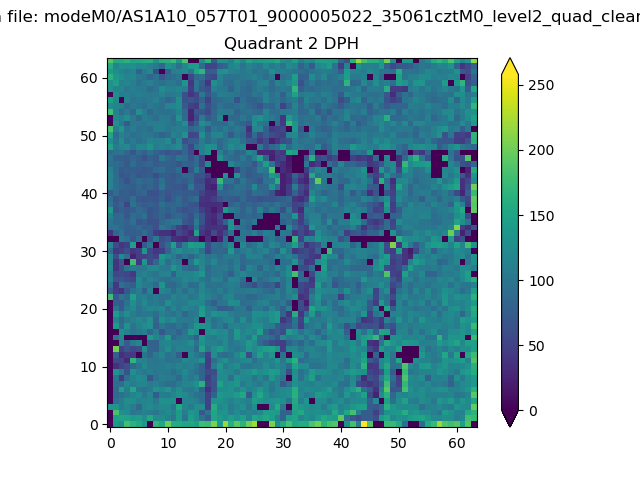 |
Quadrant C |
| Plot type | Count rate plots | Images |
|---|---|---|
| Comparison with Poisson distribution Blue bars denote a histogram of data divided into 1 sec bins. Red curve is a Poisson curve with rate = median count rate of data. |
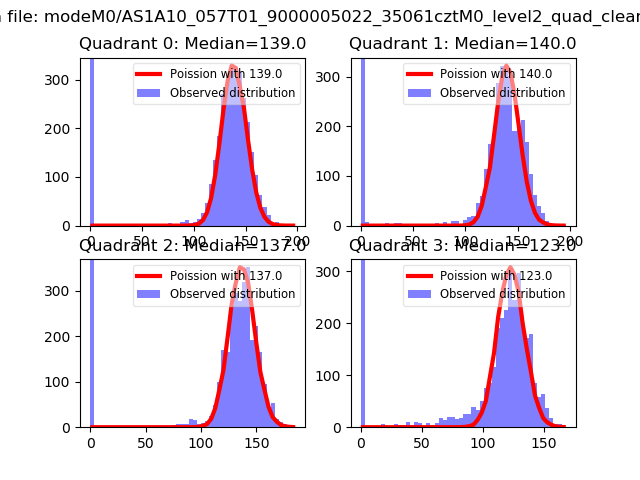 |
 |
| Quadrant-wise count rates Data is divided into 100 sec bins |
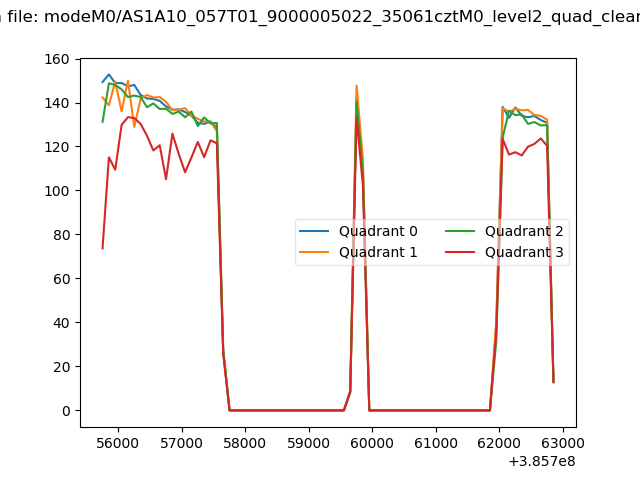 |
|
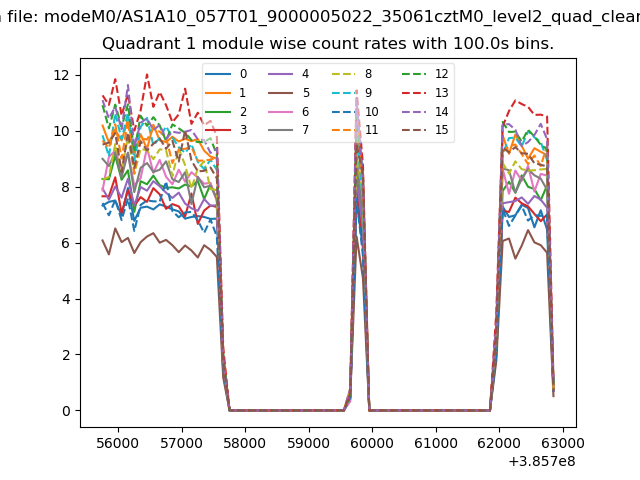
| Module-wise count rates for Quadrant A Data is divided into 100 sec bins |
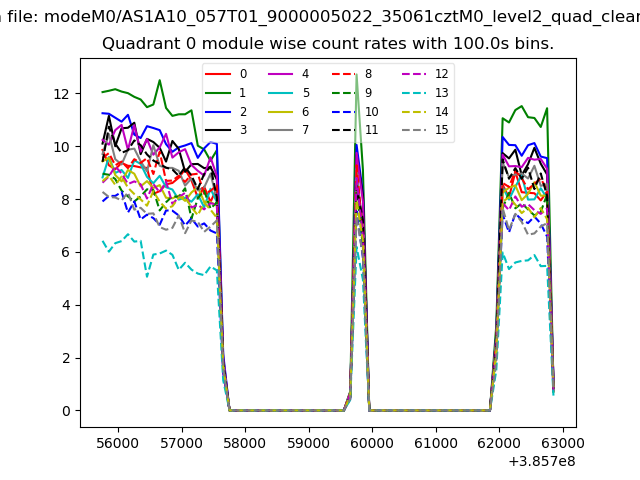 |
 |
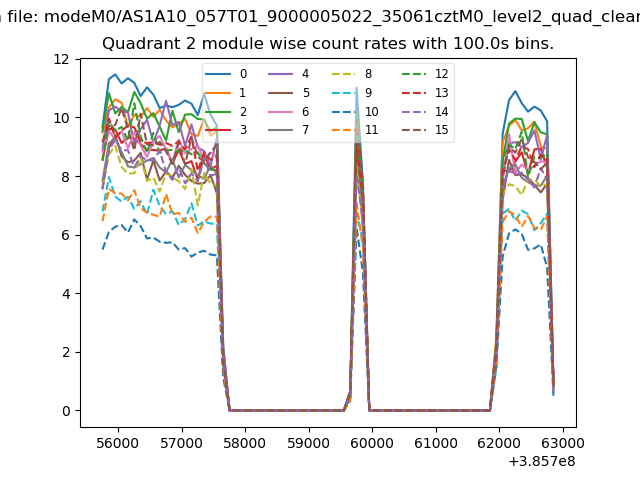
| Module-wise count rates for Quadrant B Data is divided into 100 sec bins |
 |
 |
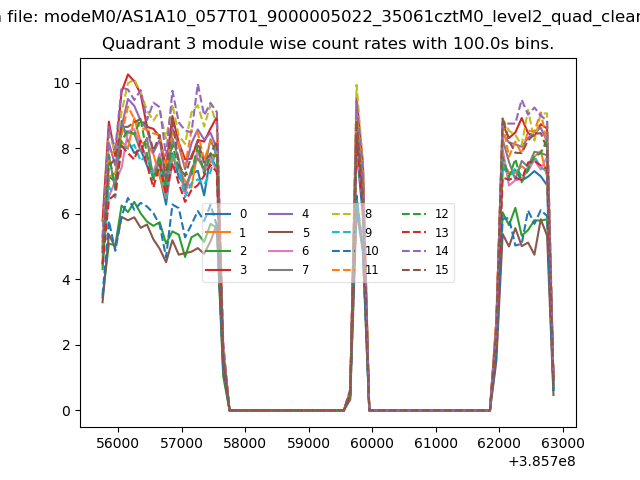
| Module-wise count rates for Quadrant C Data is divided into 100 sec bins |
 |
 |
| Module-wise count rates for Quadrant D Data is divided into 100 sec bins |
 |
 |
| Parameter | Plot |
|---|---|
| CZT HV Monitor | 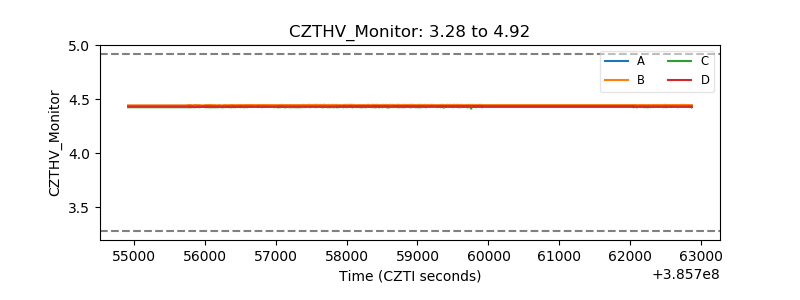 |
| D_VDD | 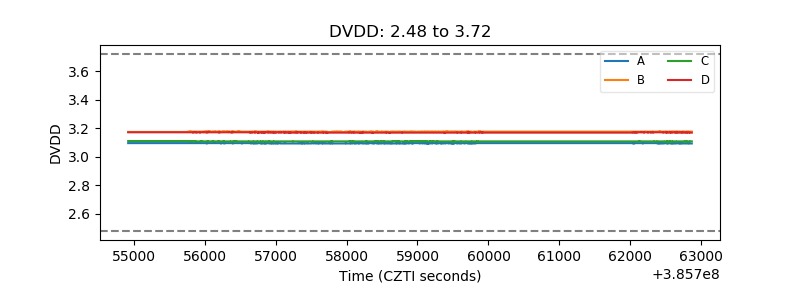 |
| Temperature 1 | 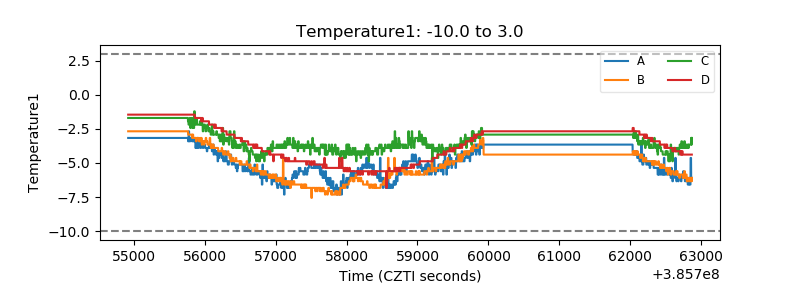 |
| Veto HV Monitor | 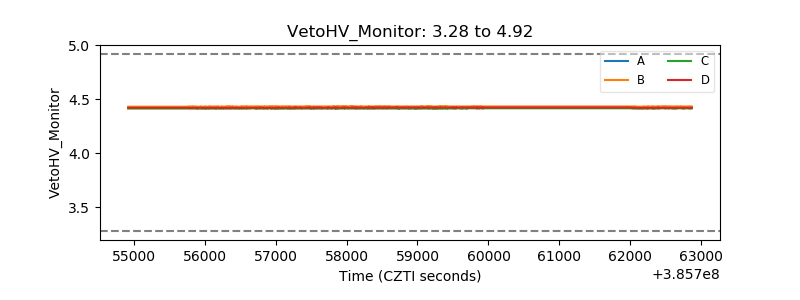 |
| Veto LLD | 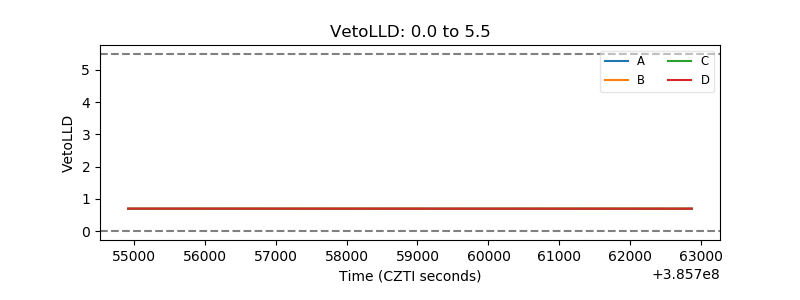 |
| Alpha Counter | 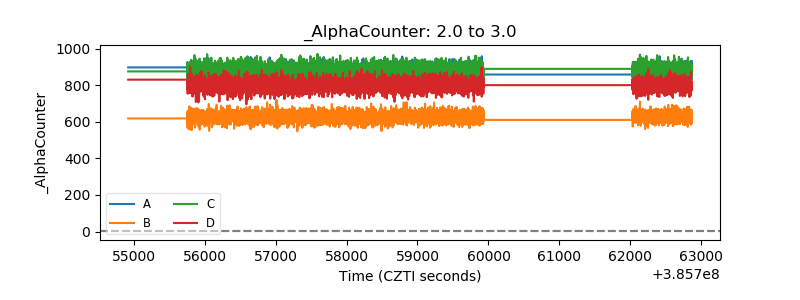 |
| _CPM_Rate | 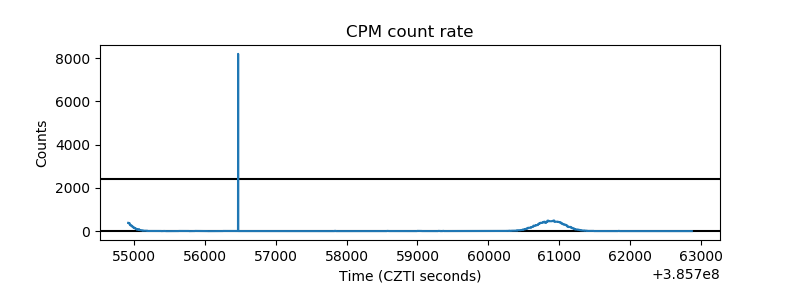 |
| CZT Counter | 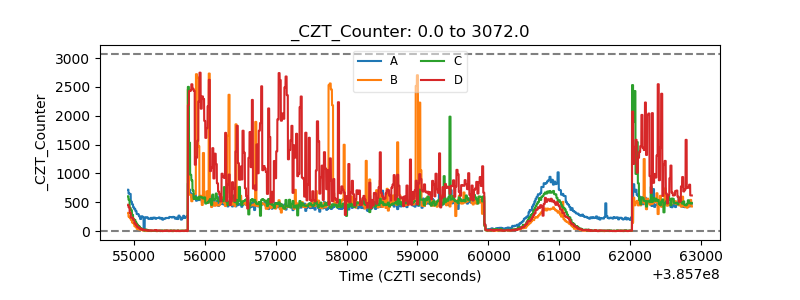 |
| +2.5 Volts monitor | 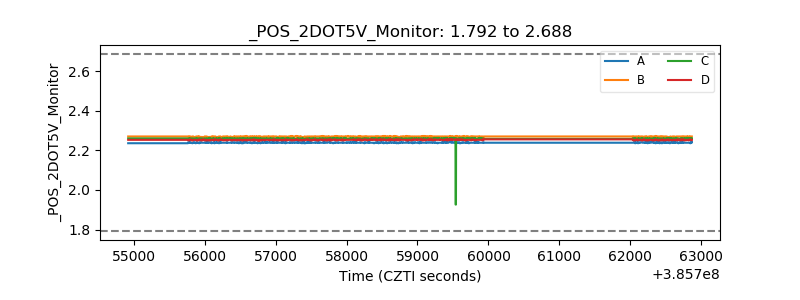 |
| +5 Volts monitor | 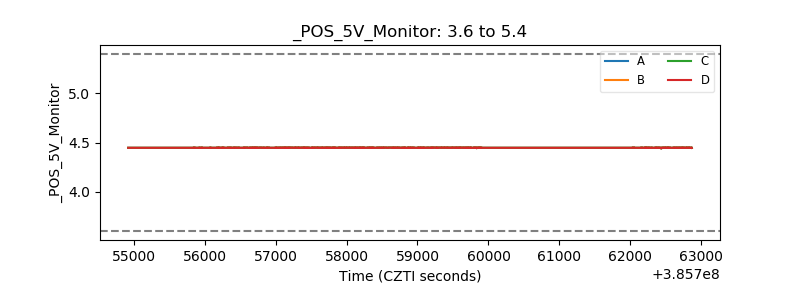 |
| _ROLL_ROT | 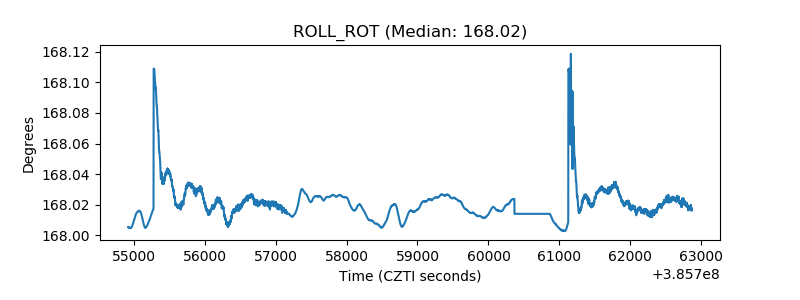 |
| _Roll_DEC | 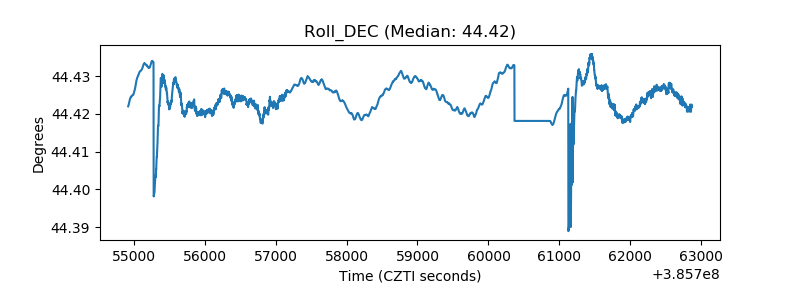 |
| _Roll_RA | 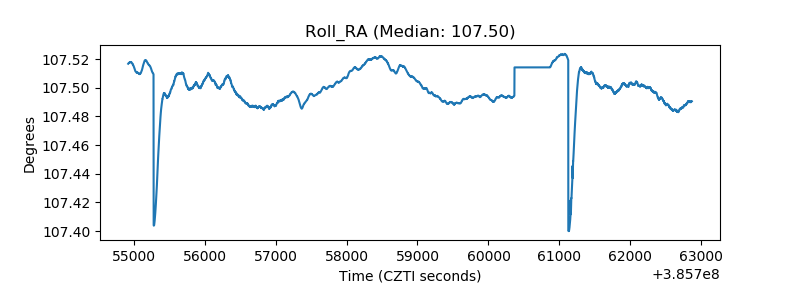 |
| Veto Counter | 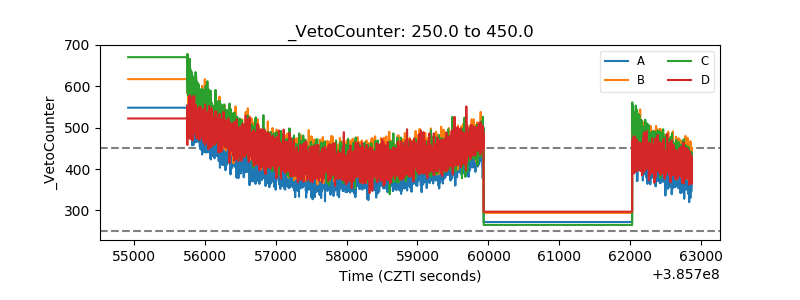 |