| Param | Original file | Final file |
|---|---|---|
| Filename | modeM0/AS1A10_053T44_9000005020cztM0_level2_bc.evt | modeM0/AS1A10_053T44_9000005020cztM0_level2_quad_clean.evt |
| Size (bytes) | 273,686,400 | 97,372,800 |
| Size | 261.0 MB | 92.9 MB |
| Events in quadrant A | 1,295,019 | 639,409 |
| Events in quadrant B | 2,118,960 | 645,960 |
| Events in quadrant C | 1,613,009 | 657,614 |
| Events in quadrant D | 2,872,479 | 613,472 |
| Mode M0 | |||
|---|---|---|---|
| Quadrant | BADHDUFLAG | Total packets | Discarded packets |
| A | 0 | 11559 | 0 |
| B | 0 | 14459 | 0 |
| C | 0 | 12151 | 0 |
| D | 0 | 17000 | 0 |
| Mode M9 | |||
|---|---|---|---|
| Quadrant | BADHDUFLAG | Total packets | Discarded packets |
| A | 0 | 24 | 0 |
| B | 0 | 24 | 0 |
| C | 0 | 24 | 0 |
| D | 0 | 24 | 0 |
| Mode SS | |||
|---|---|---|---|
| Quadrant | BADHDUFLAG | Total packets | Discarded packets |
| A | 0 | 116 | 0 |
| B | 0 | 116 | 0 |
| C | 0 | 116 | 0 |
| D | 0 | 116 | 0 |
| Quadrant | Total seconds | Saturated seconds | Saturation percentage |
|---|---|---|---|
| A | 5613 | 12 | 0.213789% |
| B | 5613 | 337 | 6.003919% |
| C | 5613 | 37 | 0.659184% |
| D | 5613 | 181 | 3.224657% |
Noise dominated data is calculated using 1-second bins in cleaned event files. If a bin has >2000 counts, and if more than 50% of those come from <1% of pixels, then it is considered to be noise-dominated and hence unusable.
| Quadrant | # 1 sec bins | Bins with >0 counts | Bins with >2000 counts | High rate bins dominated by noise | Noise dominated (total time) | Noise dominated (detector-on time) | Marked lightcurve |
|---|---|---|---|---|---|---|---|
| A | 7737 | 5614 | 1 | 1 | 0.01% | 0.02% | 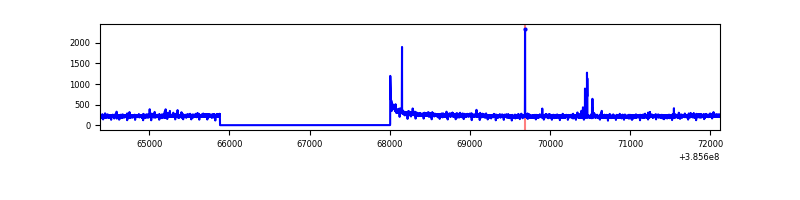 |
| B | 7737 | 5613 | 177 | 177 | 2.29% | 3.15% | 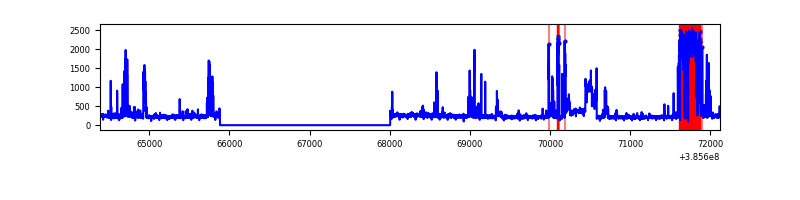 |
| C | 7737 | 5613 | 0 | 0 | 0.00% | 0.00% | 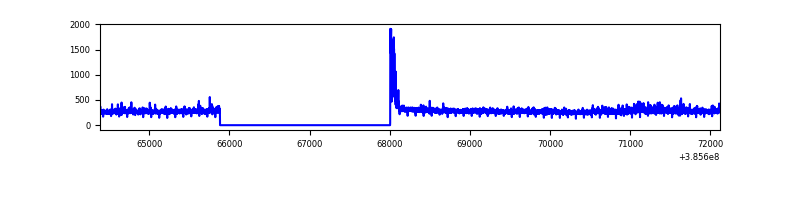 |
| D | 7737 | 5613 | 12 | 12 | 0.16% | 0.21% | 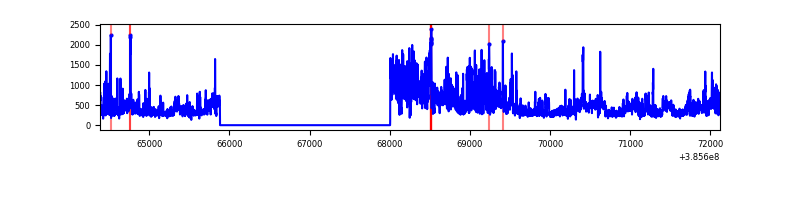 |
Top three noisy pixels from each quadrant. If the there are fewer than three noisy pixels in the level2.evt file, extra rows are filled as -1
| Pixel properties | Quadrant properties | ||||||
|---|---|---|---|---|---|---|---|
| Quadrant | DetID | PixID | Counts | Sigma | Mean | Median | Sigma |
| A | 10 | 83 | 47670 | 681.96 | 314 | 310 | 69.4 |
| A | 13 | 6 | 10090 | 140.83 | 314 | 310 | 69.4 |
| A | 7 | 16 | 9085 | 126.36 | 314 | 310 | 69.4 |
| B | 5 | 200 | 740374 | 11959.24 | 308 | 302 | 61.9 |
| B | 5 | 172 | 155093 | 2501.35 | 308 | 302 | 61.9 |
| B | 4 | 232 | 12135 | 191.21 | 308 | 302 | 61.9 |
| C | 15 | 214 | 217588 | 2921.92 | 318 | 316 | 74.4 |
| C | 14 | 67 | 70087 | 938.3 | 318 | 316 | 74.4 |
| C | 0 | 10 | 69849 | 935.09 | 318 | 316 | 74.4 |
| D | 8 | 195 | 1170325 | 15262.43 | 314 | 305 | 76.7 |
| D | 13 | 249 | 170096 | 2214.85 | 314 | 305 | 76.7 |
| D | 5 | 223 | 75252 | 977.65 | 314 | 305 | 76.7 |
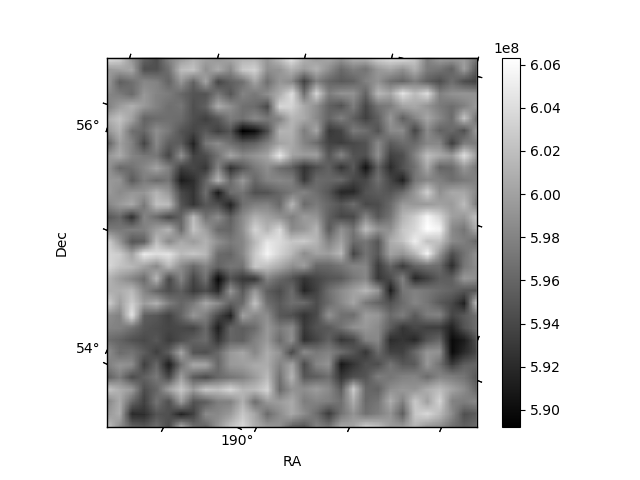
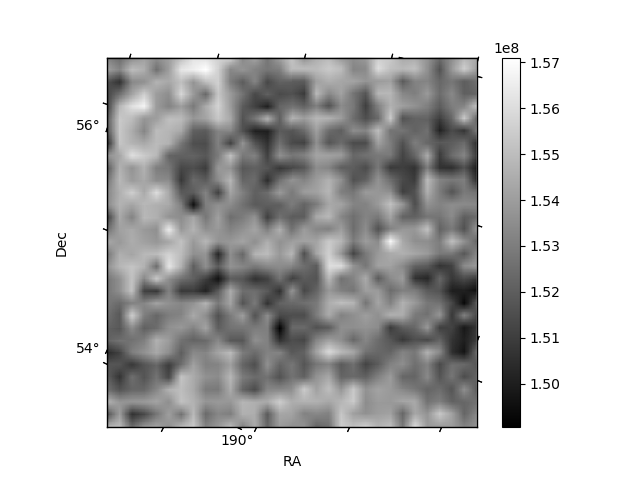
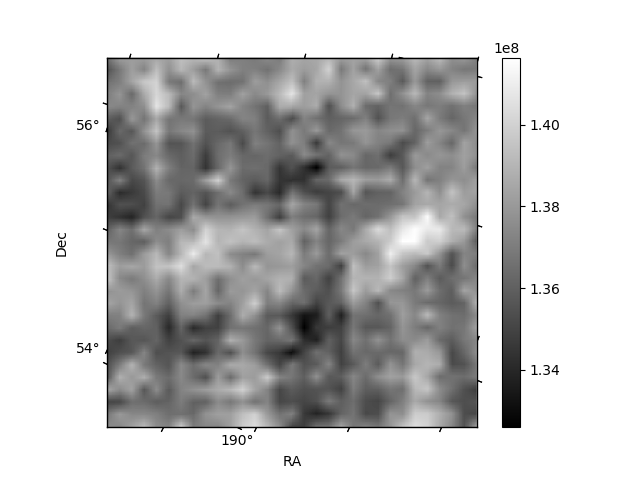
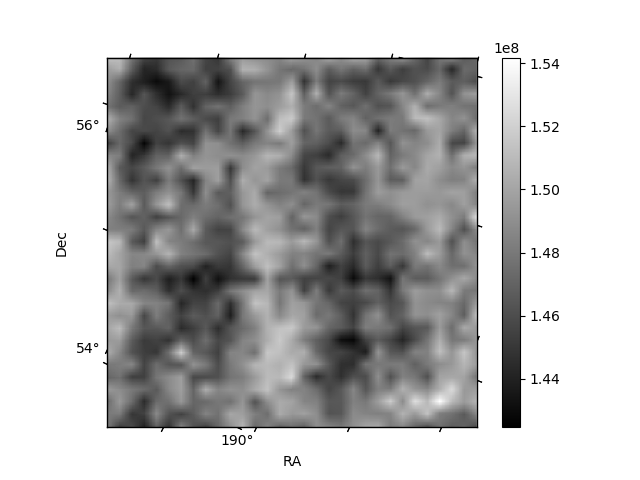
Histogram calculated using DETX and DETY for each event in the final _common_clean file
| Quadrant A | 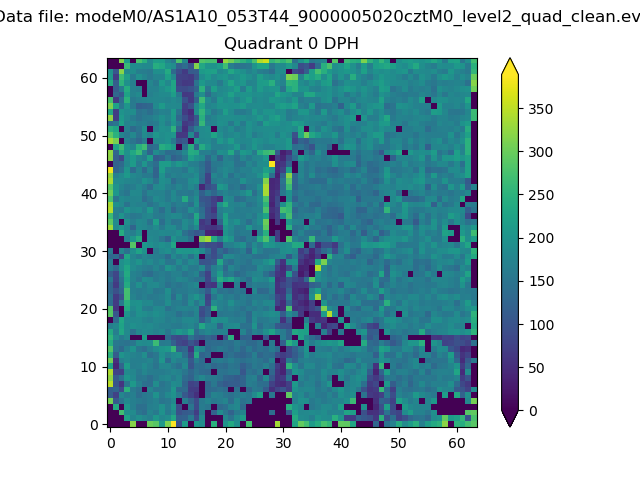 |
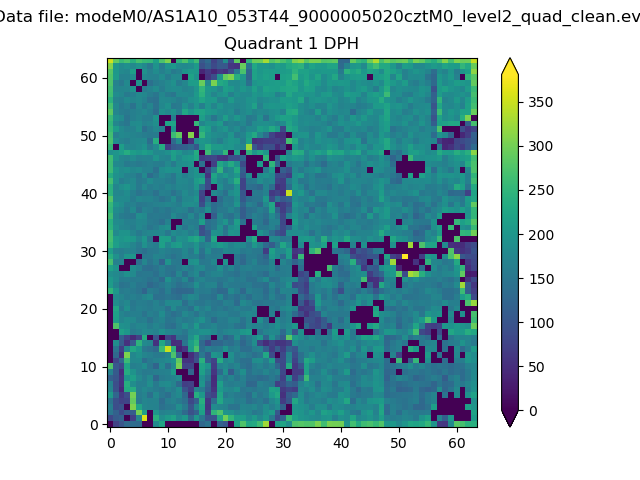 |
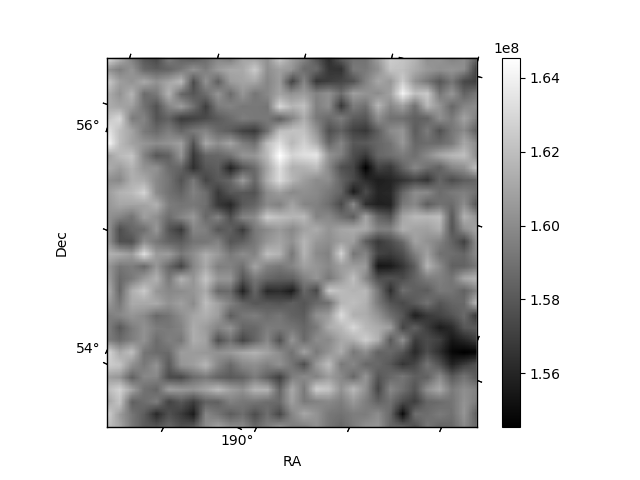
Quadrant B |
|---|---|---|---|
| Quadrant D | 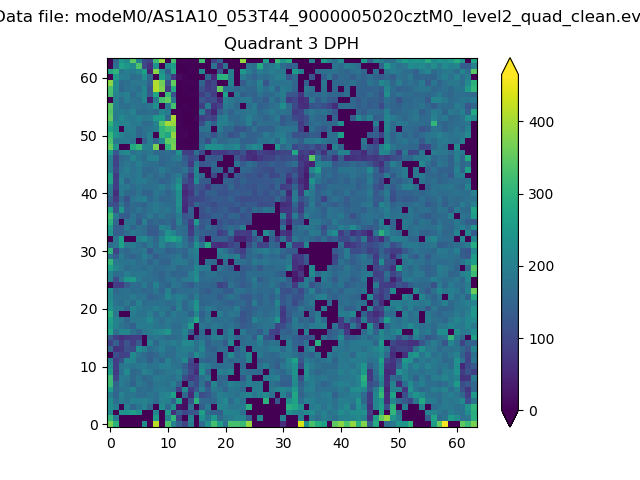 |
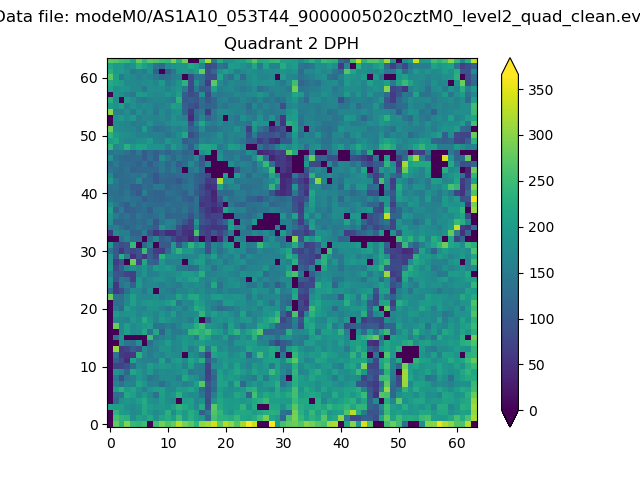 |
Quadrant C |
| Plot type | Count rate plots | Images |
|---|---|---|
| Comparison with Poisson distribution Blue bars denote a histogram of data divided into 1 sec bins. Red curve is a Poisson curve with rate = median count rate of data. |
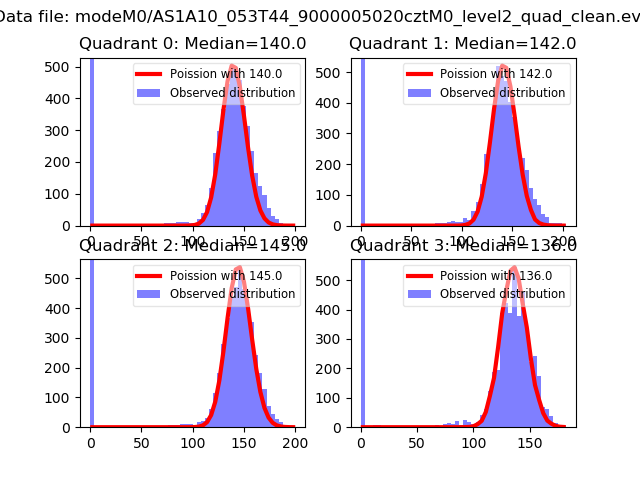 |
 |
| Quadrant-wise count rates Data is divided into 100 sec bins |
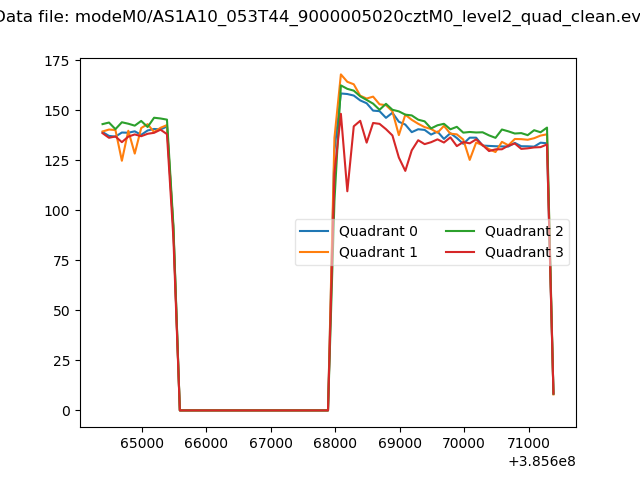 |
|
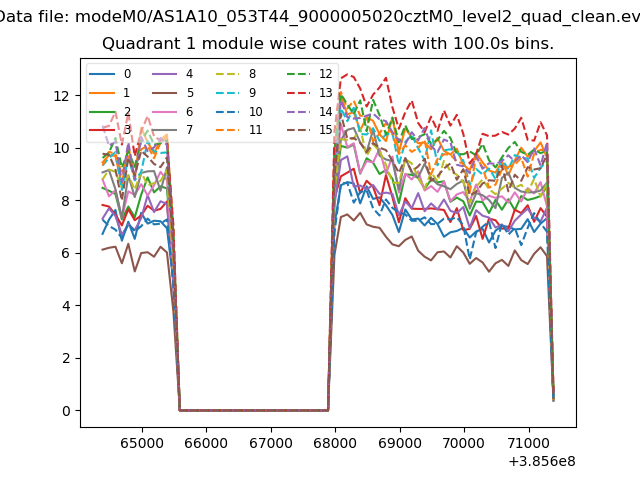
| Module-wise count rates for Quadrant A Data is divided into 100 sec bins |
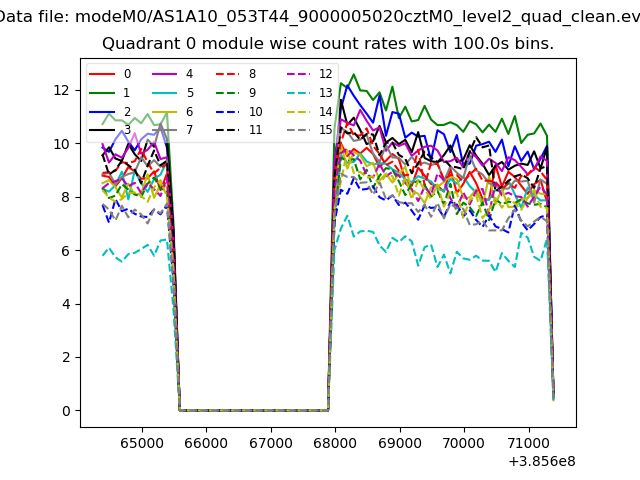 |
 |
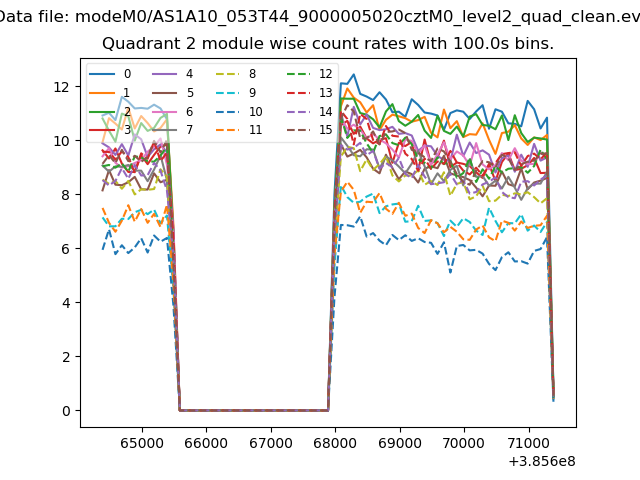
| Module-wise count rates for Quadrant B Data is divided into 100 sec bins |
 |
 |
| Module-wise count rates for Quadrant C Data is divided into 100 sec bins |
 |
 |
| Module-wise count rates for Quadrant D Data is divided into 100 sec bins |
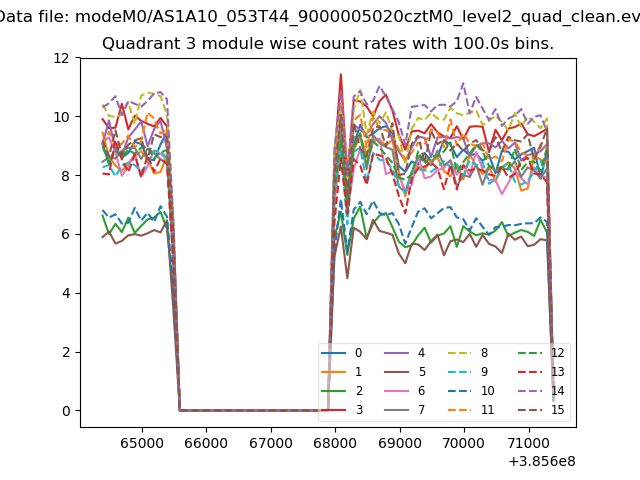 |
 |
| Parameter | Plot |
|---|---|
| CZT HV Monitor | 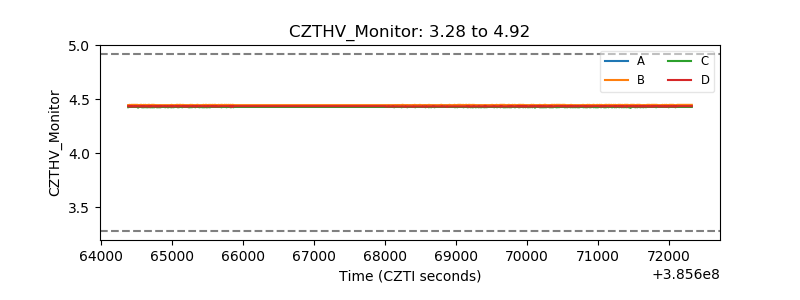 |
| D_VDD | 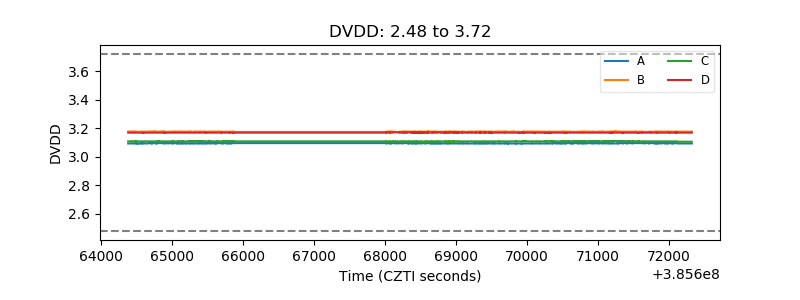 |
| Temperature 1 | 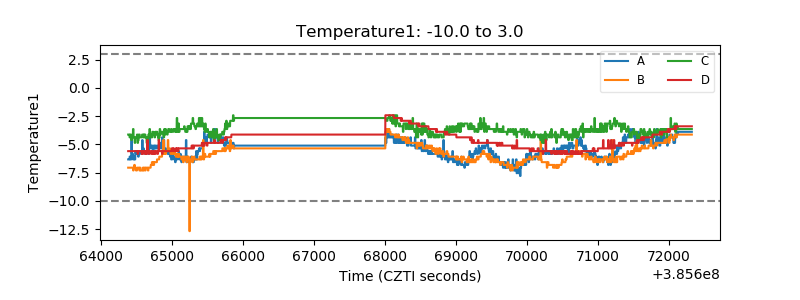 |
| Veto HV Monitor | 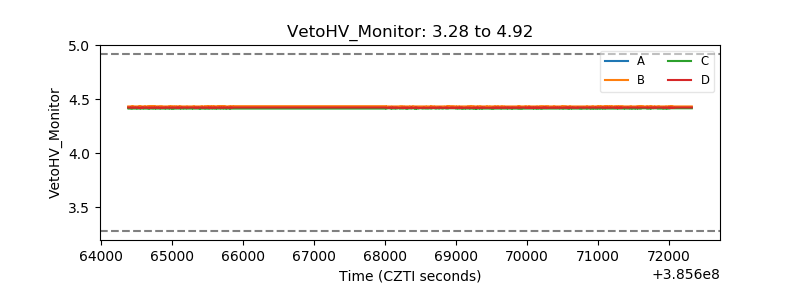 |
| Veto LLD | 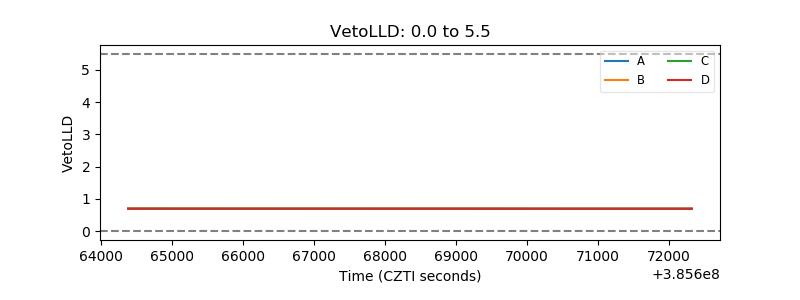 |
| Alpha Counter | 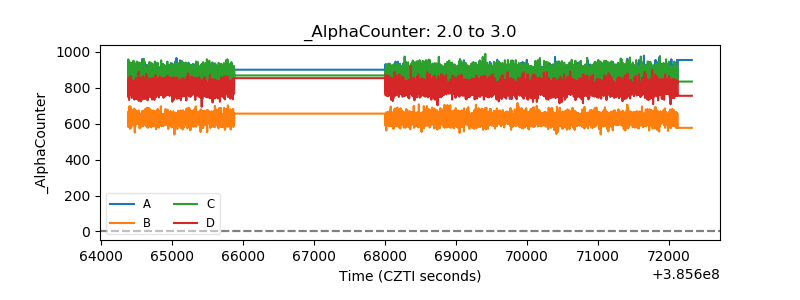 |
| _CPM_Rate | 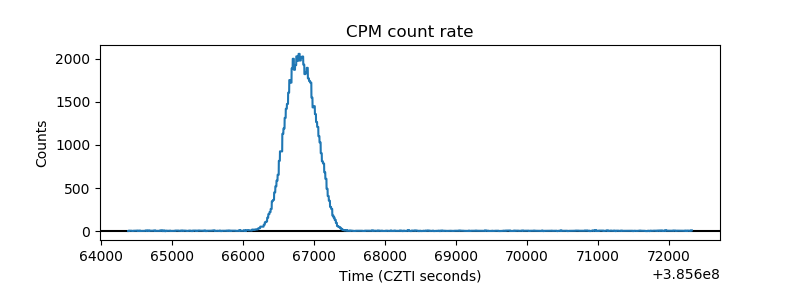 |
| CZT Counter | 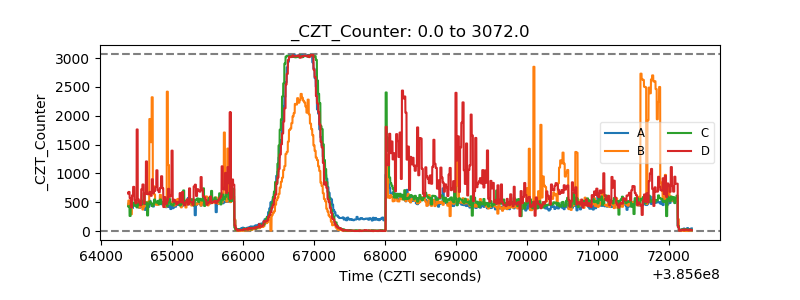 |
| +2.5 Volts monitor | 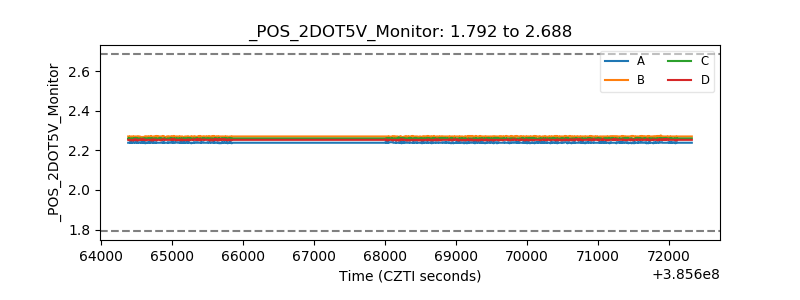 |
| +5 Volts monitor | 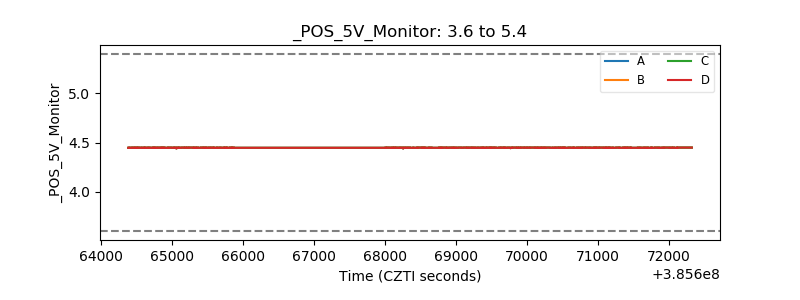 |
| _ROLL_ROT | 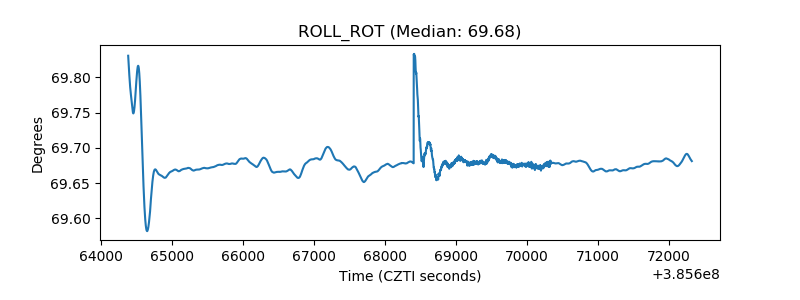 |
| _Roll_DEC | 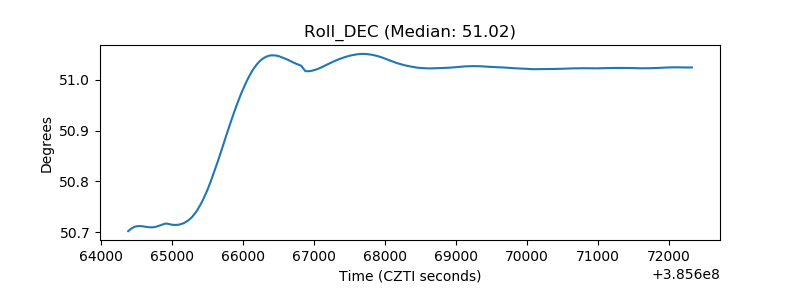 |
| _Roll_RA | 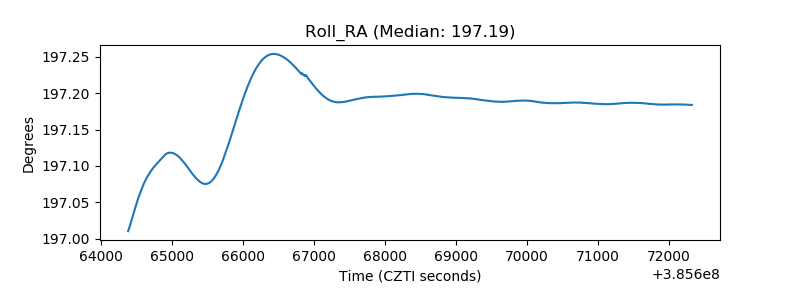 |
| Veto Counter | 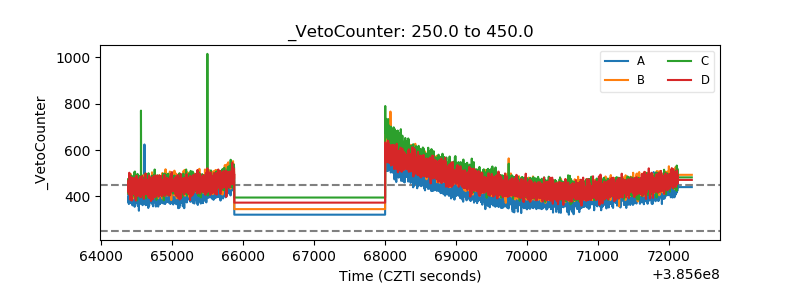 |