| Param | Original file | Final file |
|---|---|---|
| Filename | modeM0/AS1T05_010T01_9000005016_35034cztM0_level2.evt | modeM0/AS1T05_010T01_9000005016_35034cztM0_level2_quad_clean.evt |
| Size (bytes) | 482,244,480 | 80,147,520 |
| Size | 459.9 MB | 76.4 MB |
| Events in quadrant A | 2,730,175 | 518,047 |
| Events in quadrant B | 4,418,895 | 518,333 |
| Events in quadrant C | 2,980,635 | 511,518 |
| Events in quadrant D | 4,086,382 | 478,739 |
| Mode M0 | |||
|---|---|---|---|
| Quadrant | BADHDUFLAG | Total packets | Discarded packets |
| A | 0 | 11782 | 3 |
| B | 0 | 16868 | 2 |
| C | 0 | 12054 | 2 |
| D | 0 | 16127 | 2 |
| Mode M9 | |||
|---|---|---|---|
| Quadrant | BADHDUFLAG | Total packets | Discarded packets |
| A | 0 | 35 | 0 |
| B | 0 | 35 | 0 |
| C | 0 | 35 | 0 |
| D | 0 | 35 | 0 |
| Mode SS | |||
|---|---|---|---|
| Quadrant | BADHDUFLAG | Total packets | Discarded packets |
| A | 0 | 118 | 0 |
| B | 0 | 118 | 0 |
| C | 0 | 118 | 0 |
| D | 0 | 118 | 0 |
| Quadrant | Total seconds | Saturated seconds | Saturation percentage |
|---|---|---|---|
| A | 5728 | 10 | 0.174581% |
| B | 5728 | 672 | 11.731844% |
| C | 5728 | 24 | 0.418994% |
| D | 5728 | 72 | 1.256983% |
Noise dominated data is calculated using 1-second bins in cleaned event files. If a bin has >2000 counts, and if more than 50% of those come from <1% of pixels, then it is considered to be noise-dominated and hence unusable.
| Quadrant | # 1 sec bins | Bins with >0 counts | Bins with >2000 counts | High rate bins dominated by noise | Noise dominated (total time) | Noise dominated (detector-on time) | Marked lightcurve |
|---|---|---|---|---|---|---|---|
| A | 9191 | 5730 | 2 | 2 | 0.02% | 0.03% | 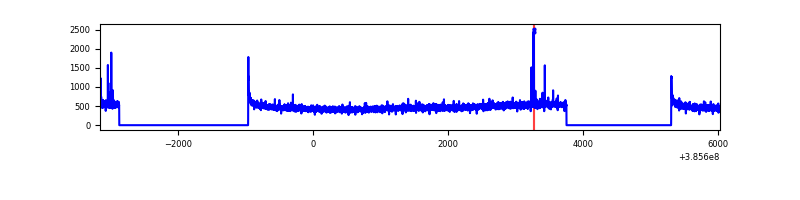 |
| B | 9190 | 5729 | 651 | 651 | 7.08% | 11.36% | 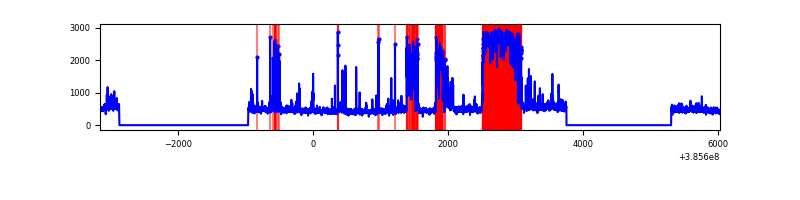 |
| C | 9191 | 5730 | 19 | 19 | 0.21% | 0.33% |  |
| D | 9191 | 5730 | 52 | 52 | 0.57% | 0.91% | 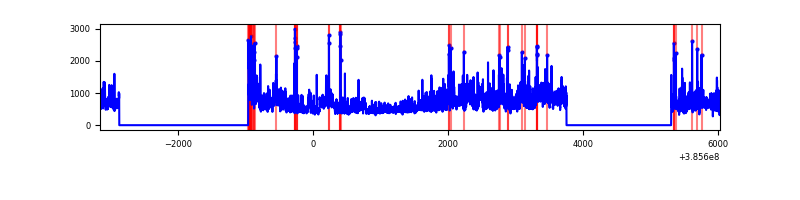 |
Top three noisy pixels from each quadrant. If the there are fewer than three noisy pixels in the level2.evt file, extra rows are filled as -1
| Pixel properties | Quadrant properties | ||||||
|---|---|---|---|---|---|---|---|
| Quadrant | DetID | PixID | Counts | Sigma | Mean | Median | Sigma |
| A | 10 | 83 | 79456 | 578.15 | 675 | 663 | 136.3 |
| A | 15 | 174 | 24953 | 178.23 | 675 | 663 | 136.3 |
| A | 13 | 6 | 16988 | 119.79 | 675 | 663 | 136.3 |
| B | 5 | 200 | 1801272 | 15209.47 | 612 | 594 | 118.4 |
| B | 5 | 172 | 89961 | 754.84 | 612 | 594 | 118.4 |
| B | 4 | 232 | 44153 | 367.92 | 612 | 594 | 118.4 |
| C | 15 | 214 | 239234 | 1566.88 | 660 | 666 | 152.3 |
| C | 0 | 10 | 94577 | 616.79 | 660 | 666 | 152.3 |
| C | 14 | 67 | 58850 | 382.14 | 660 | 666 | 152.3 |
| D | 8 | 195 | 1178235 | 7272.35 | 657 | 640 | 161.9 |
| D | 13 | 249 | 157044 | 965.89 | 657 | 640 | 161.9 |
| D | 10 | 199 | 73232 | 448.3 | 657 | 640 | 161.9 |
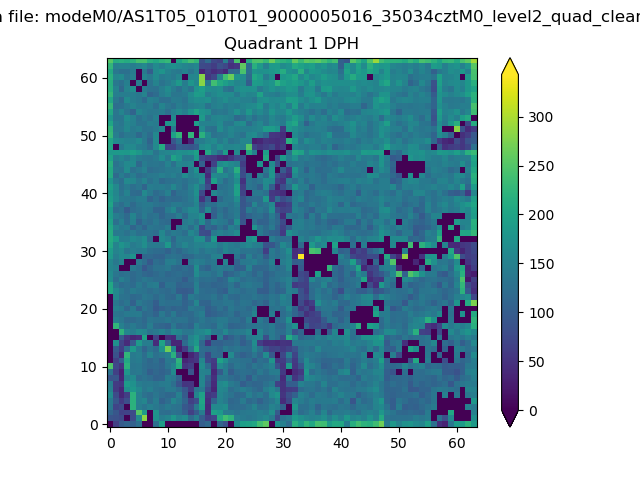
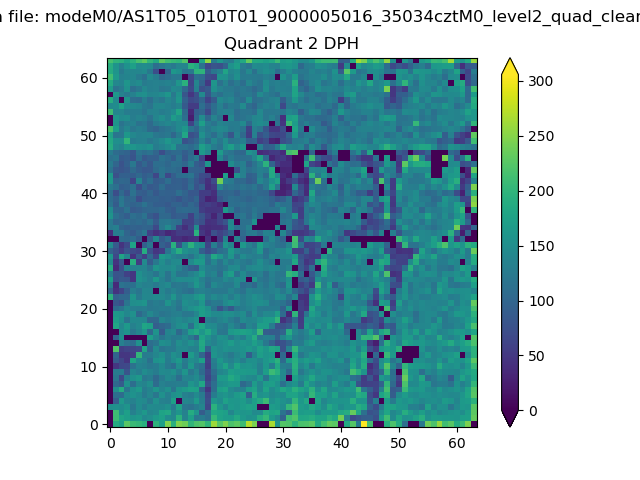
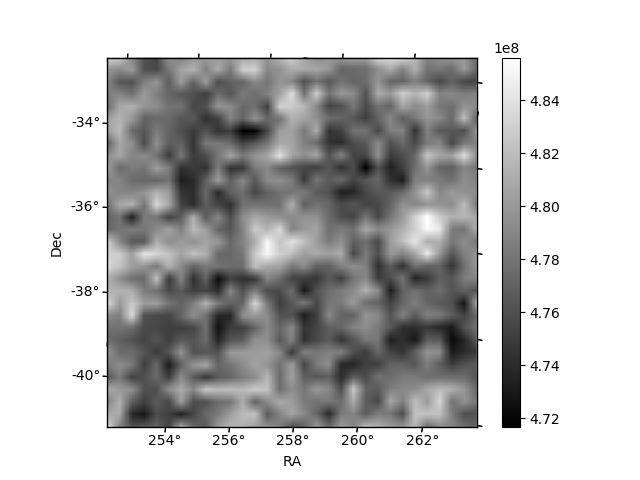
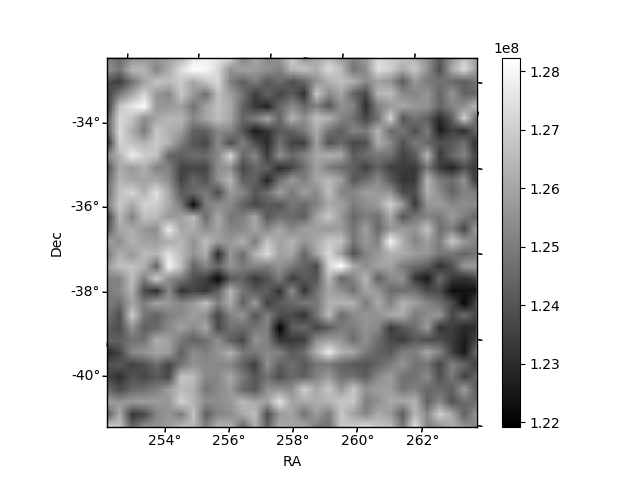
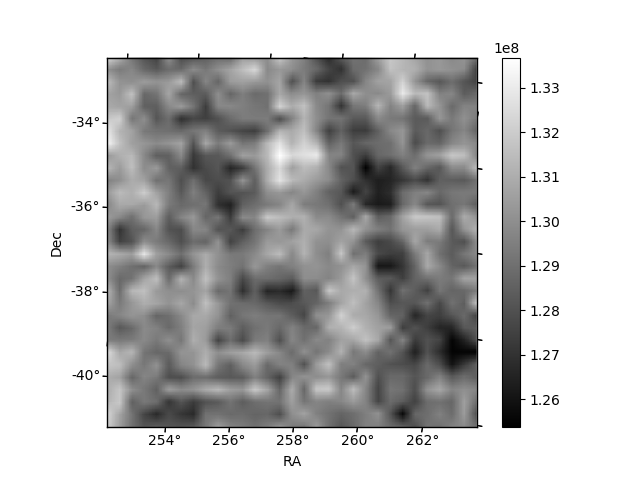
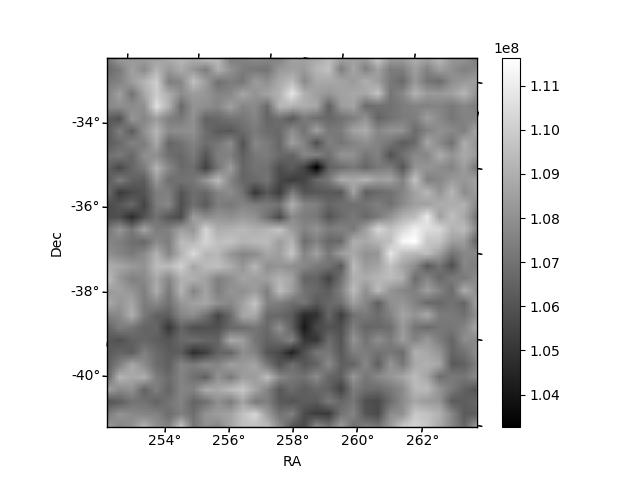
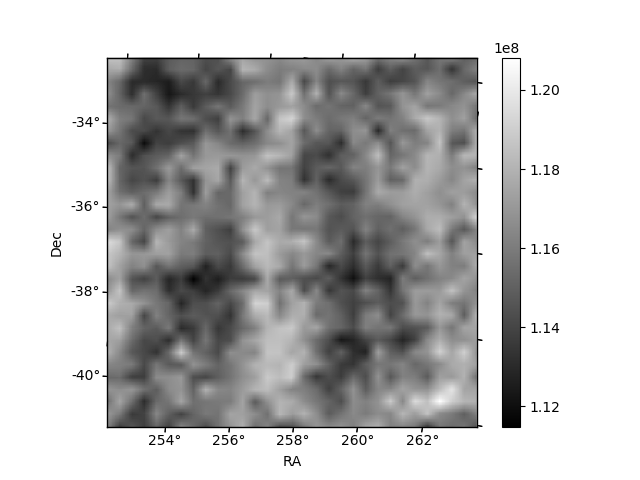
Histogram calculated using DETX and DETY for each event in the final _common_clean file
| Quadrant A | 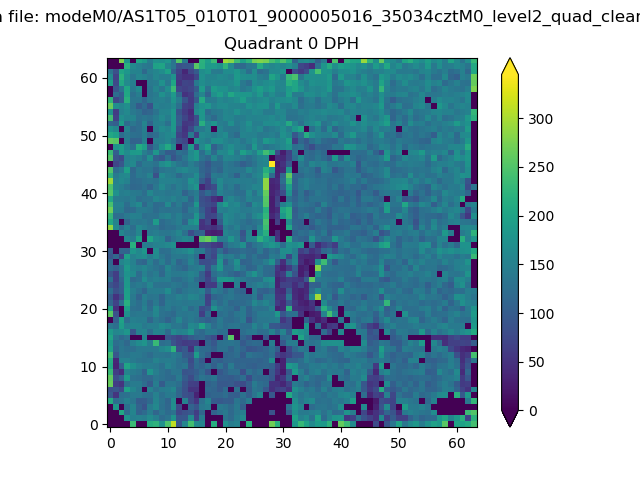 |
 |
Quadrant B |
|---|---|---|---|
| Quadrant D | 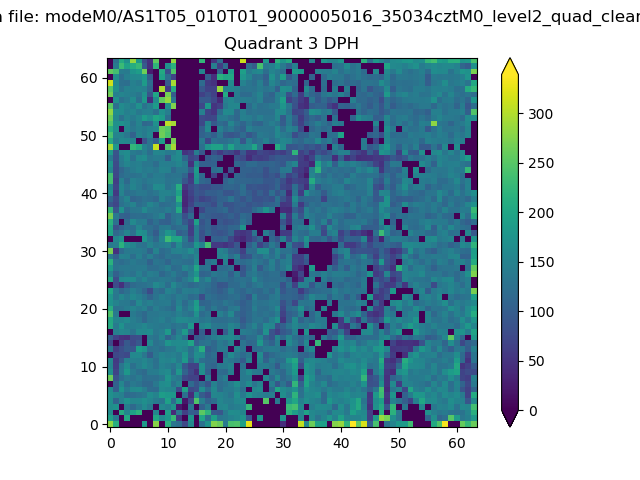 |
 |
Quadrant C |
| Plot type | Count rate plots | Images |
|---|---|---|
| Comparison with Poisson distribution Blue bars denote a histogram of data divided into 1 sec bins. Red curve is a Poisson curve with rate = median count rate of data. |
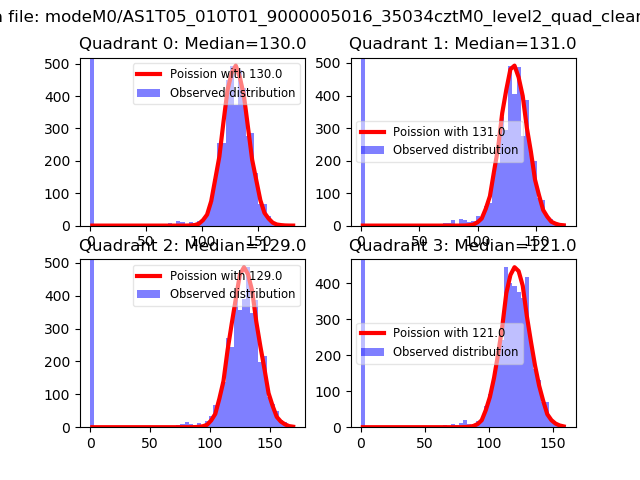 |
 |
| Quadrant-wise count rates Data is divided into 100 sec bins |
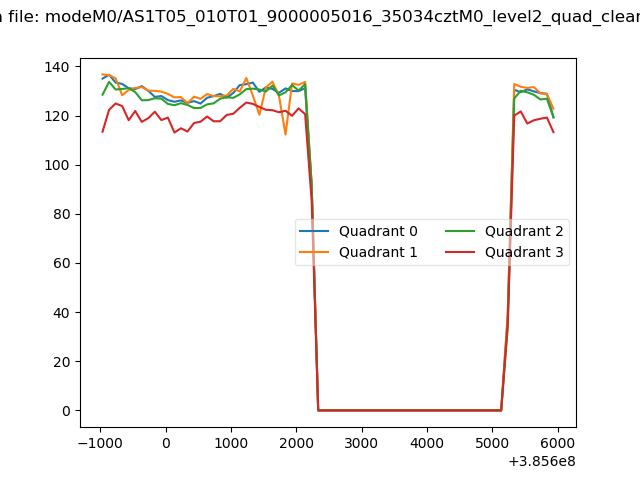 |
|
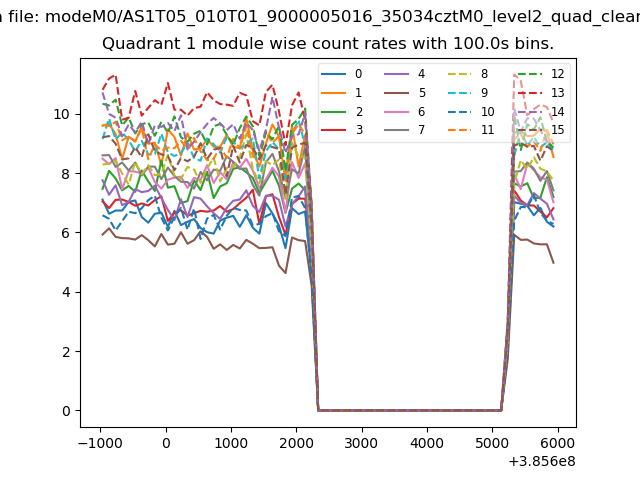
| Module-wise count rates for Quadrant A Data is divided into 100 sec bins |
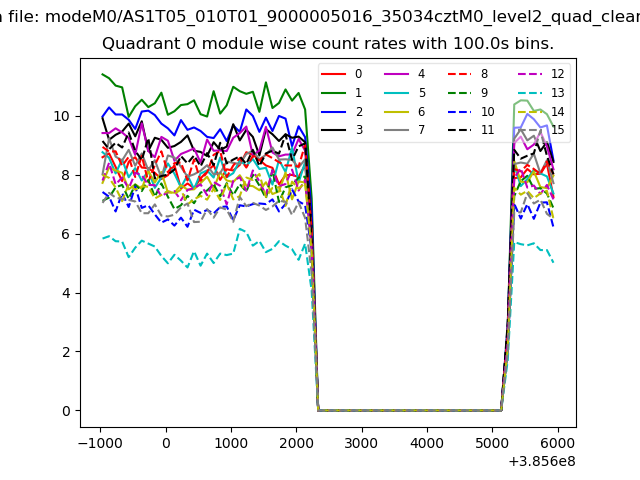 |
 |
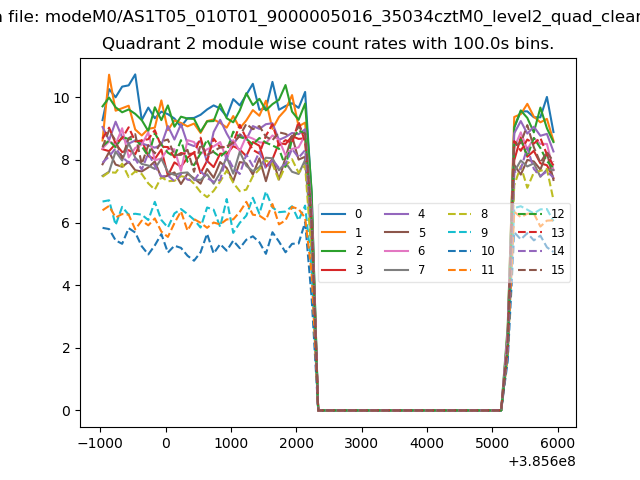
| Module-wise count rates for Quadrant B Data is divided into 100 sec bins |
 |
 |
| Module-wise count rates for Quadrant C Data is divided into 100 sec bins |
 |
 |
| Module-wise count rates for Quadrant D Data is divided into 100 sec bins |
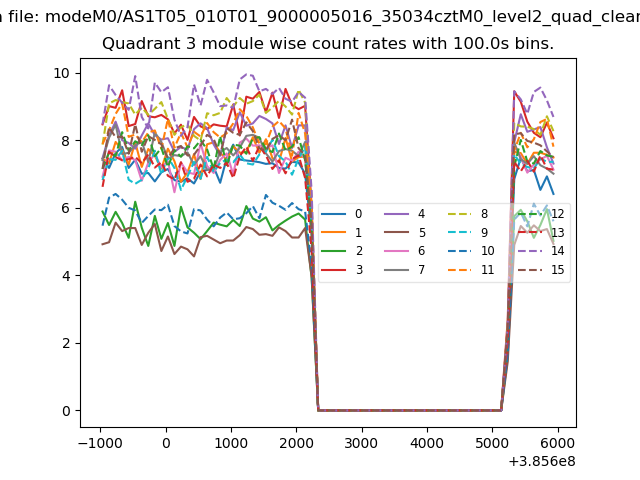 |
 |
| Parameter | Plot |
|---|---|
| CZT HV Monitor | 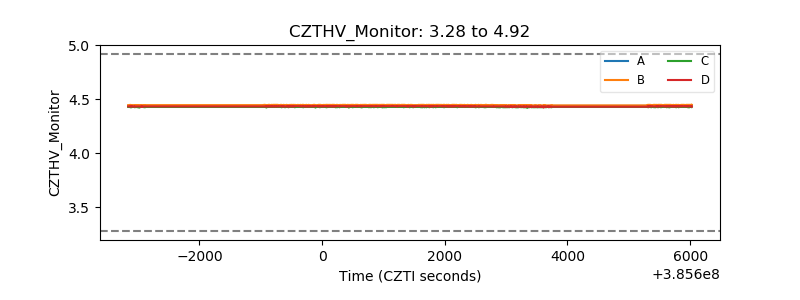 |
| D_VDD | 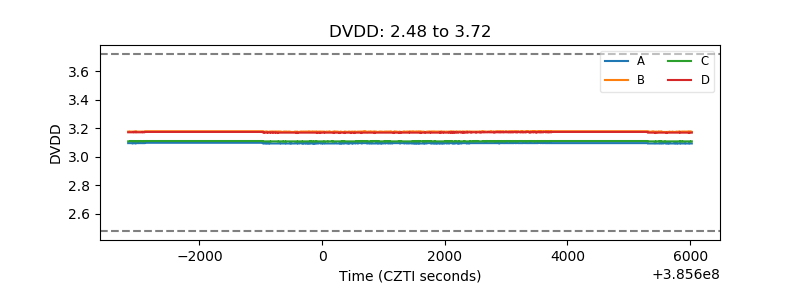 |
| Temperature 1 | 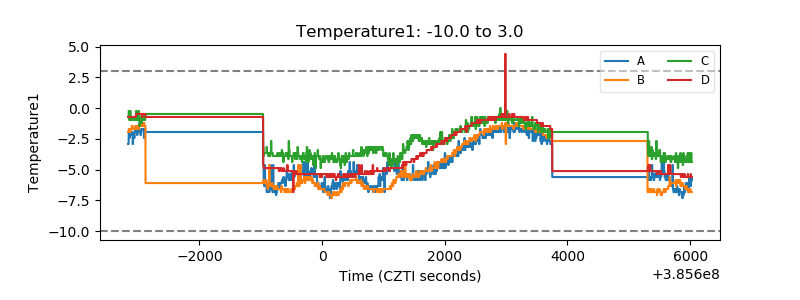 |
| Veto HV Monitor | 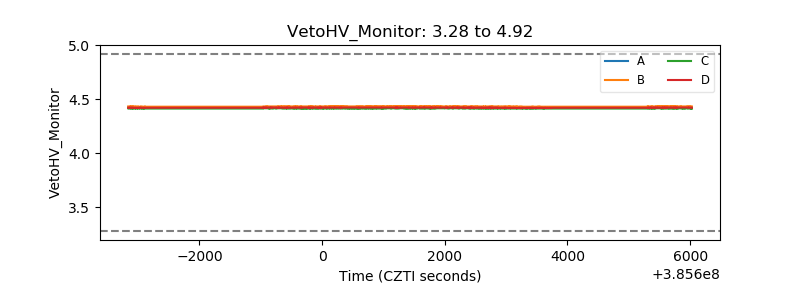 |
| Veto LLD | 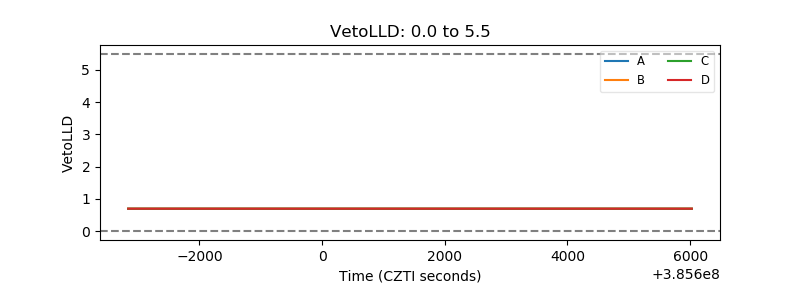 |
| Alpha Counter | 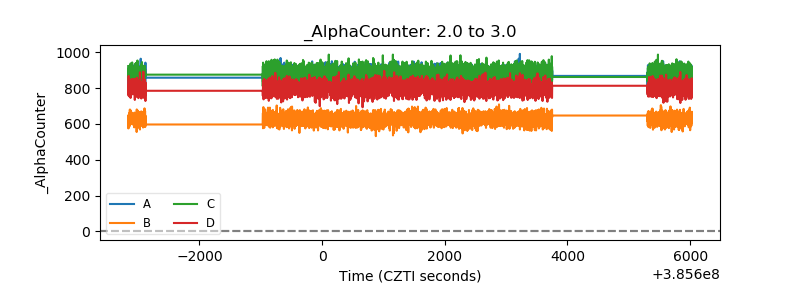 |
| _CPM_Rate | 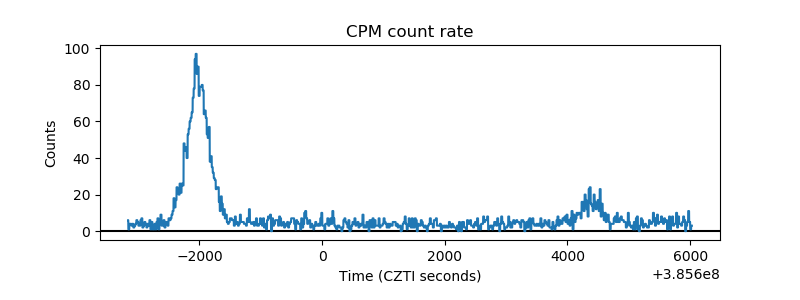 |
| CZT Counter | 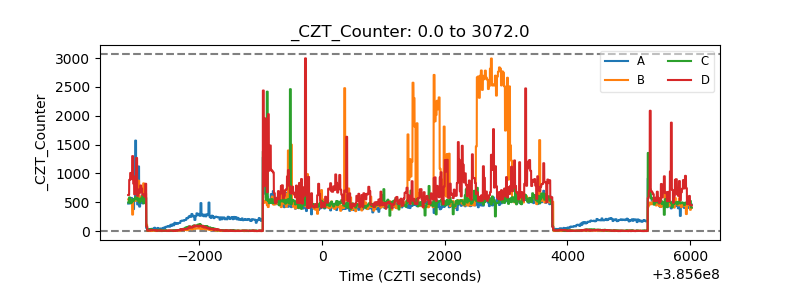 |
| +2.5 Volts monitor | 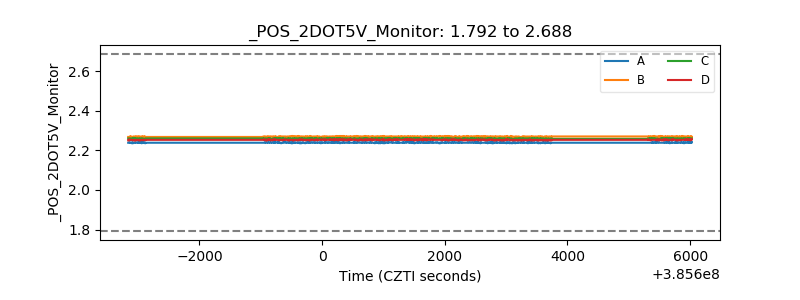 |
| +5 Volts monitor | 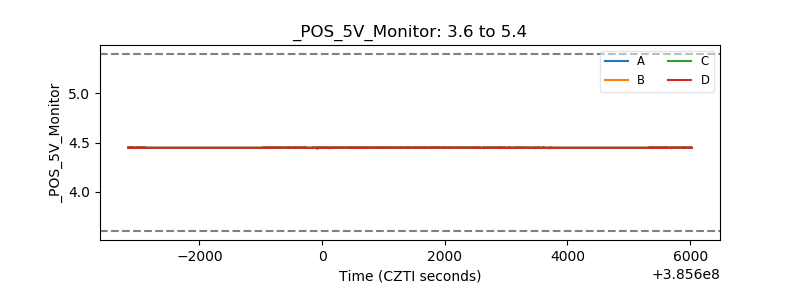 |
| _ROLL_ROT | 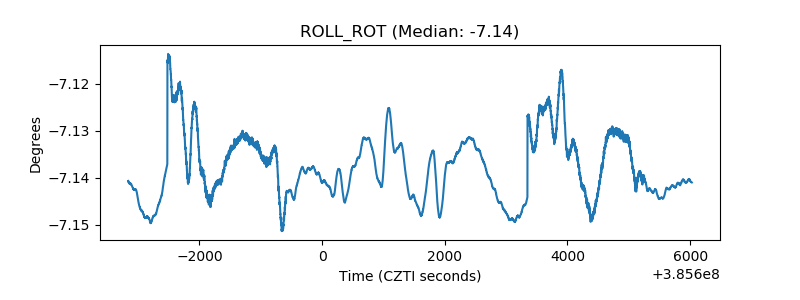 |
| _Roll_DEC | 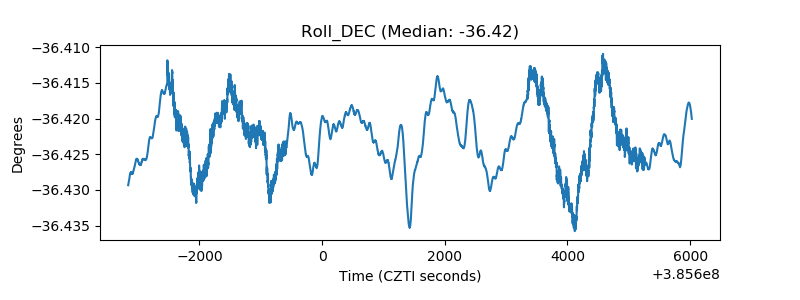 |
| _Roll_RA | 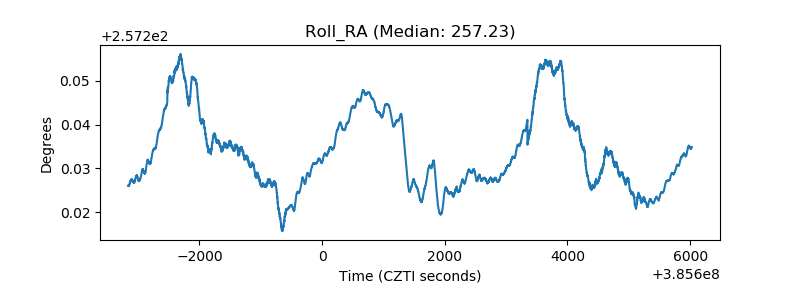 |
| Veto Counter | 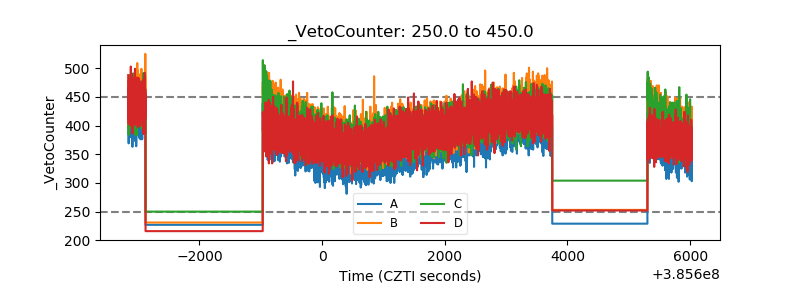 |