| Param | Original file | Final file |
|---|---|---|
| Filename | modeM0/AS1T05_010T01_9000005016_35033cztM0_level2.evt | modeM0/AS1T05_010T01_9000005016_35033cztM0_level2_quad_clean.evt |
| Size (bytes) | 397,912,320 | 90,054,720 |
| Size | 379.5 MB | 85.9 MB |
| Events in quadrant A | 2,456,503 | 604,737 |
| Events in quadrant B | 2,686,898 | 613,282 |
| Events in quadrant C | 2,671,227 | 596,085 |
| Events in quadrant D | 3,888,001 | 554,131 |
| Mode M0 | |||
|---|---|---|---|
| Quadrant | BADHDUFLAG | Total packets | Discarded packets |
| A | 0 | 10592 | 3 |
| B | 0 | 11227 | 2 |
| C | 0 | 10757 | 2 |
| D | 0 | 15133 | 2 |
| Mode M9 | |||
|---|---|---|---|
| Quadrant | BADHDUFLAG | Total packets | Discarded packets |
| A | 0 | 36 | 0 |
| B | 0 | 36 | 0 |
| C | 0 | 36 | 0 |
| D | 0 | 37 | 0 |
| Mode SS | |||
|---|---|---|---|
| Quadrant | BADHDUFLAG | Total packets | Discarded packets |
| A | 0 | 102 | 0 |
| B | 0 | 102 | 0 |
| C | 0 | 102 | 0 |
| D | 0 | 102 | 0 |
| Quadrant | Total seconds | Saturated seconds | Saturation percentage |
|---|---|---|---|
| A | 5131 | 12 | 0.233873% |
| B | 5131 | 34 | 0.662639% |
| C | 5131 | 25 | 0.487234% |
| D | 5131 | 82 | 1.598129% |
Noise dominated data is calculated using 1-second bins in cleaned event files. If a bin has >2000 counts, and if more than 50% of those come from <1% of pixels, then it is considered to be noise-dominated and hence unusable.
| Quadrant | # 1 sec bins | Bins with >0 counts | Bins with >2000 counts | High rate bins dominated by noise | Noise dominated (total time) | Noise dominated (detector-on time) | Marked lightcurve |
|---|---|---|---|---|---|---|---|
| A | 7042 | 5132 | 2 | 2 | 0.03% | 0.04% | 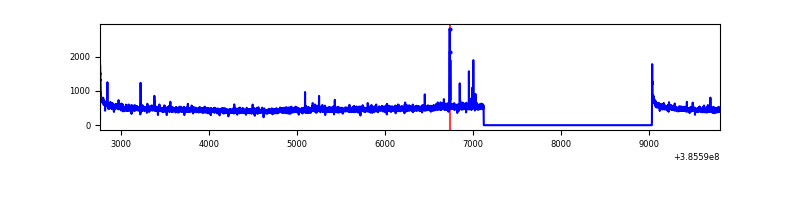 |
| B | 7042 | 5132 | 20 | 20 | 0.28% | 0.39% | 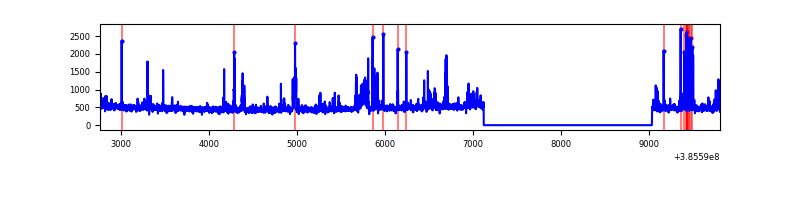 |
| C | 7042 | 5132 | 21 | 21 | 0.30% | 0.41% | 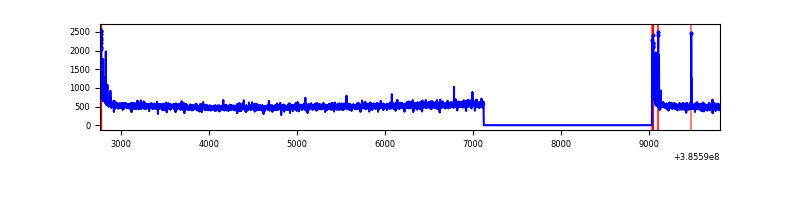 |
| D | 7042 | 5132 | 73 | 73 | 1.04% | 1.42% | 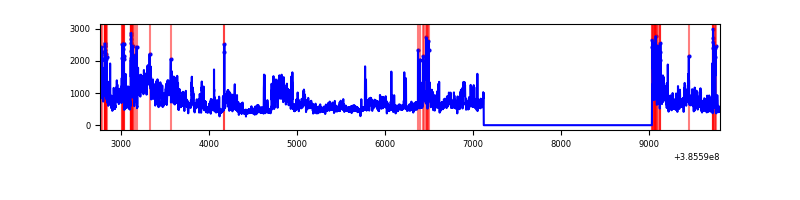 |
Top three noisy pixels from each quadrant. If the there are fewer than three noisy pixels in the level2.evt file, extra rows are filled as -1
| Pixel properties | Quadrant properties | ||||||
|---|---|---|---|---|---|---|---|
| Quadrant | DetID | PixID | Counts | Sigma | Mean | Median | Sigma |
| A | 10 | 83 | 74870 | 607.53 | 605 | 595 | 122.3 |
| A | 15 | 174 | 23421 | 186.7 | 605 | 595 | 122.3 |
| A | 13 | 6 | 11790 | 91.57 | 605 | 595 | 122.3 |
| B | 5 | 172 | 130684 | 1119.83 | 605 | 589 | 116.2 |
| B | 4 | 232 | 61185 | 521.6 | 605 | 589 | 116.2 |
| B | 5 | 200 | 58151 | 495.48 | 605 | 589 | 116.2 |
| C | 15 | 214 | 213372 | 1552.07 | 593 | 599 | 137.1 |
| C | 0 | 10 | 100432 | 728.23 | 593 | 599 | 137.1 |
| C | 14 | 67 | 39517 | 283.88 | 593 | 599 | 137.1 |
| D | 8 | 195 | 1145131 | 7962.58 | 585 | 569 | 143.7 |
| D | 13 | 249 | 128606 | 890.74 | 585 | 569 | 143.7 |
| D | 2 | 31 | 113083 | 782.75 | 585 | 569 | 143.7 |
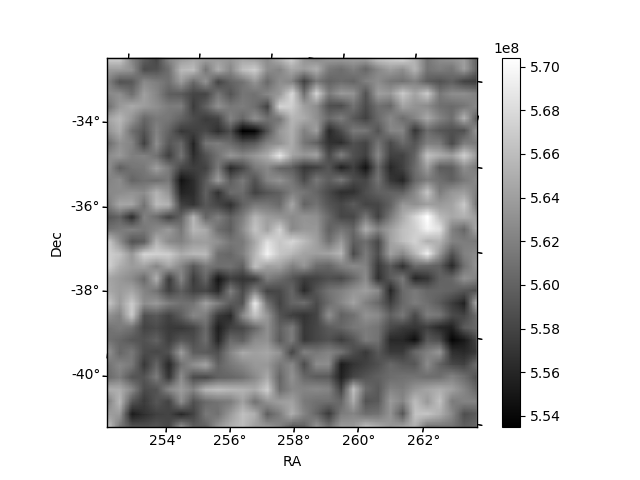
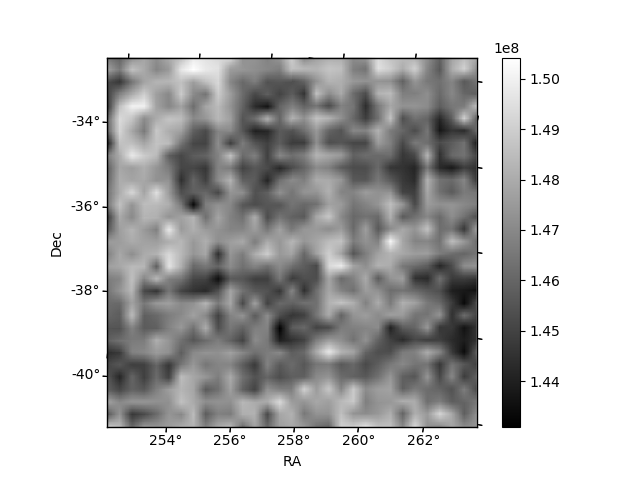
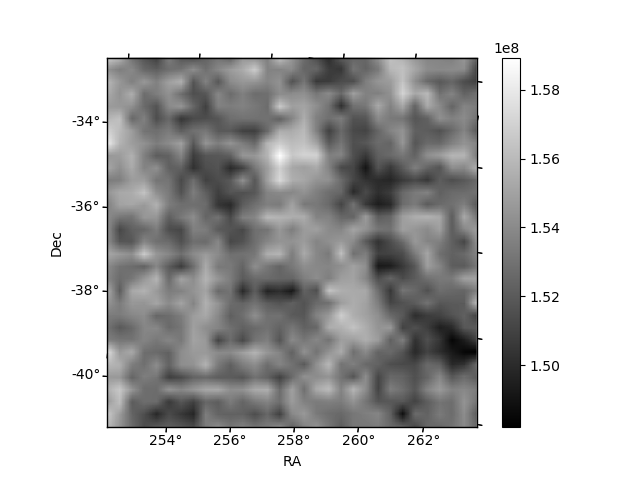
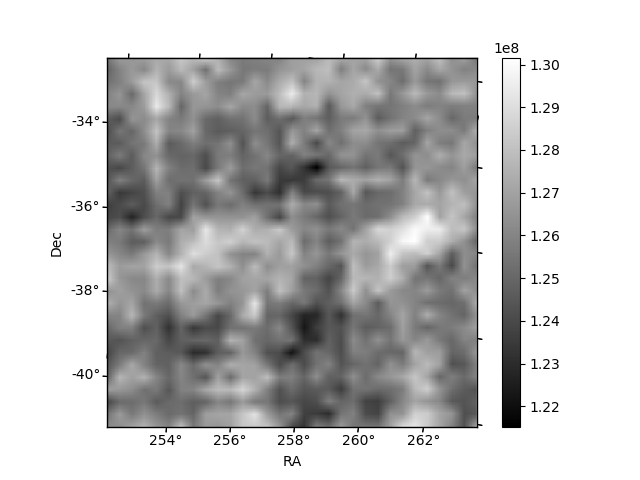
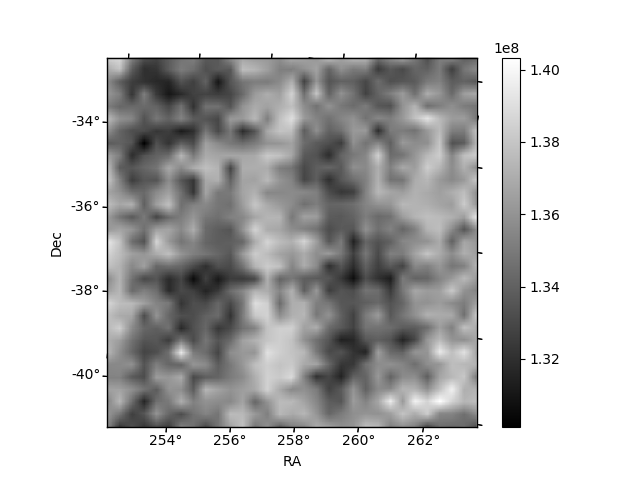
Histogram calculated using DETX and DETY for each event in the final _common_clean file
| Quadrant A | 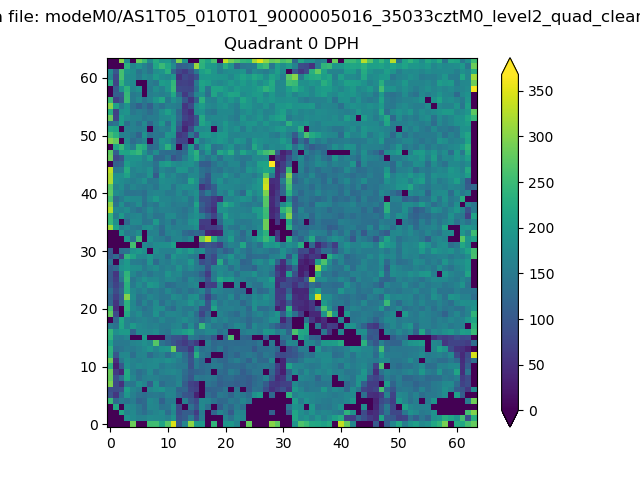 |
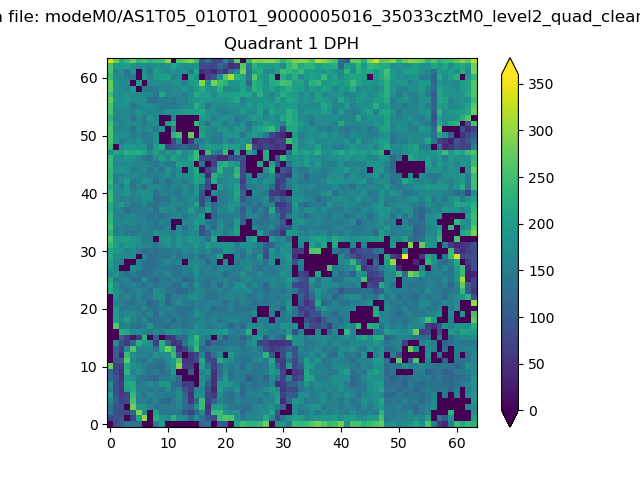 |
Quadrant B |
|---|---|---|---|
| Quadrant D | 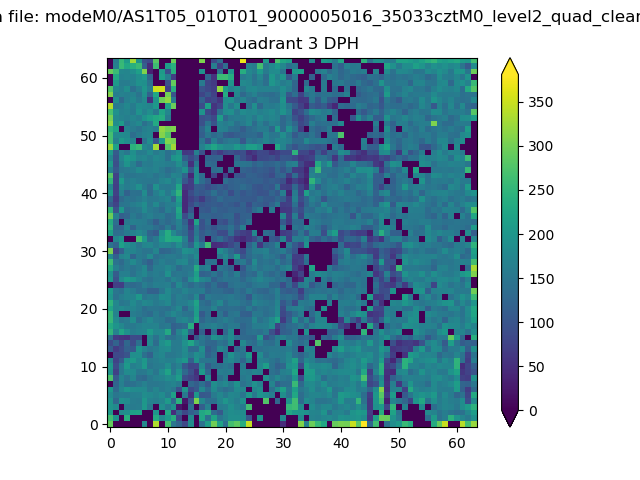 |
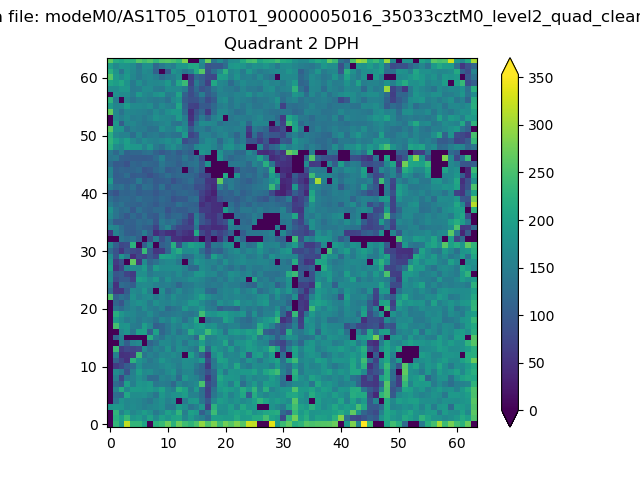 |
Quadrant C |
| Plot type | Count rate plots | Images |
|---|---|---|
| Comparison with Poisson distribution Blue bars denote a histogram of data divided into 1 sec bins. Red curve is a Poisson curve with rate = median count rate of data. |
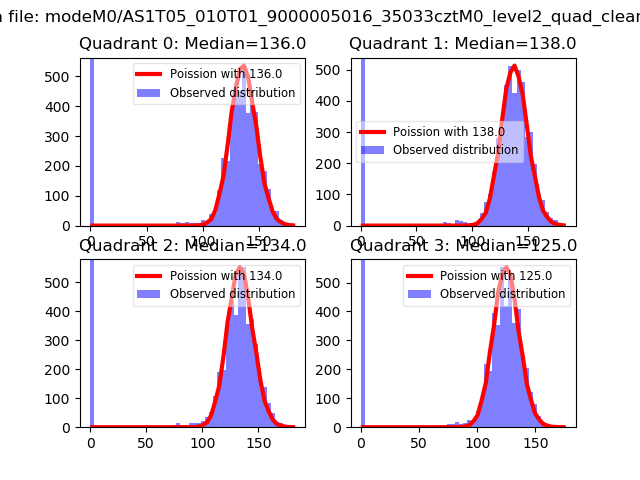 |
 |
| Quadrant-wise count rates Data is divided into 100 sec bins |
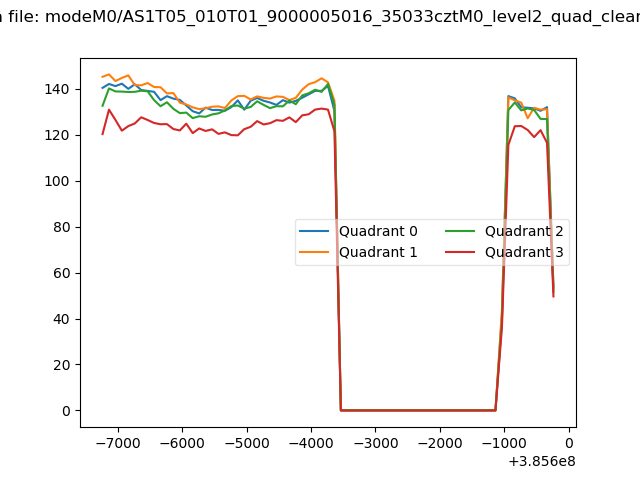 |
|
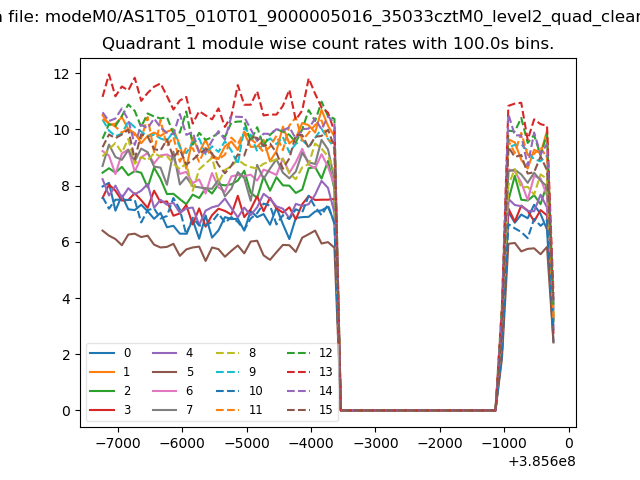
| Module-wise count rates for Quadrant A Data is divided into 100 sec bins |
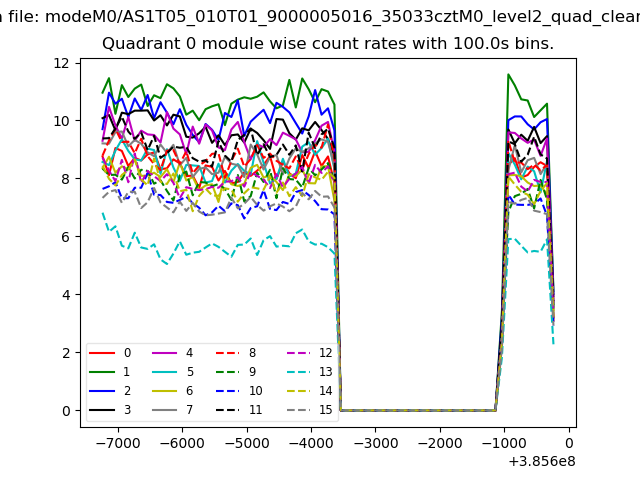 |
 |
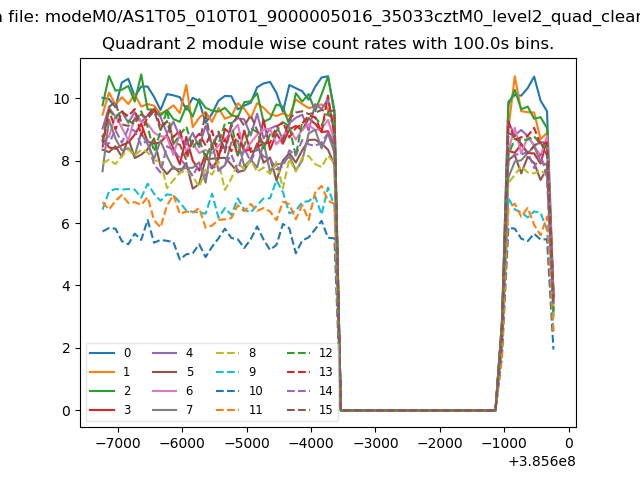
| Module-wise count rates for Quadrant B Data is divided into 100 sec bins |
 |
 |
| Module-wise count rates for Quadrant C Data is divided into 100 sec bins |
 |
 |
| Module-wise count rates for Quadrant D Data is divided into 100 sec bins |
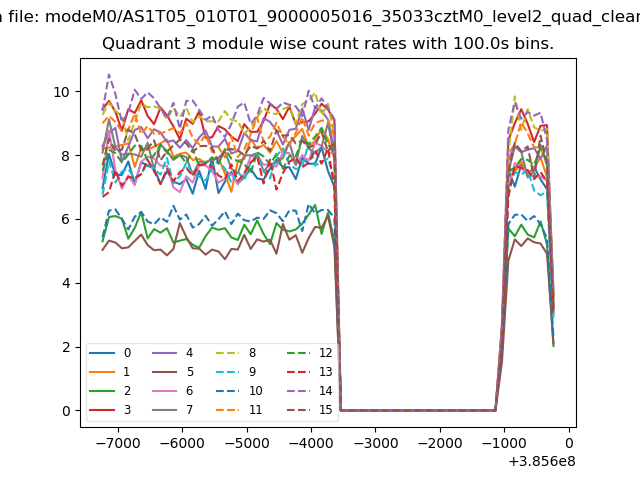 |
 |
| Parameter | Plot |
|---|---|
| CZT HV Monitor | 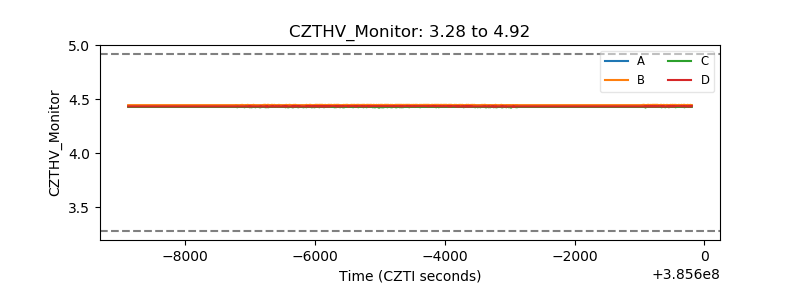 |
| D_VDD | 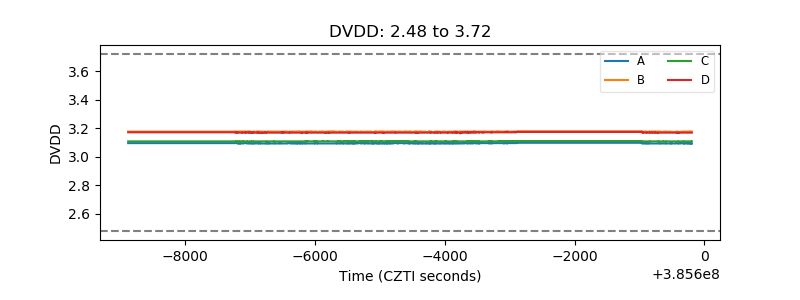 |
| Temperature 1 | 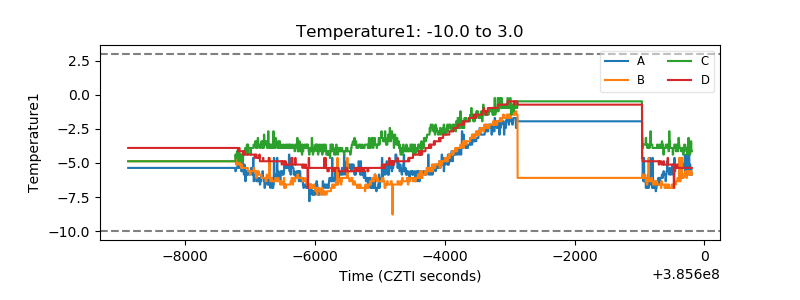 |
| Veto HV Monitor | 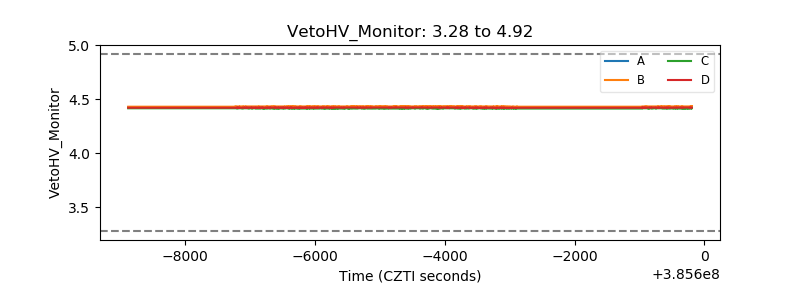 |
| Veto LLD | 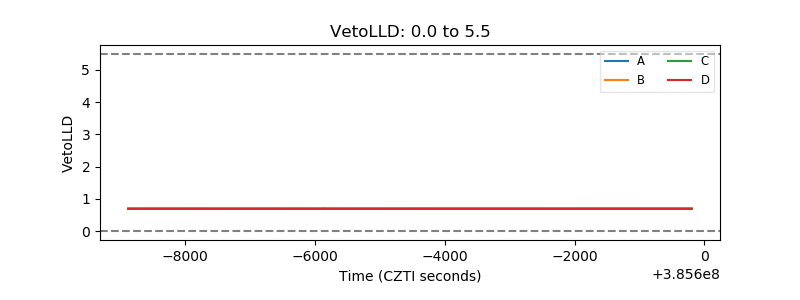 |
| Alpha Counter | 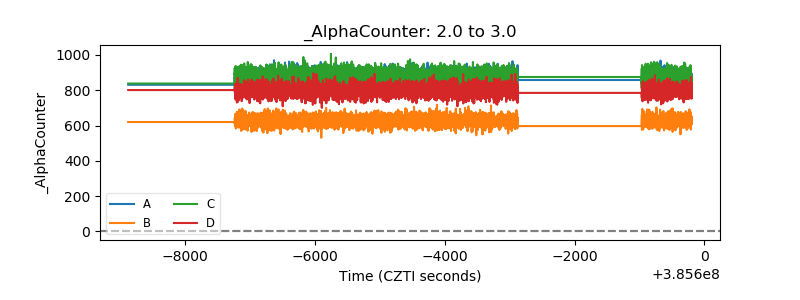 |
| _CPM_Rate | 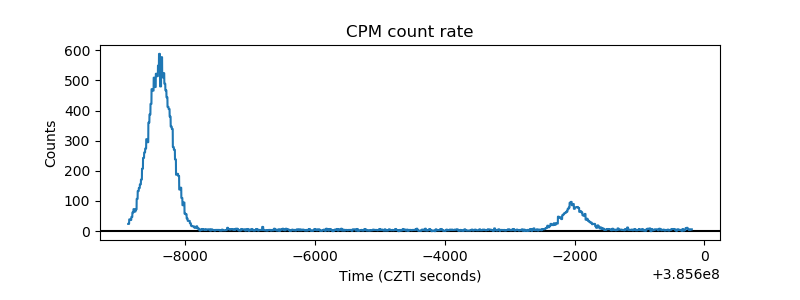 |
| CZT Counter | 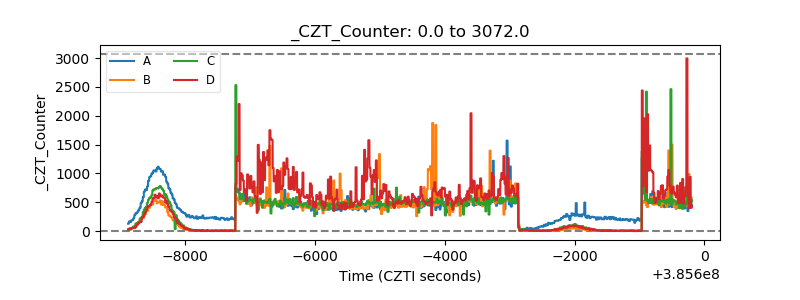 |
| +2.5 Volts monitor | 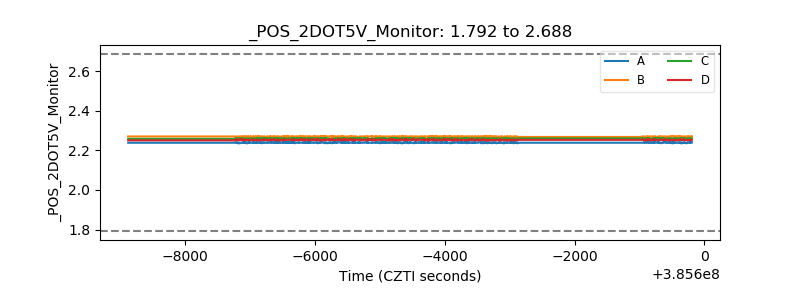 |
| +5 Volts monitor | 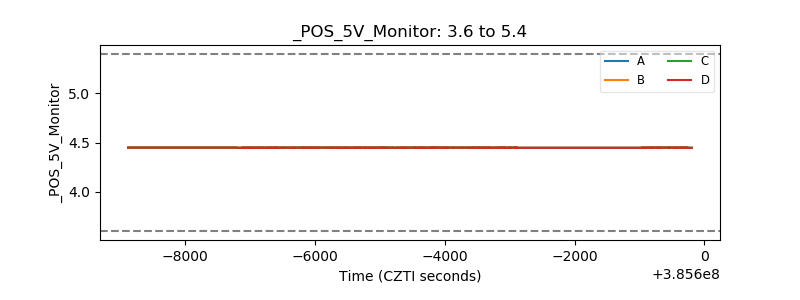 |
| _ROLL_ROT | 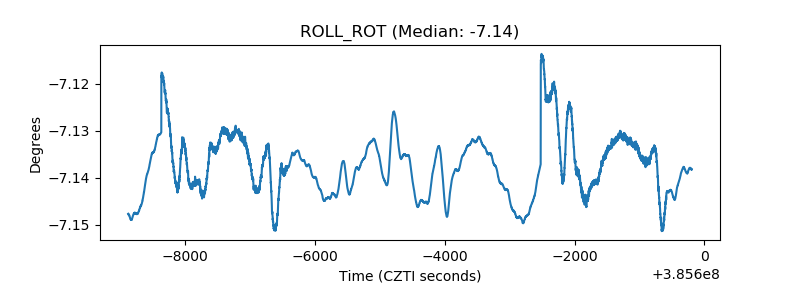 |
| _Roll_DEC | 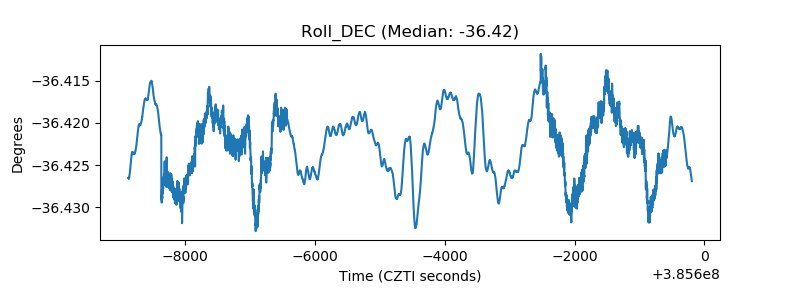 |
| _Roll_RA | 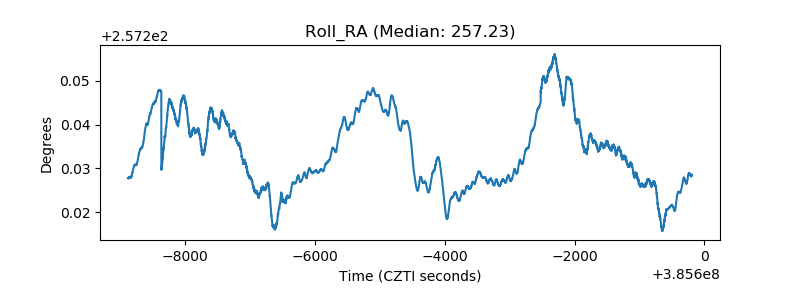 |
| Veto Counter | 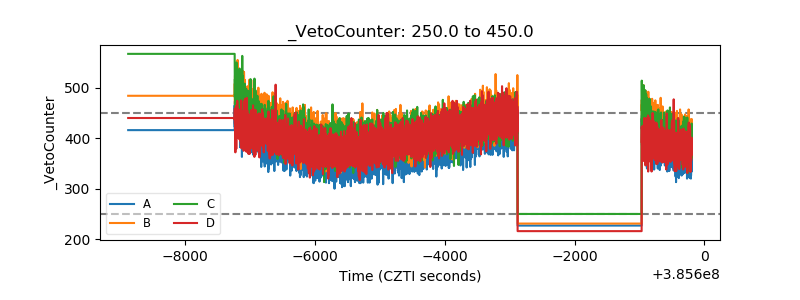 |