| Param | Original file | Final file |
|---|---|---|
| Filename | modeM0/AS1T05_010T01_9000005016_35032cztM0_level2.evt | modeM0/AS1T05_010T01_9000005016_35032cztM0_level2_quad_clean.evt |
| Size (bytes) | 384,658,560 | 94,631,040 |
| Size | 366.8 MB | 90.2 MB |
| Events in quadrant A | 2,436,051 | 643,163 |
| Events in quadrant B | 2,550,329 | 654,112 |
| Events in quadrant C | 2,682,666 | 630,656 |
| Events in quadrant D | 3,642,356 | 589,393 |
| Mode M0 | |||
|---|---|---|---|
| Quadrant | BADHDUFLAG | Total packets | Discarded packets |
| A | 0 | 10279 | 3 |
| B | 0 | 10524 | 2 |
| C | 0 | 10669 | 2 |
| D | 0 | 14306 | 2 |
| Mode M9 | |||
|---|---|---|---|
| Quadrant | BADHDUFLAG | Total packets | Discarded packets |
| A | 0 | 28 | 0 |
| B | 0 | 28 | 0 |
| C | 0 | 28 | 0 |
| D | 0 | 29 | 0 |
| Mode SS | |||
|---|---|---|---|
| Quadrant | BADHDUFLAG | Total packets | Discarded packets |
| A | 0 | 102 | 0 |
| B | 0 | 102 | 0 |
| C | 0 | 102 | 0 |
| D | 0 | 102 | 0 |
| Quadrant | Total seconds | Saturated seconds | Saturation percentage |
|---|---|---|---|
| A | 4968 | 8 | 0.161031% |
| B | 4968 | 12 | 0.241546% |
| C | 4968 | 38 | 0.764895% |
| D | 4968 | 125 | 2.516103% |
Noise dominated data is calculated using 1-second bins in cleaned event files. If a bin has >2000 counts, and if more than 50% of those come from <1% of pixels, then it is considered to be noise-dominated and hence unusable.
| Quadrant | # 1 sec bins | Bins with >0 counts | Bins with >2000 counts | High rate bins dominated by noise | Noise dominated (total time) | Noise dominated (detector-on time) | Marked lightcurve |
|---|---|---|---|---|---|---|---|
| A | 7060 | 4969 | 0 | 0 | 0.00% | 0.00% | 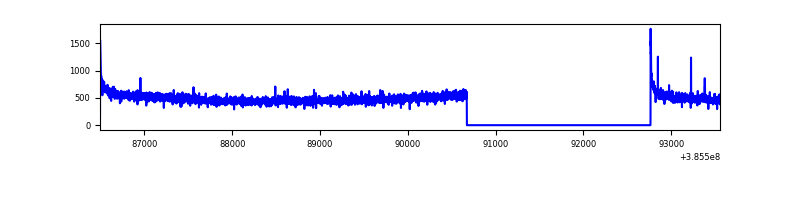 |
| B | 7060 | 4969 | 8 | 8 | 0.11% | 0.16% | 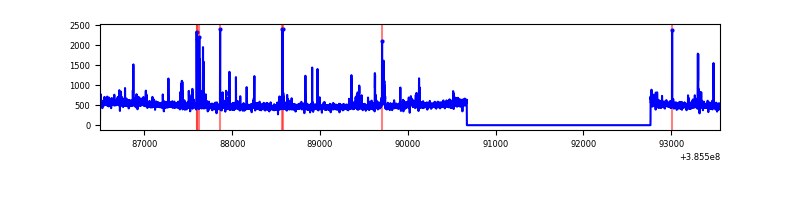 |
| C | 7060 | 4969 | 30 | 30 | 0.42% | 0.60% | 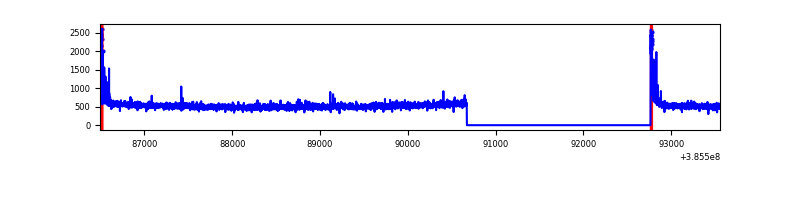 |
| D | 7060 | 4969 | 115 | 115 | 1.63% | 2.31% | 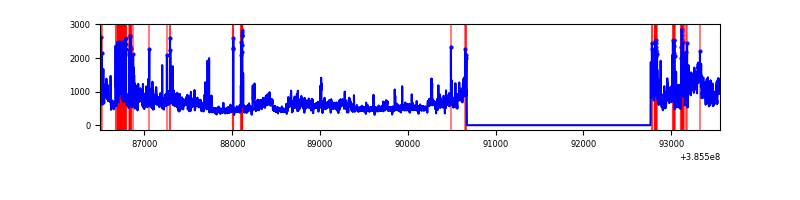 |
Top three noisy pixels from each quadrant. If the there are fewer than three noisy pixels in the level2.evt file, extra rows are filled as -1
| Pixel properties | Quadrant properties | ||||||
|---|---|---|---|---|---|---|---|
| Quadrant | DetID | PixID | Counts | Sigma | Mean | Median | Sigma |
| A | 10 | 83 | 76387 | 622.48 | 607 | 597 | 121.8 |
| A | 13 | 6 | 11183 | 86.95 | 607 | 597 | 121.8 |
| A | 13 | 254 | 7969 | 60.55 | 607 | 597 | 121.8 |
| B | 5 | 172 | 88923 | 759.1 | 609 | 594 | 116.4 |
| B | 5 | 255 | 32026 | 270.13 | 609 | 594 | 116.4 |
| B | 4 | 232 | 18664 | 155.29 | 609 | 594 | 116.4 |
| C | 15 | 214 | 207177 | 1499.69 | 591 | 598 | 137.7 |
| C | 0 | 10 | 125936 | 909.91 | 591 | 598 | 137.7 |
| C | 14 | 67 | 42814 | 306.47 | 591 | 598 | 137.7 |
| D | 8 | 195 | 822760 | 5771.75 | 580 | 565 | 142.5 |
| D | 10 | 118 | 194068 | 1358.37 | 580 | 565 | 142.5 |
| D | 2 | 31 | 126222 | 882.1 | 580 | 565 | 142.5 |
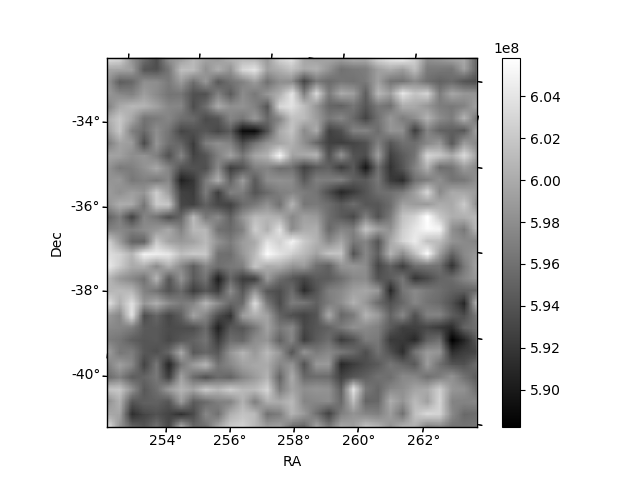
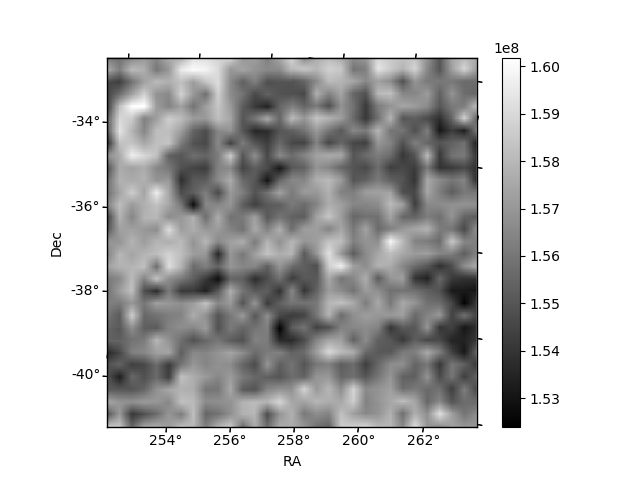
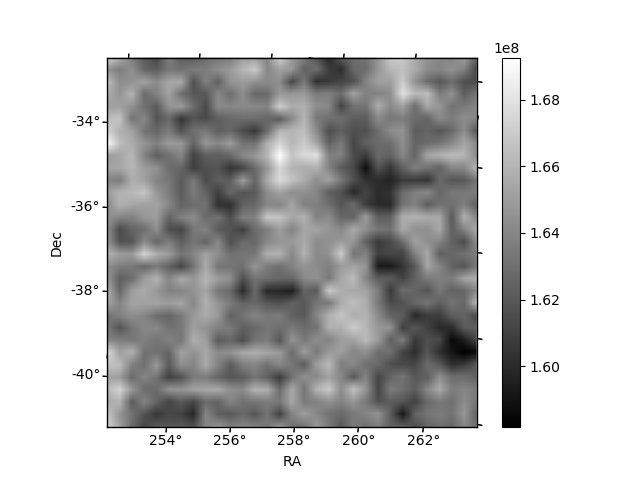
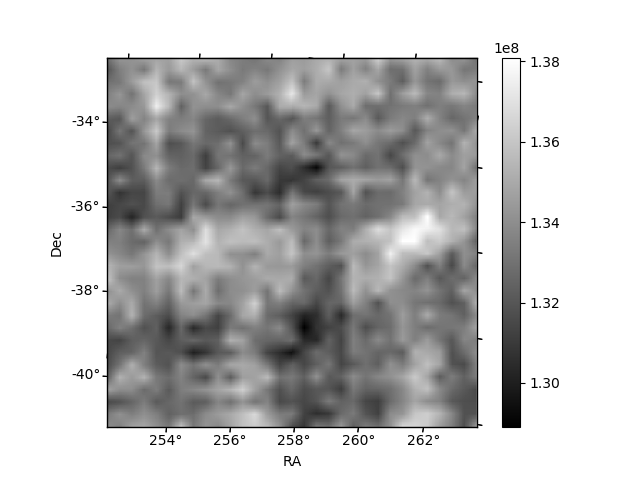
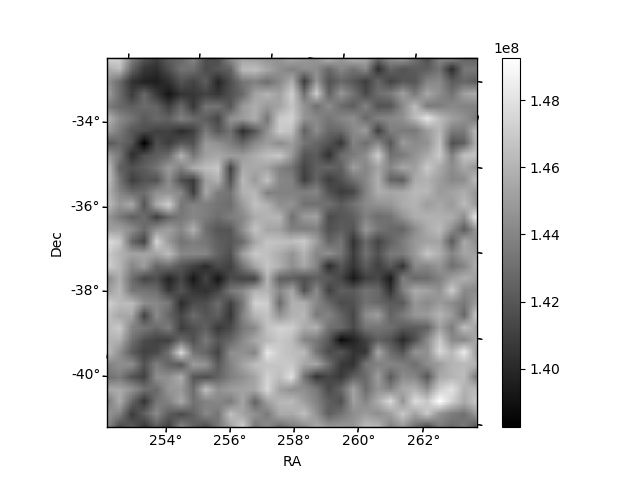
Histogram calculated using DETX and DETY for each event in the final _common_clean file
| Quadrant A | 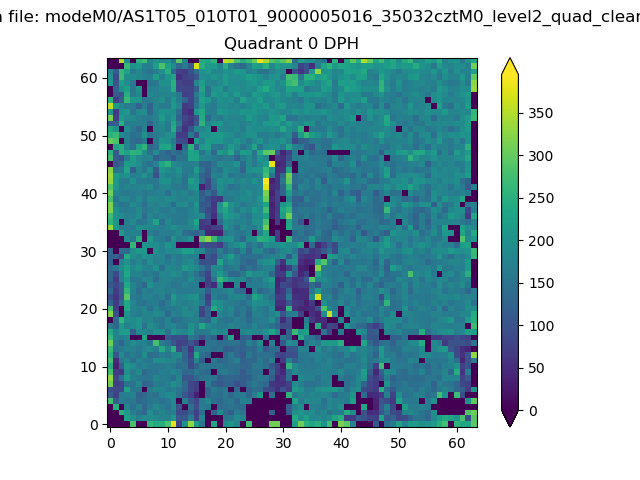 |
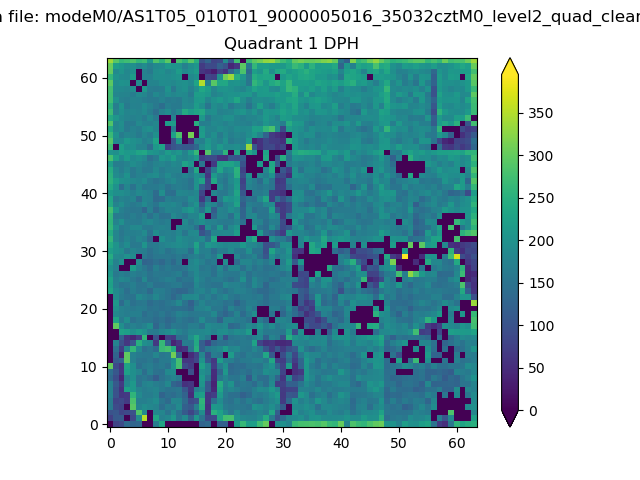 |
Quadrant B |
|---|---|---|---|
| Quadrant D | 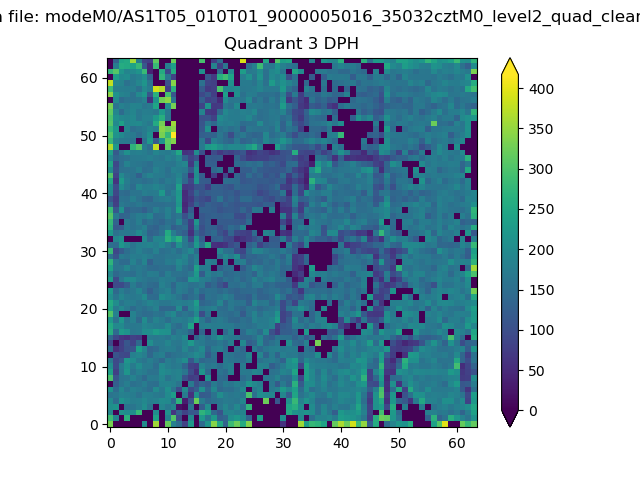 |
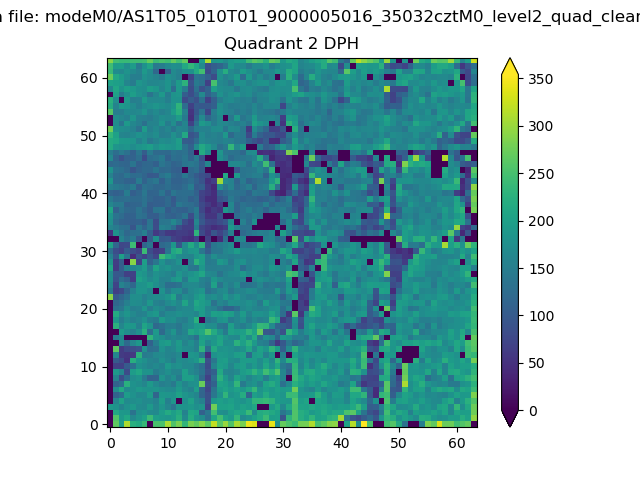 |
Quadrant C |
| Plot type | Count rate plots | Images |
|---|---|---|
| Comparison with Poisson distribution Blue bars denote a histogram of data divided into 1 sec bins. Red curve is a Poisson curve with rate = median count rate of data. |
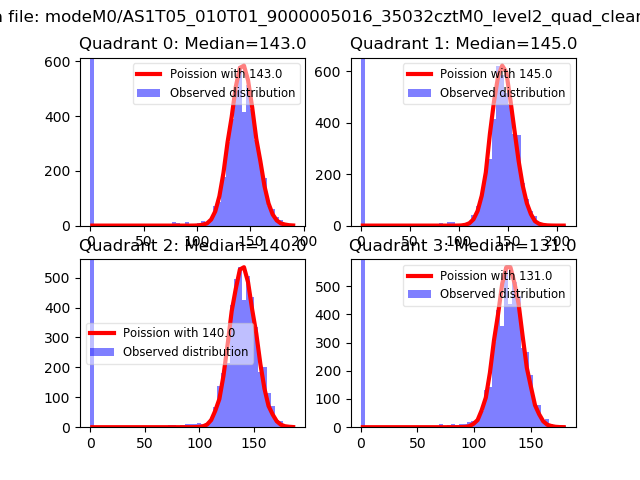 |
 |
| Quadrant-wise count rates Data is divided into 100 sec bins |
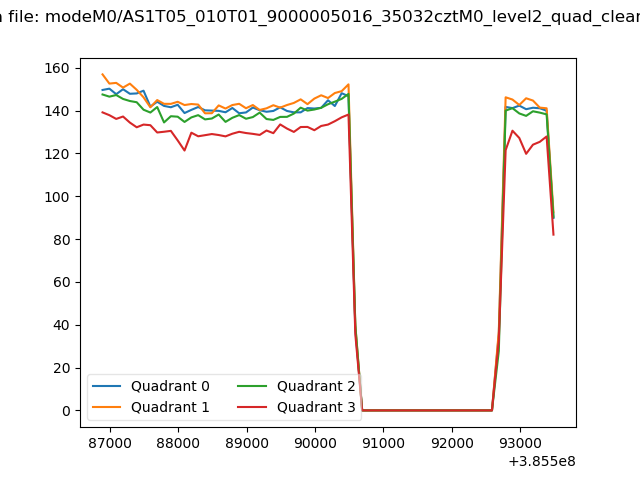 |
|
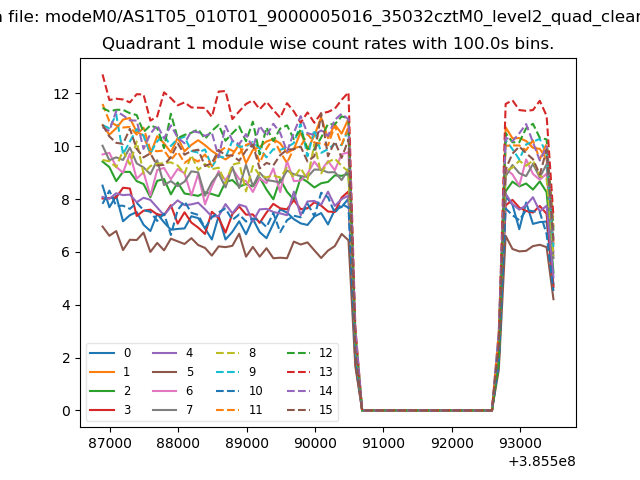
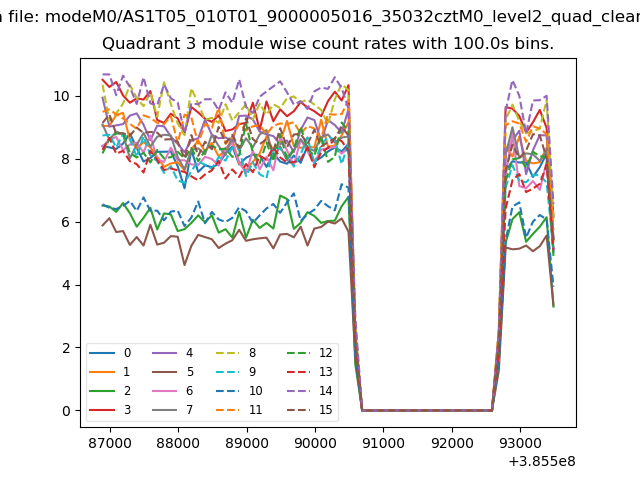
| Module-wise count rates for Quadrant A Data is divided into 100 sec bins |
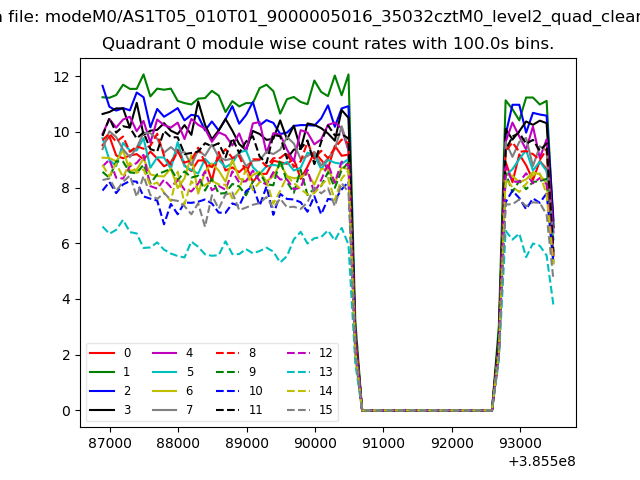 |
 |
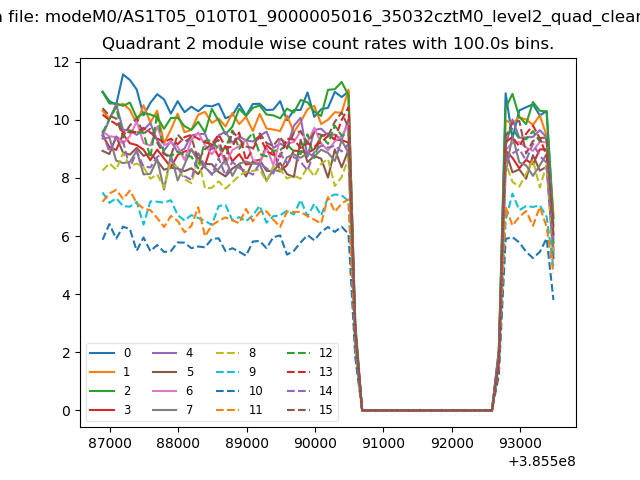
| Module-wise count rates for Quadrant B Data is divided into 100 sec bins |
 |
 |
| Module-wise count rates for Quadrant C Data is divided into 100 sec bins |
 |
 |
| Module-wise count rates for Quadrant D Data is divided into 100 sec bins |
 |
 |
| Parameter | Plot |
|---|---|
| CZT HV Monitor | 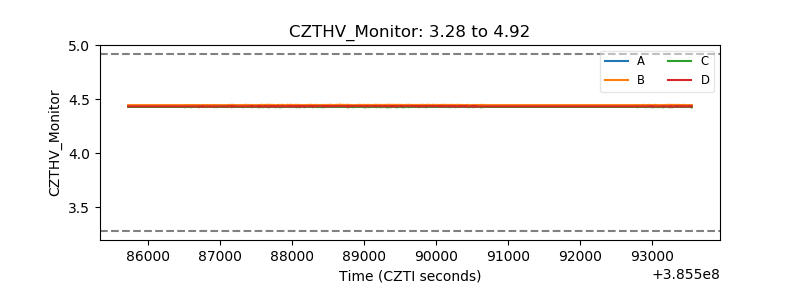 |
| D_VDD | 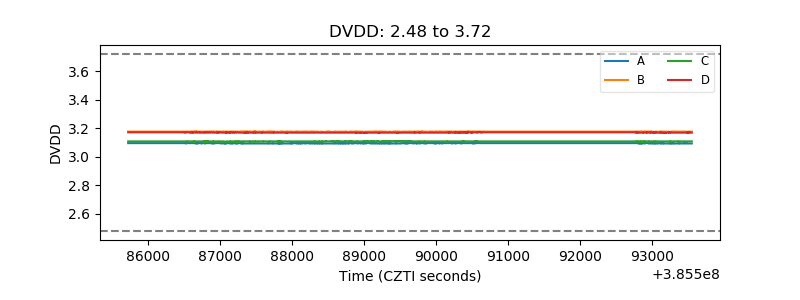 |
| Temperature 1 | 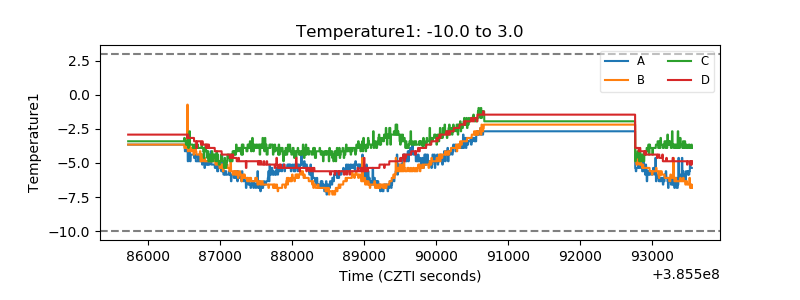 |
| Veto HV Monitor | 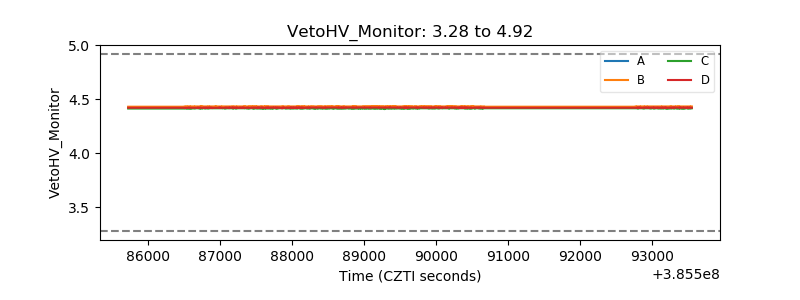 |
| Veto LLD | 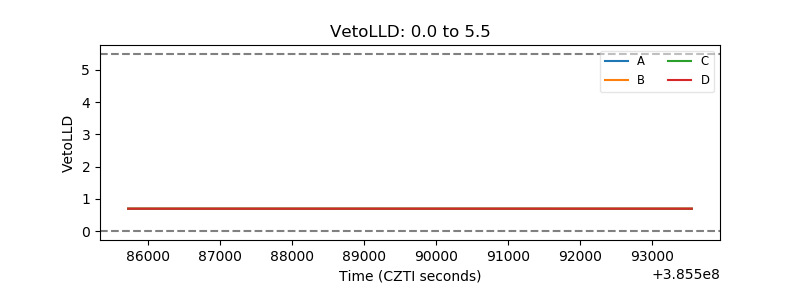 |
| Alpha Counter |  |
| _CPM_Rate | 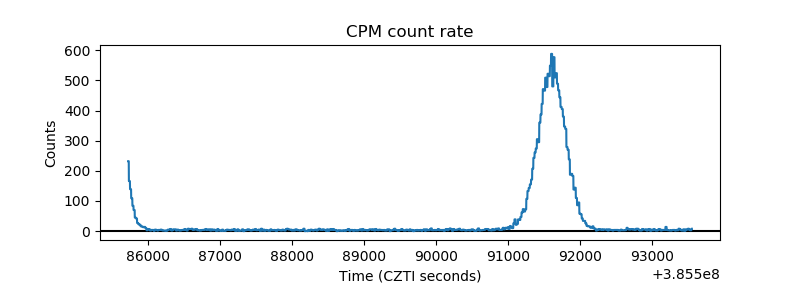 |
| CZT Counter | 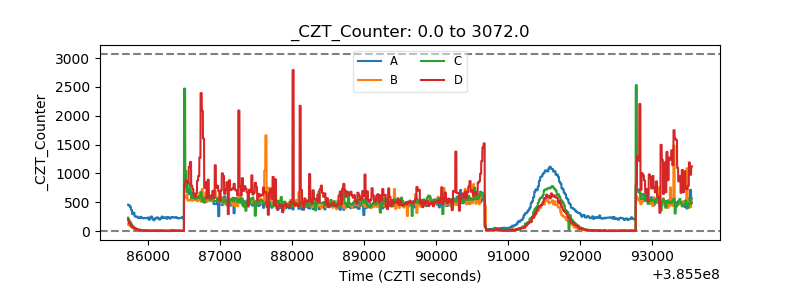 |
| +2.5 Volts monitor | 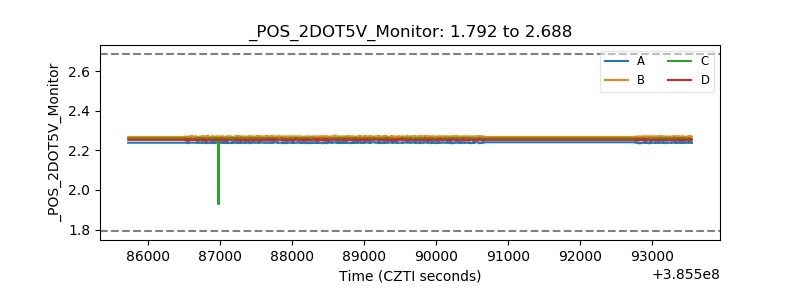 |
| +5 Volts monitor | 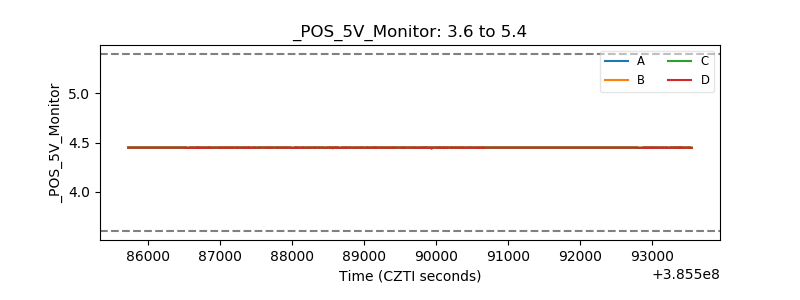 |
| _ROLL_ROT | 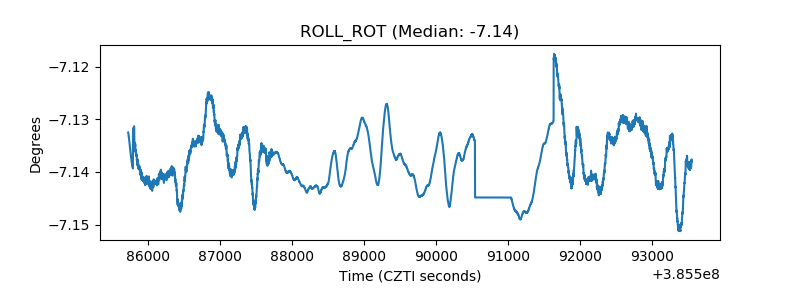 |
| _Roll_DEC | 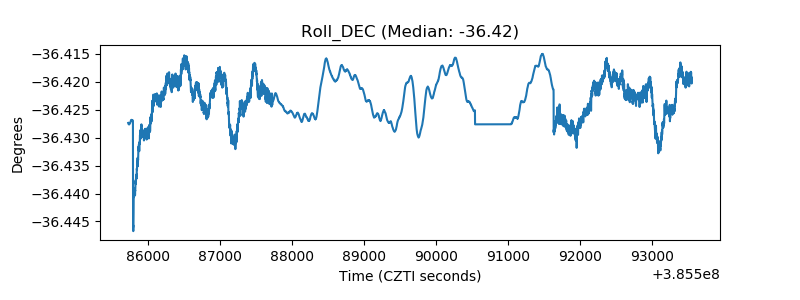 |
| _Roll_RA | 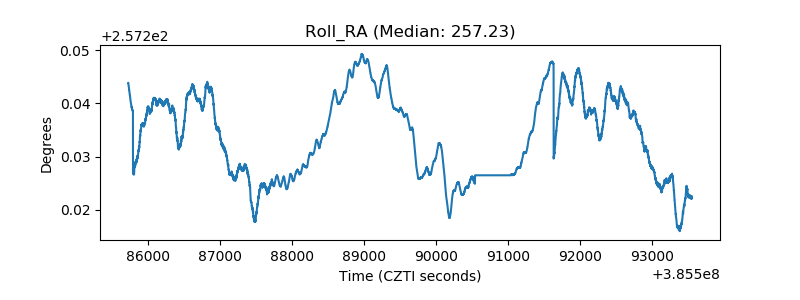 |
| Veto Counter | 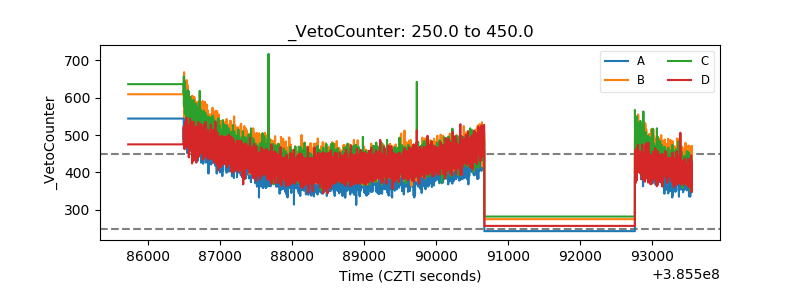 |