| Param | Original file | Final file |
|---|---|---|
| Filename | modeM0/AS1T05_010T01_9000005016_35016cztM0_level2.evt | modeM0/AS1T05_010T01_9000005016_35016cztM0_level2_quad_clean.evt |
| Size (bytes) | 432,829,440 | 78,082,560 |
| Size | 412.8 MB | 74.5 MB |
| Events in quadrant A | 2,593,415 | 520,598 |
| Events in quadrant B | 3,195,002 | 523,401 |
| Events in quadrant C | 2,885,555 | 503,979 |
| Events in quadrant D | 4,101,710 | 472,506 |
| Mode M0 | |||
|---|---|---|---|
| Quadrant | BADHDUFLAG | Total packets | Discarded packets |
| A | 0 | 10636 | 3 |
| B | 0 | 12587 | 2 |
| C | 0 | 11262 | 2 |
| D | 0 | 15539 | 2 |
| Mode M9 | |||
|---|---|---|---|
| Quadrant | BADHDUFLAG | Total packets | Discarded packets |
| A | 0 | 37 | 1 |
| B | 0 | 37 | 1 |
| C | 0 | 37 | 1 |
| D | 0 | 38 | 1 |
| Mode SS | |||
|---|---|---|---|
| Quadrant | BADHDUFLAG | Total packets | Discarded packets |
| A | 0 | 100 | 0 |
| B | 0 | 100 | 0 |
| C | 0 | 100 | 0 |
| D | 0 | 100 | 0 |
| Quadrant | Total seconds | Saturated seconds | Saturation percentage |
|---|---|---|---|
| A | 4903 | 10 | 0.203957% |
| B | 4903 | 65 | 1.325719% |
| C | 4903 | 110 | 2.243524% |
| D | 4903 | 145 | 2.957373% |
Noise dominated data is calculated using 1-second bins in cleaned event files. If a bin has >2000 counts, and if more than 50% of those come from <1% of pixels, then it is considered to be noise-dominated and hence unusable.
| Quadrant | # 1 sec bins | Bins with >0 counts | Bins with >2000 counts | High rate bins dominated by noise | Noise dominated (total time) | Noise dominated (detector-on time) | Marked lightcurve |
|---|---|---|---|---|---|---|---|
| A | 6997 | 4904 | 3 | 3 | 0.04% | 0.06% | 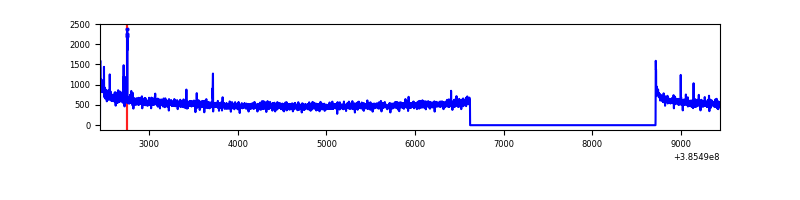 |
| B | 6997 | 4904 | 24 | 24 | 0.34% | 0.49% | 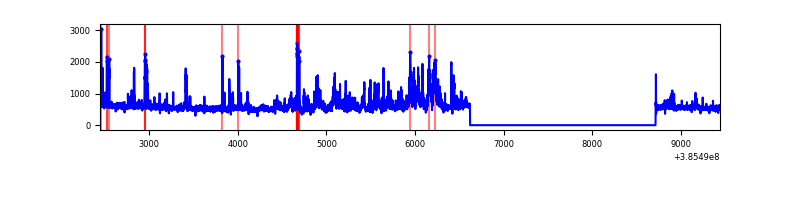 |
| C | 6997 | 4904 | 98 | 98 | 1.40% | 2.00% | 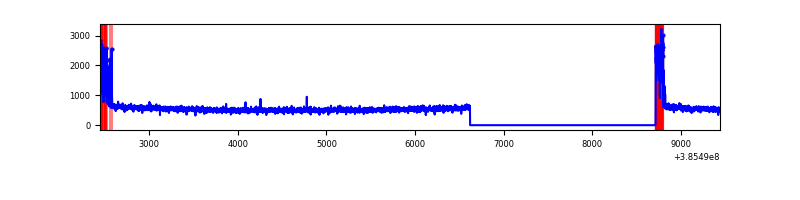 |
| D | 6997 | 4904 | 108 | 108 | 1.54% | 2.20% | 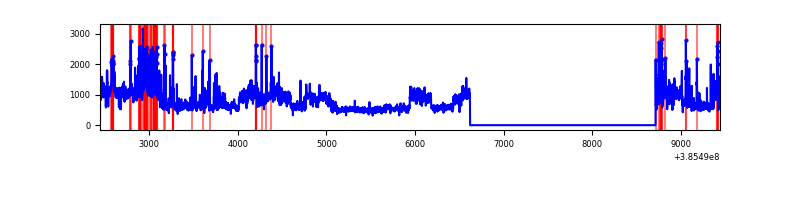 |
Top three noisy pixels from each quadrant. If the there are fewer than three noisy pixels in the level2.evt file, extra rows are filled as -1
| Pixel properties | Quadrant properties | ||||||
|---|---|---|---|---|---|---|---|
| Quadrant | DetID | PixID | Counts | Sigma | Mean | Median | Sigma |
| A | 10 | 83 | 76572 | 596.97 | 641 | 631 | 127.2 |
| A | 15 | 223 | 34003 | 262.34 | 641 | 631 | 127.2 |
| A | 13 | 254 | 8486 | 61.75 | 641 | 631 | 127.2 |
| B | 5 | 31 | 374249 | 3125.54 | 638 | 625 | 119.5 |
| B | 5 | 172 | 115306 | 959.36 | 638 | 625 | 119.5 |
| B | 5 | 15 | 81348 | 675.29 | 638 | 625 | 119.5 |
| C | 0 | 10 | 294062 | 2100.18 | 609 | 616 | 139.7 |
| C | 15 | 214 | 205304 | 1464.95 | 609 | 616 | 139.7 |
| C | 12 | 250 | 5199 | 32.8 | 609 | 616 | 139.7 |
| D | 8 | 195 | 1274861 | 8705.78 | 603 | 588 | 146.4 |
| D | 10 | 118 | 147414 | 1003.11 | 603 | 588 | 146.4 |
| D | 12 | 233 | 126889 | 862.88 | 603 | 588 | 146.4 |
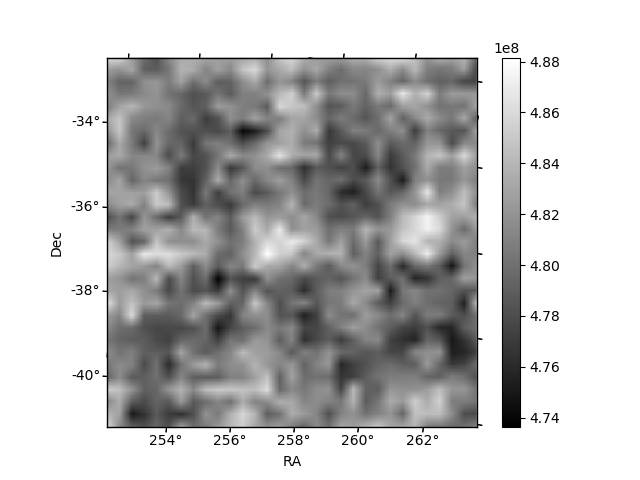
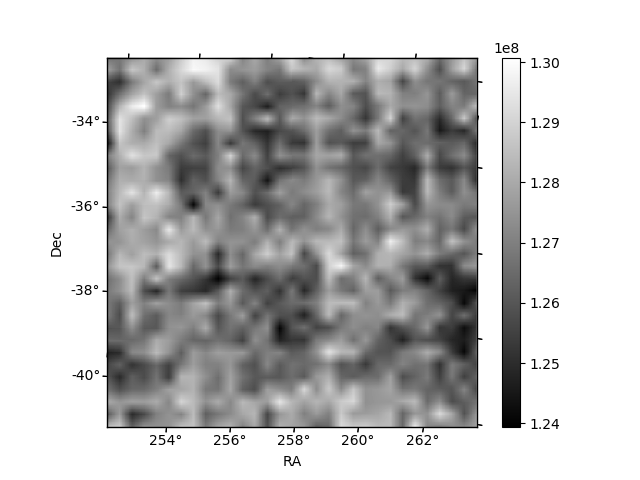
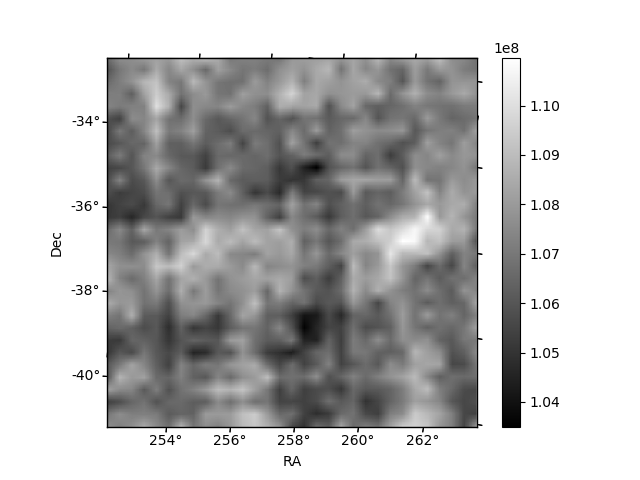
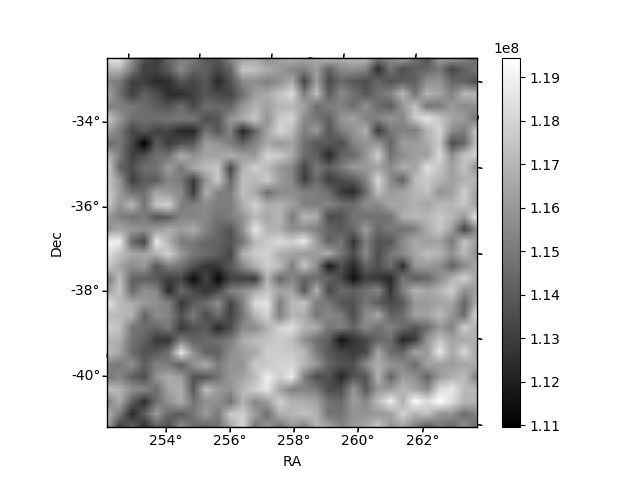
Histogram calculated using DETX and DETY for each event in the final _common_clean file
| Quadrant A | 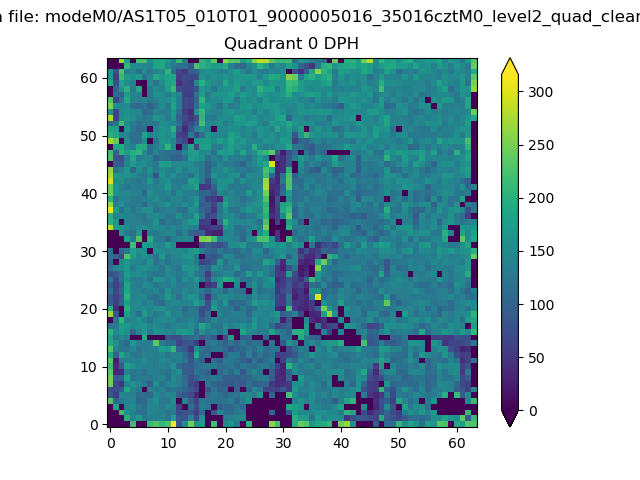 |
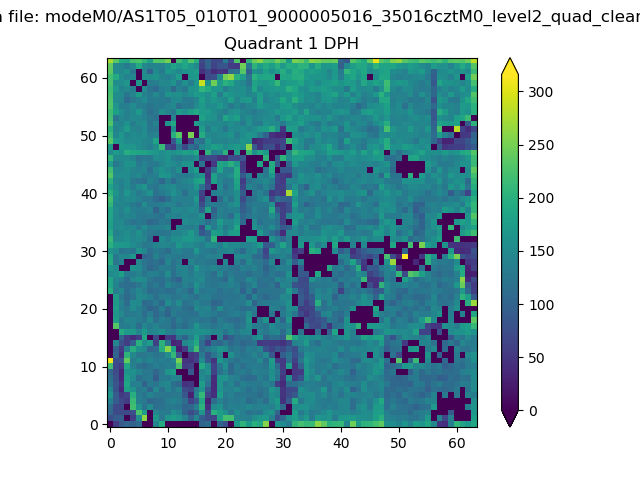 |
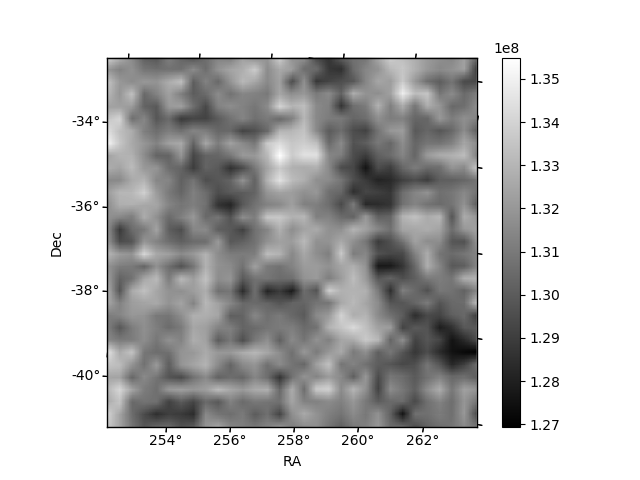
Quadrant B |
|---|---|---|---|
| Quadrant D | 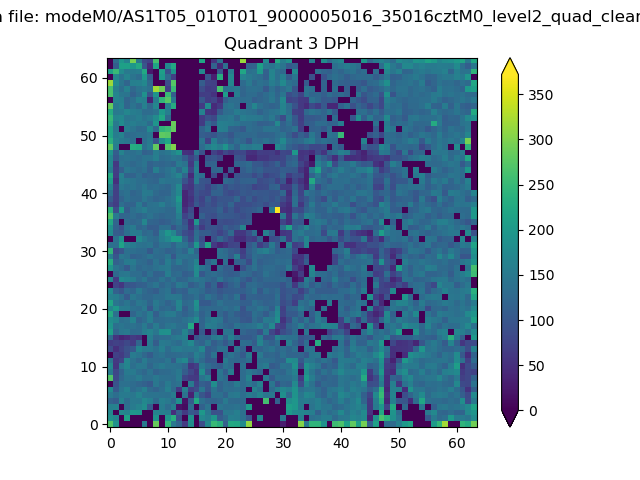 |
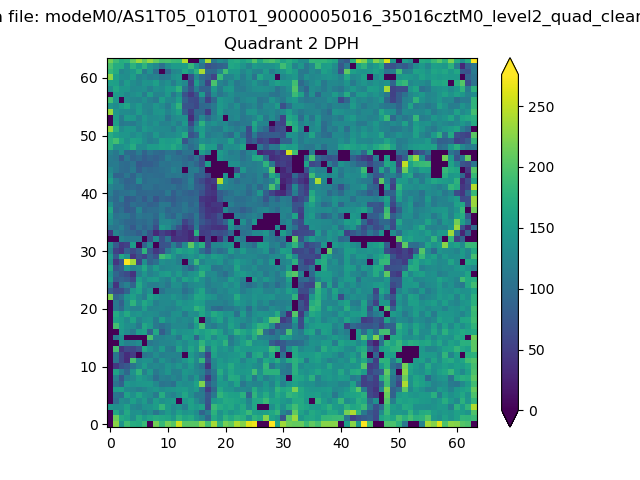 |
Quadrant C |
| Plot type | Count rate plots | Images |
|---|---|---|
| Comparison with Poisson distribution Blue bars denote a histogram of data divided into 1 sec bins. Red curve is a Poisson curve with rate = median count rate of data. |
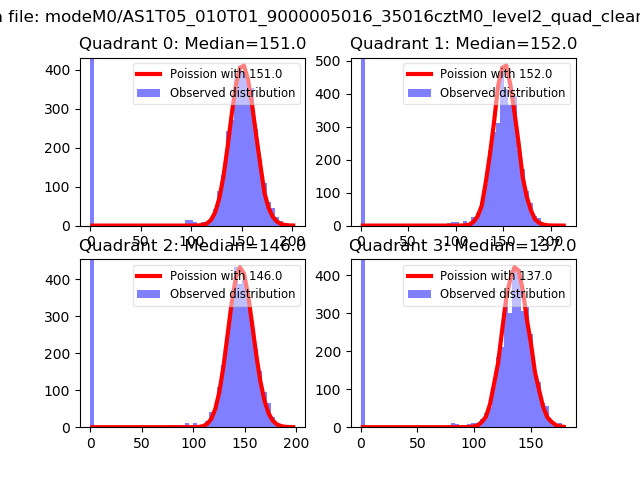 |
 |
| Quadrant-wise count rates Data is divided into 100 sec bins |
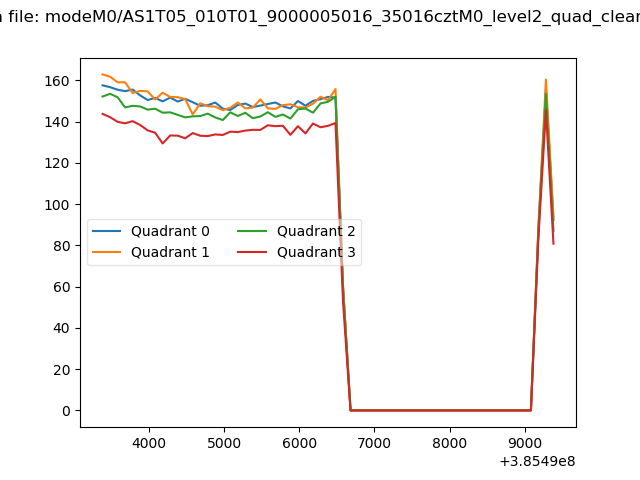 |
|
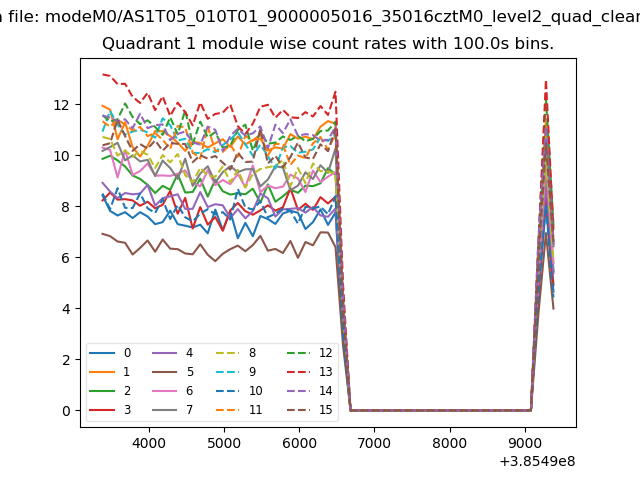
| Module-wise count rates for Quadrant A Data is divided into 100 sec bins |
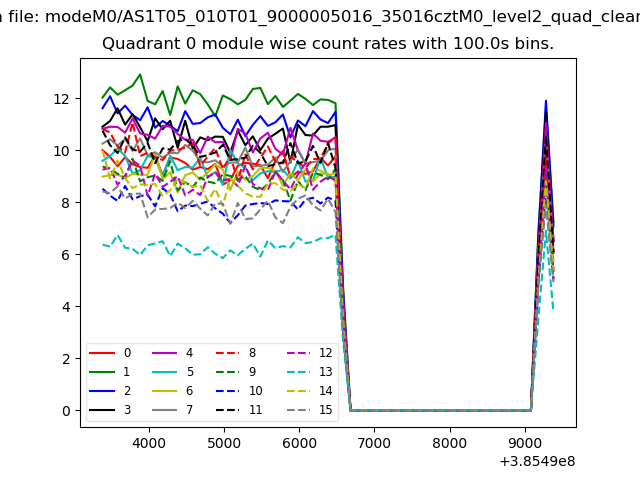 |
 |
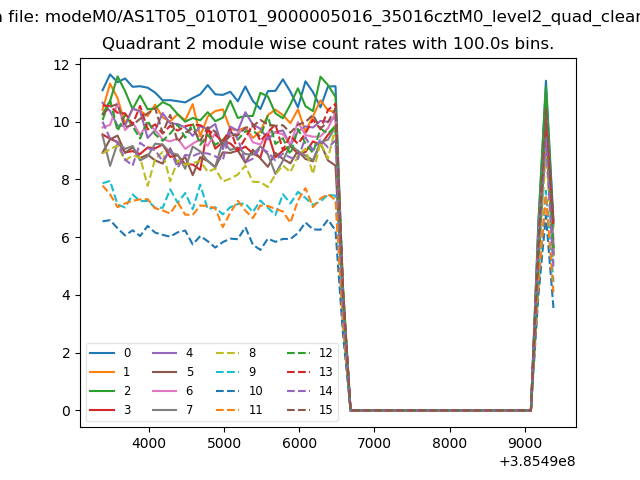
| Module-wise count rates for Quadrant B Data is divided into 100 sec bins |
 |
 |
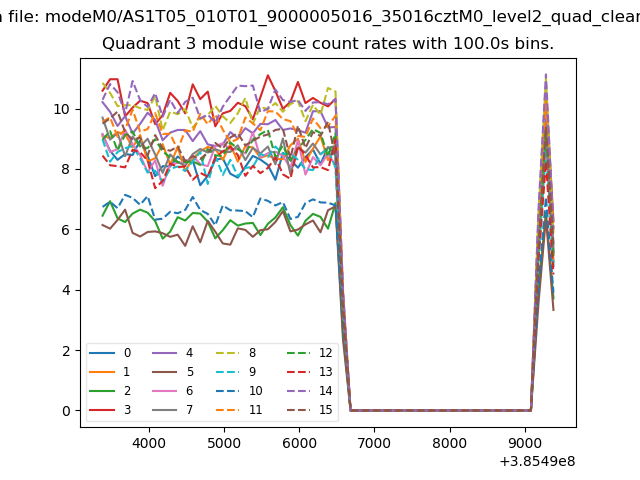
| Module-wise count rates for Quadrant C Data is divided into 100 sec bins |
 |
 |
| Module-wise count rates for Quadrant D Data is divided into 100 sec bins |
 |
 |
| Parameter | Plot |
|---|---|
| CZT HV Monitor | 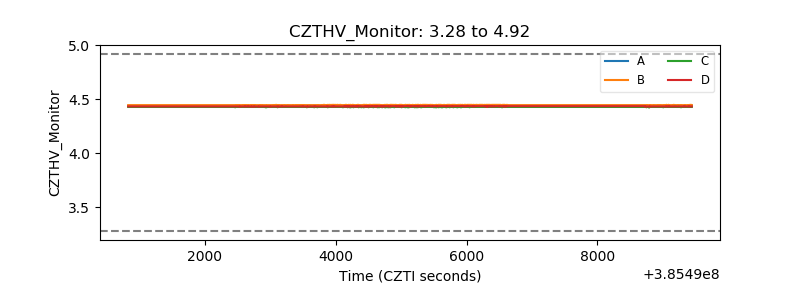 |
| D_VDD | 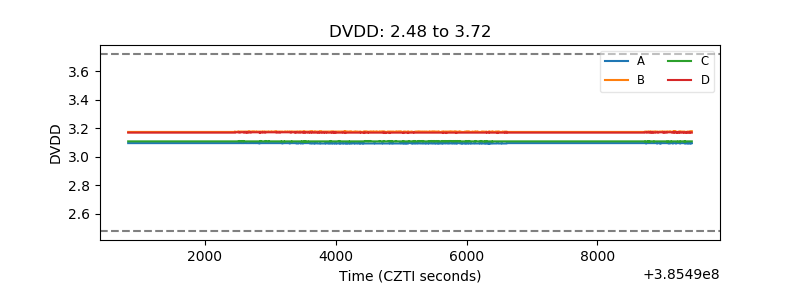 |
| Temperature 1 | 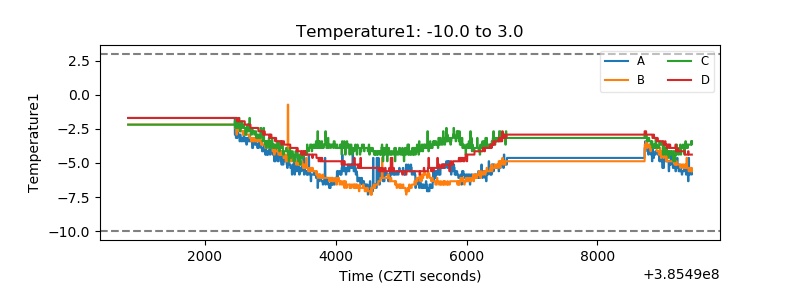 |
| Veto HV Monitor | 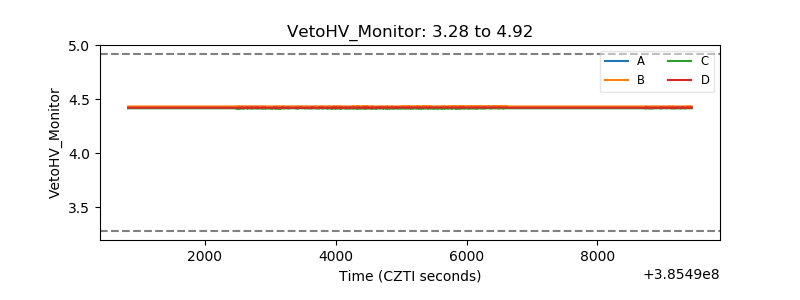 |
| Veto LLD | 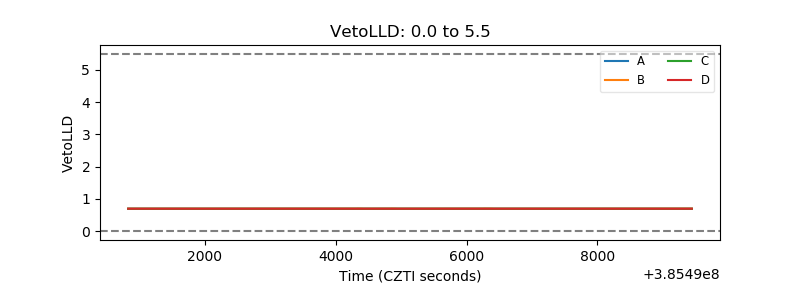 |
| Alpha Counter | 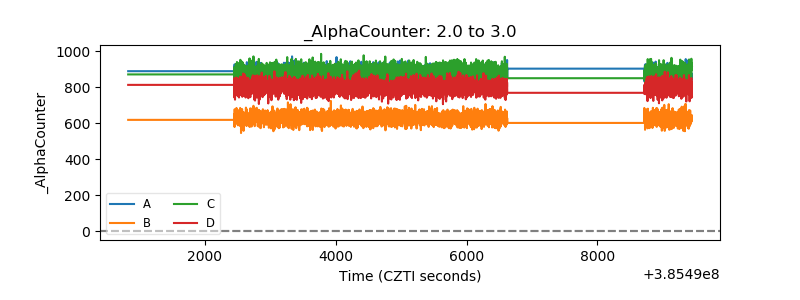 |
| _CPM_Rate | 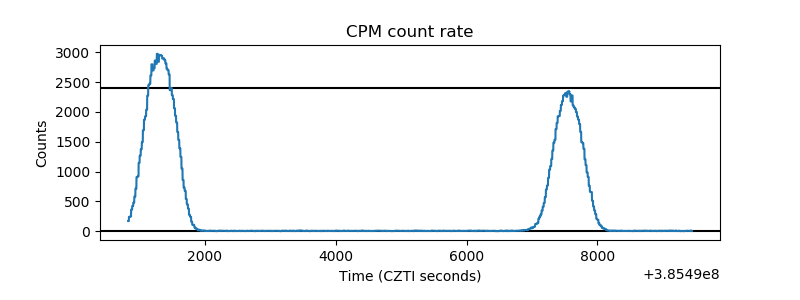 |
| CZT Counter | 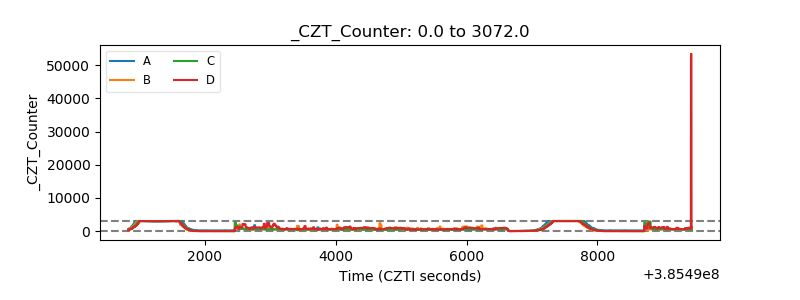 |
| +2.5 Volts monitor | 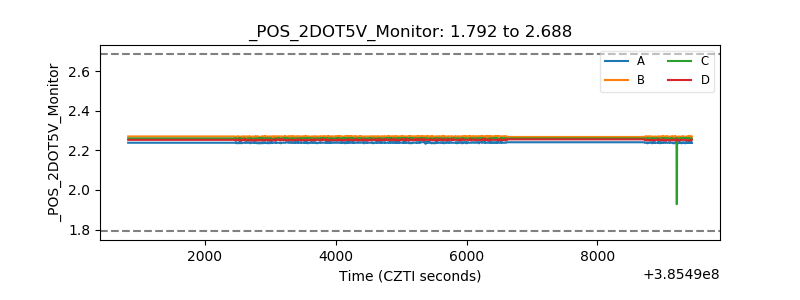 |
| +5 Volts monitor | 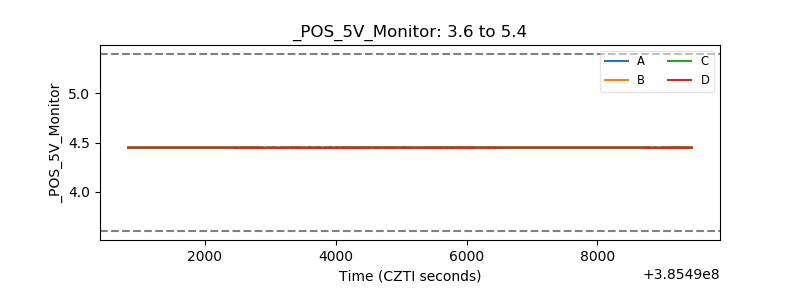 |
| _ROLL_ROT | 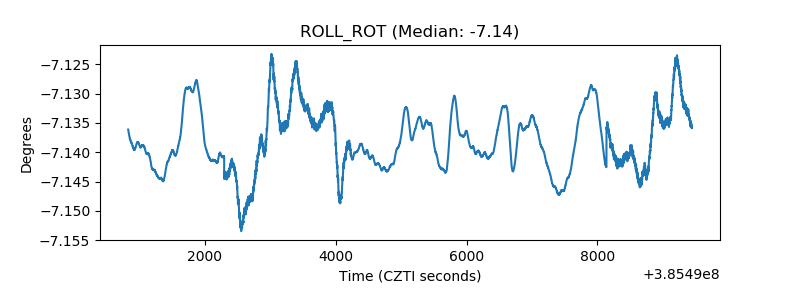 |
| _Roll_DEC | 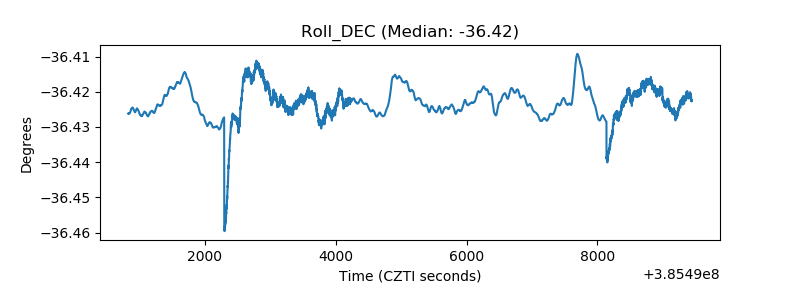 |
| _Roll_RA | 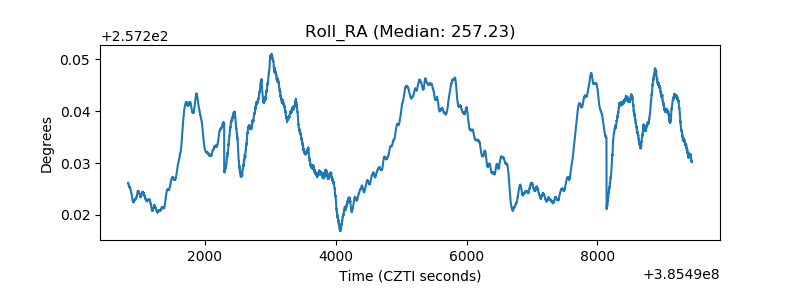 |
| Veto Counter | 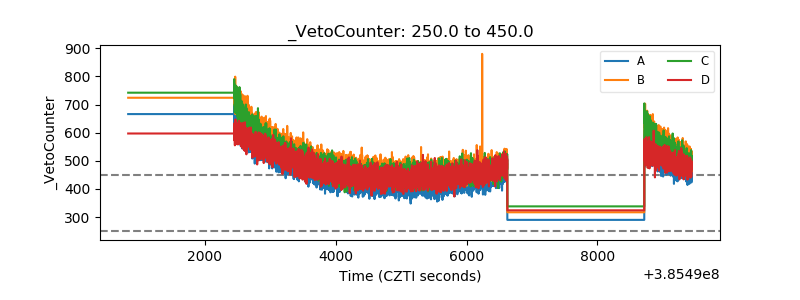 |