| Param | Original file | Final file |
|---|---|---|
| Filename | modeM0/AS1T05_010T01_9000005016_35013cztM0_level2.evt | modeM0/AS1T05_010T01_9000005016_35013cztM0_level2_quad_clean.evt |
| Size (bytes) | 481,291,200 | 53,902,080 |
| Size | 459.0 MB | 51.4 MB |
| Events in quadrant A | 2,931,998 | 321,305 |
| Events in quadrant B | 3,290,562 | 322,638 |
| Events in quadrant C | 3,051,036 | 313,925 |
| Events in quadrant D | 4,927,920 | 287,412 |
| Mode M0 | |||
|---|---|---|---|
| Quadrant | BADHDUFLAG | Total packets | Discarded packets |
| A | 0 | 12175 | 3 |
| B | 0 | 13155 | 2 |
| C | 0 | 12241 | 2 |
| D | 0 | 18446 | 2 |
| Mode M9 | |||
|---|---|---|---|
| Quadrant | BADHDUFLAG | Total packets | Discarded packets |
| A | 0 | 26 | 0 |
| B | 0 | 26 | 0 |
| C | 0 | 26 | 0 |
| D | 0 | 27 | 0 |
| Mode SS | |||
|---|---|---|---|
| Quadrant | BADHDUFLAG | Total packets | Discarded packets |
| A | 0 | 112 | 0 |
| B | 0 | 112 | 0 |
| C | 0 | 112 | 0 |
| D | 0 | 112 | 0 |
| Quadrant | Total seconds | Saturated seconds | Saturation percentage |
|---|---|---|---|
| A | 5524 | 37 | 0.669804% |
| B | 5524 | 172 | 3.113686% |
| C | 5524 | 74 | 1.339609% |
| D | 5524 | 295 | 5.340333% |
Noise dominated data is calculated using 1-second bins in cleaned event files. If a bin has >2000 counts, and if more than 50% of those come from <1% of pixels, then it is considered to be noise-dominated and hence unusable.
| Quadrant | # 1 sec bins | Bins with >0 counts | Bins with >2000 counts | High rate bins dominated by noise | Noise dominated (total time) | Noise dominated (detector-on time) | Marked lightcurve |
|---|---|---|---|---|---|---|---|
| A | 7317 | 5525 | 33 | 33 | 0.45% | 0.60% | 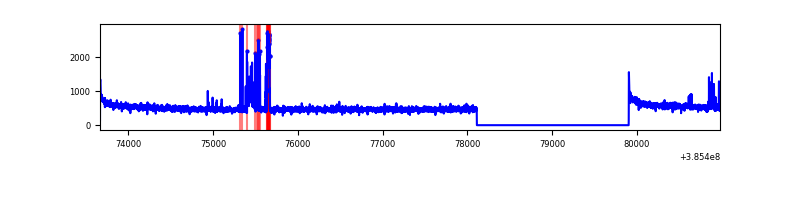 |
| B | 7317 | 5525 | 113 | 113 | 1.54% | 2.05% | 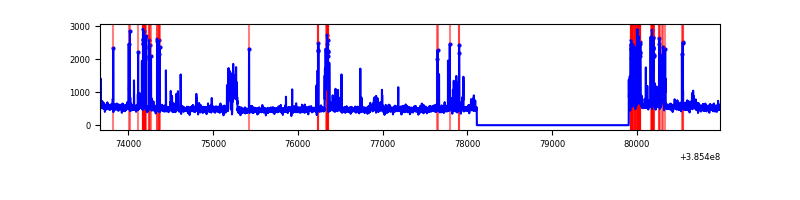 |
| C | 7317 | 5525 | 39 | 39 | 0.53% | 0.71% | 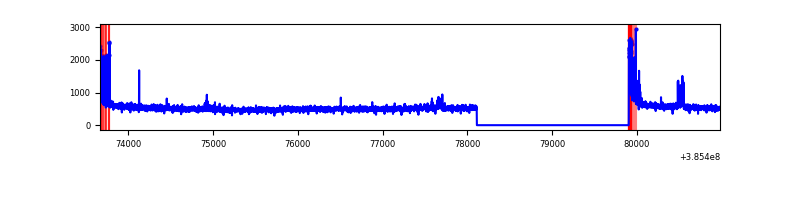 |
| D | 7317 | 5525 | 252 | 252 | 3.44% | 4.56% | 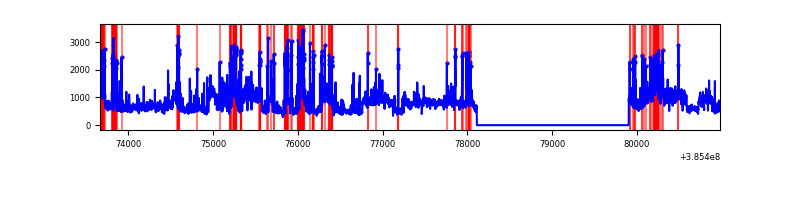 |
Top three noisy pixels from each quadrant. If the there are fewer than three noisy pixels in the level2.evt file, extra rows are filled as -1
| Pixel properties | Quadrant properties | ||||||
|---|---|---|---|---|---|---|---|
| Quadrant | DetID | PixID | Counts | Sigma | Mean | Median | Sigma |
| A | 7 | 32 | 161107 | 1163.61 | 687 | 675 | 137.9 |
| A | 10 | 83 | 77790 | 559.31 | 687 | 675 | 137.9 |
| A | 15 | 223 | 26919 | 190.35 | 687 | 675 | 137.9 |
| B | 0 | 190 | 233481 | 1842.49 | 672 | 657 | 126.4 |
| B | 5 | 172 | 206554 | 1629.4 | 672 | 657 | 126.4 |
| B | 4 | 232 | 120260 | 946.5 | 672 | 657 | 126.4 |
| C | 15 | 214 | 232425 | 1541.1 | 657 | 663 | 150.4 |
| C | 0 | 10 | 189652 | 1256.68 | 657 | 663 | 150.4 |
| C | 15 | 159 | 37596 | 245.59 | 657 | 663 | 150.4 |
| D | 8 | 195 | 1278403 | 8049.18 | 651 | 634 | 158.7 |
| D | 1 | 47 | 354136 | 2226.85 | 651 | 634 | 158.7 |
| D | 13 | 249 | 284527 | 1788.36 | 651 | 634 | 158.7 |
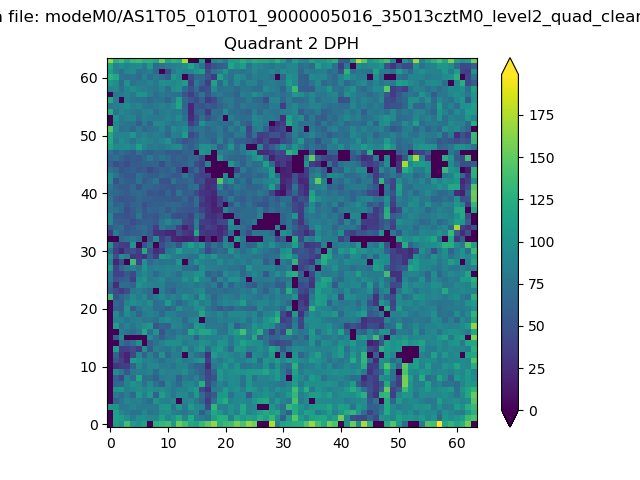
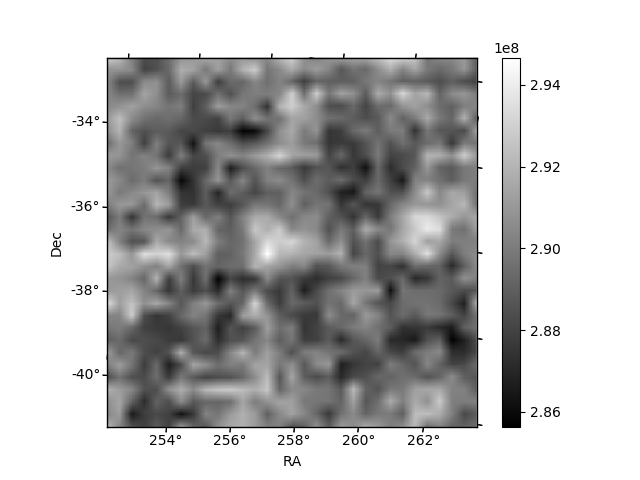
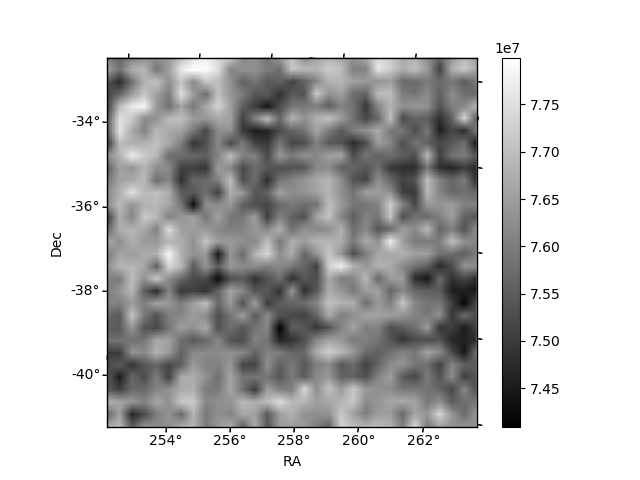
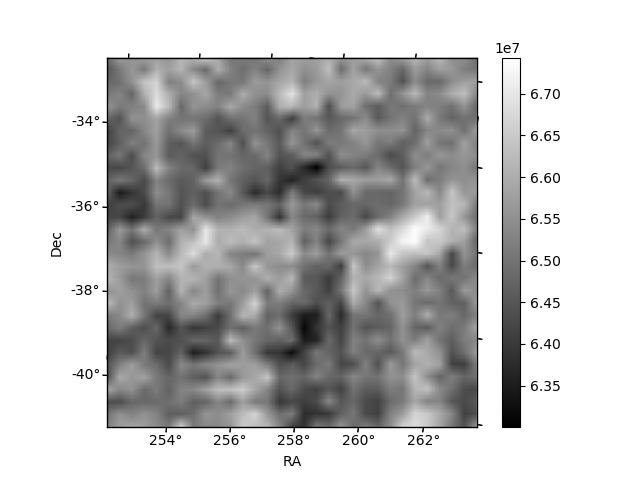
Histogram calculated using DETX and DETY for each event in the final _common_clean file
| Quadrant A | 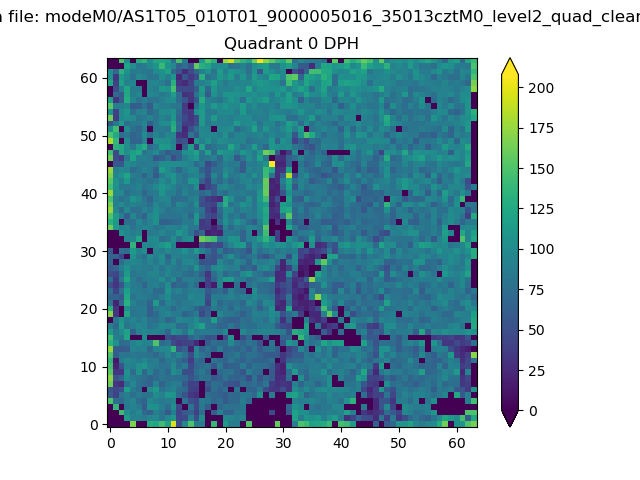 |
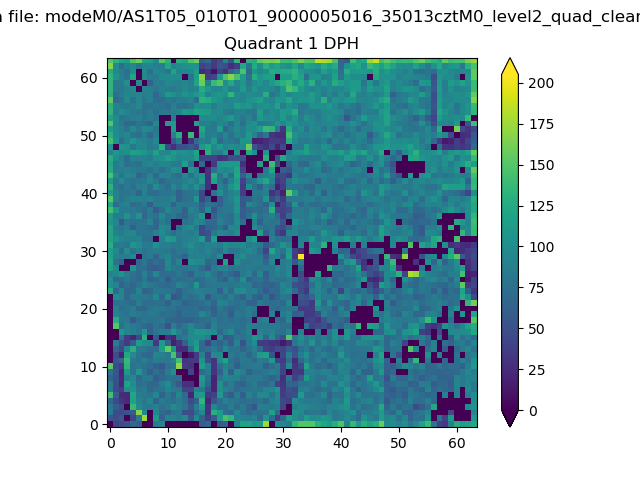 |
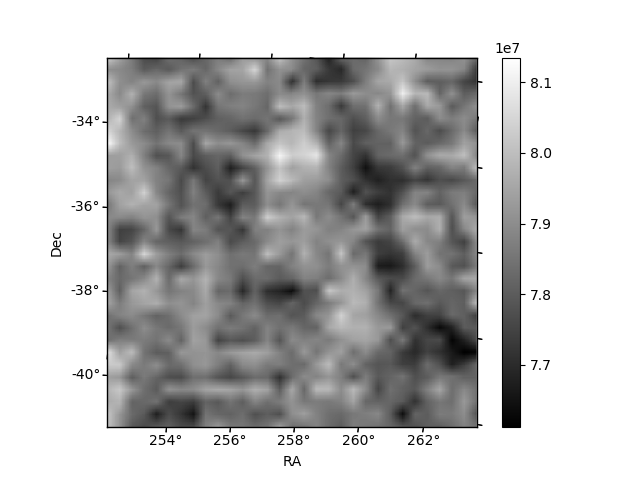
Quadrant B |
|---|---|---|---|
| Quadrant D | 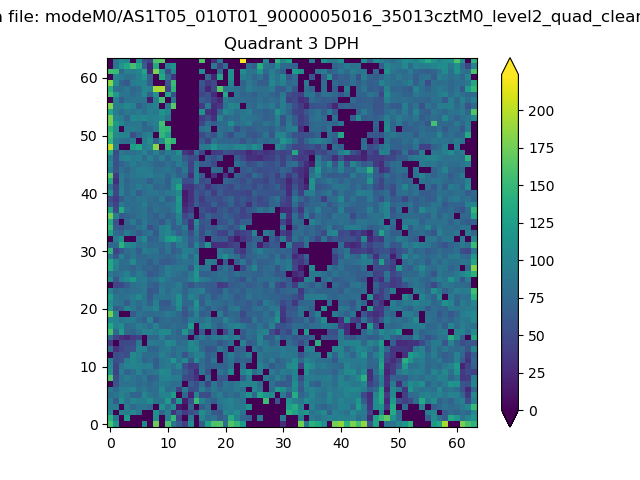 |
 |
Quadrant C |
| Plot type | Count rate plots | Images |
|---|---|---|
| Comparison with Poisson distribution Blue bars denote a histogram of data divided into 1 sec bins. Red curve is a Poisson curve with rate = median count rate of data. |
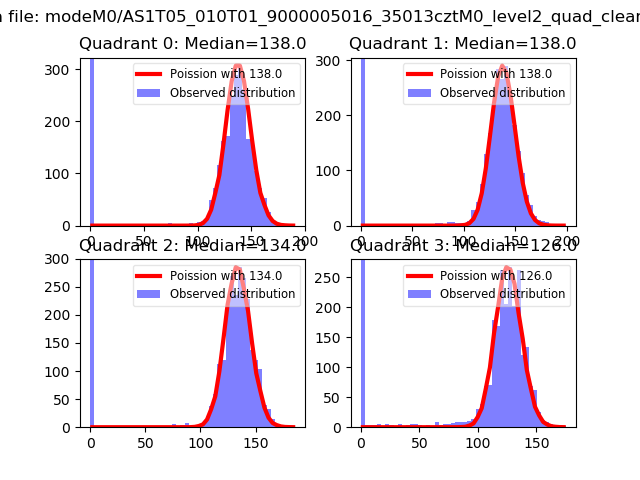 |
 |
| Quadrant-wise count rates Data is divided into 100 sec bins |
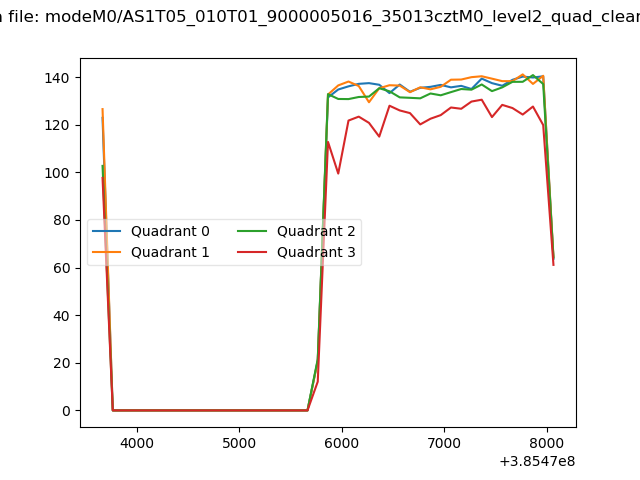 |
|
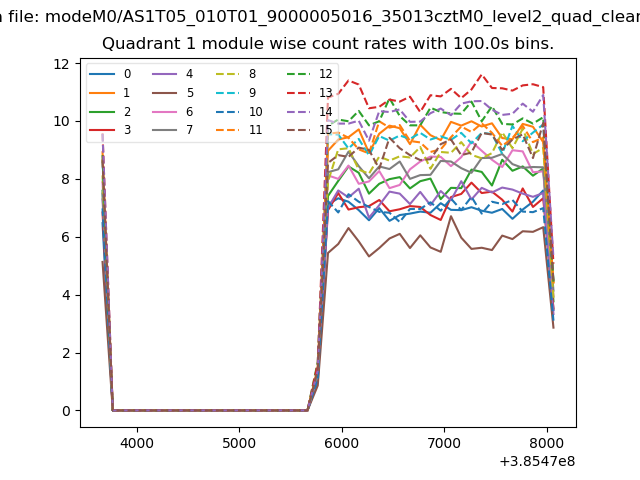
| Module-wise count rates for Quadrant A Data is divided into 100 sec bins |
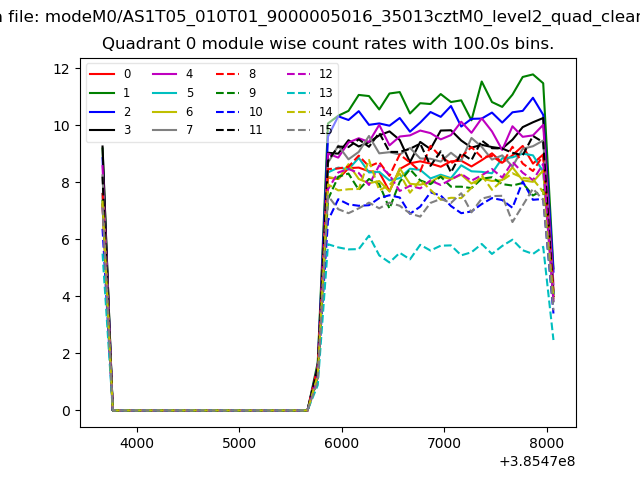 |
 |
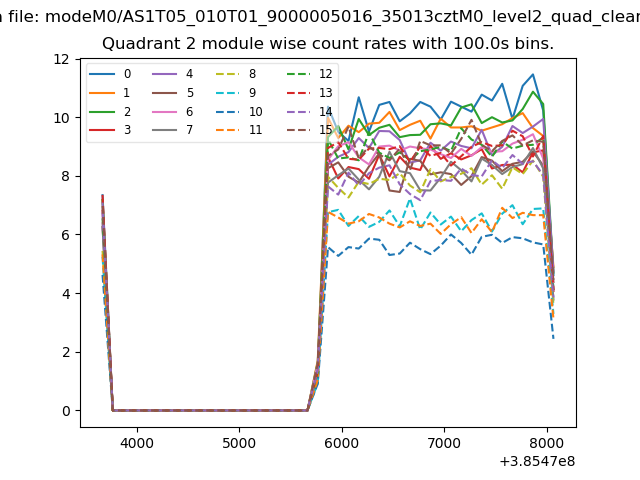
| Module-wise count rates for Quadrant B Data is divided into 100 sec bins |
 |
 |
| Module-wise count rates for Quadrant C Data is divided into 100 sec bins |
 |
 |
| Module-wise count rates for Quadrant D Data is divided into 100 sec bins |
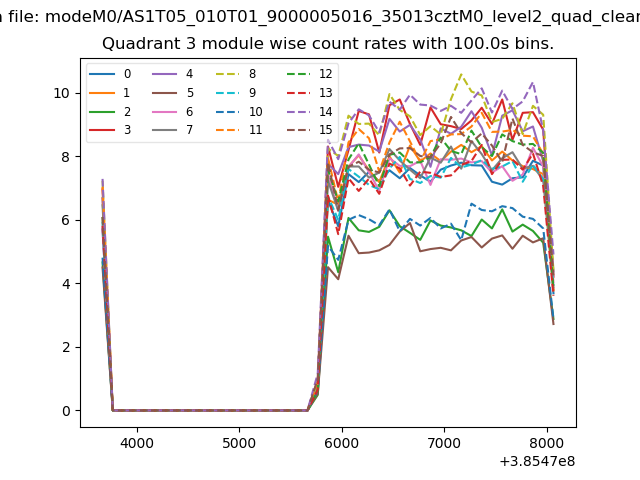 |
 |
| Parameter | Plot |
|---|---|
| CZT HV Monitor | 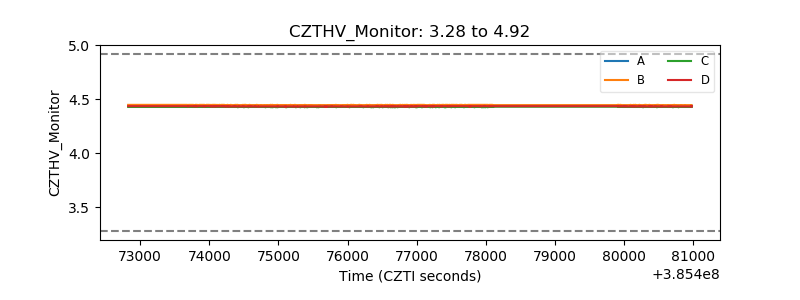 |
| D_VDD | 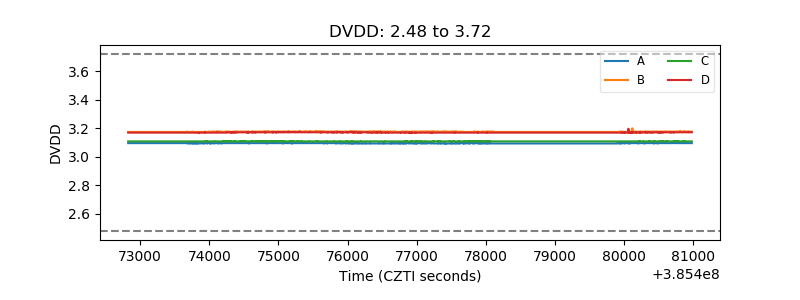 |
| Temperature 1 | 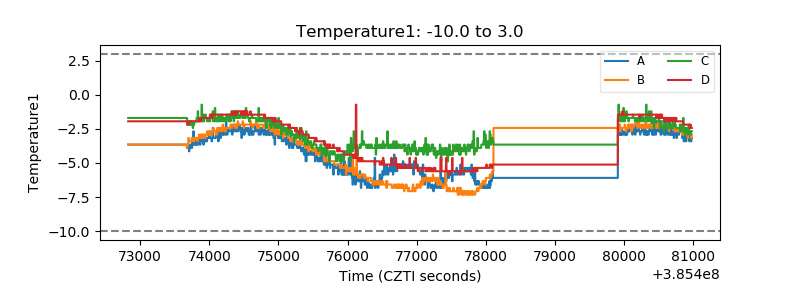 |
| Veto HV Monitor | 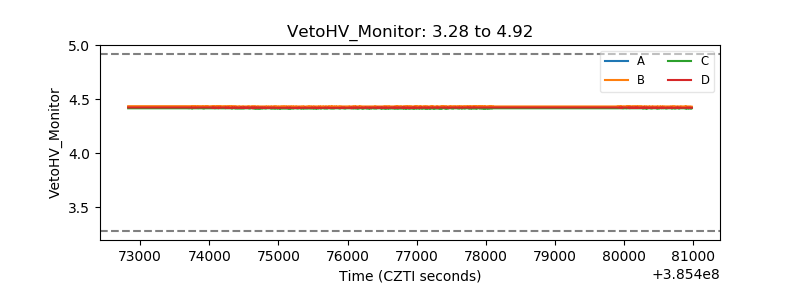 |
| Veto LLD | 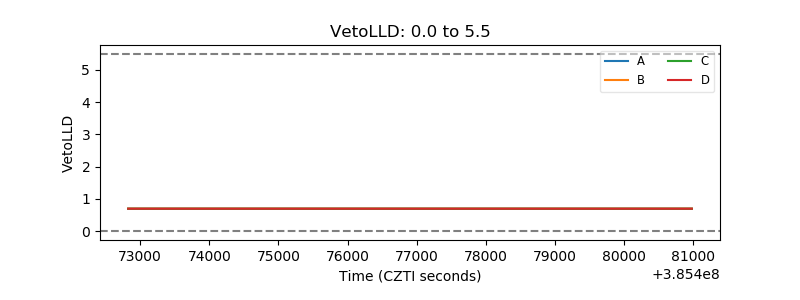 |
| Alpha Counter | 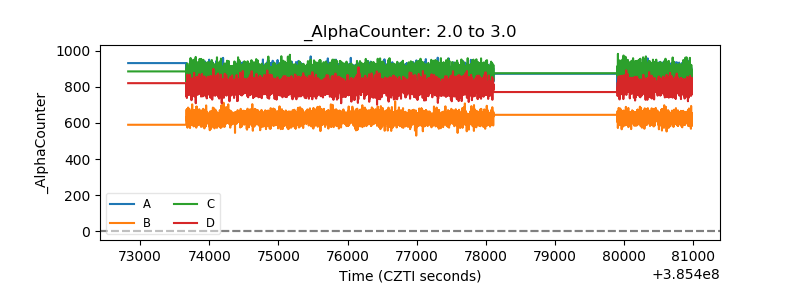 |
| _CPM_Rate | 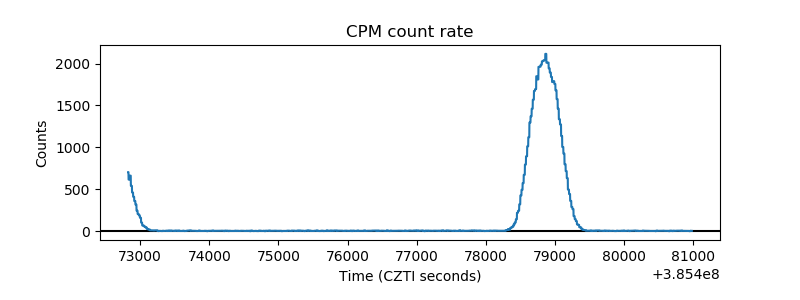 |
| CZT Counter | 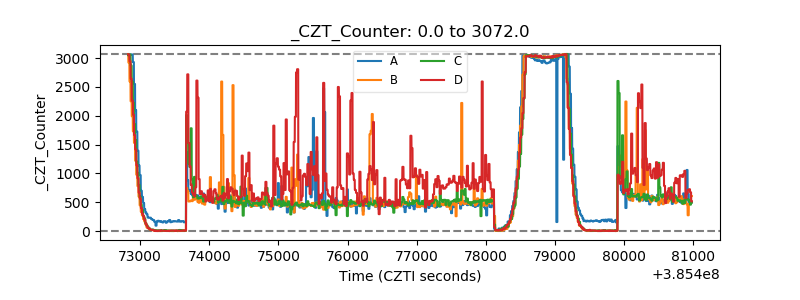 |
| +2.5 Volts monitor | 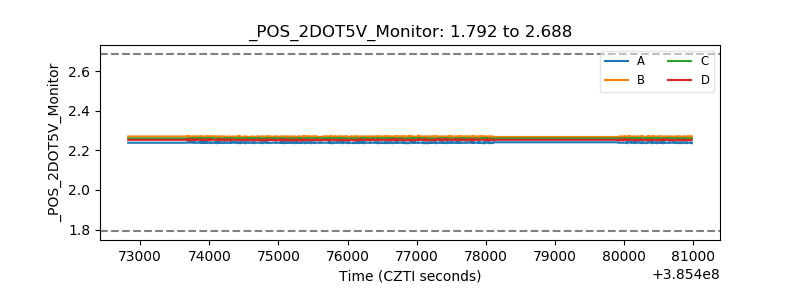 |
| +5 Volts monitor | 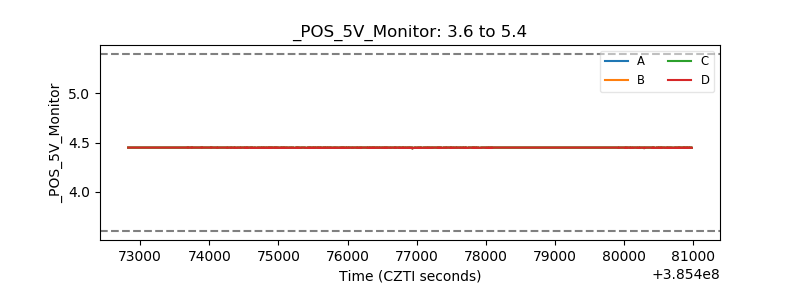 |
| _ROLL_ROT | 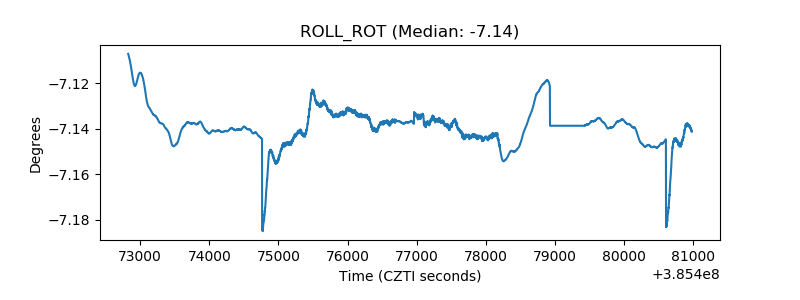 |
| _Roll_DEC | 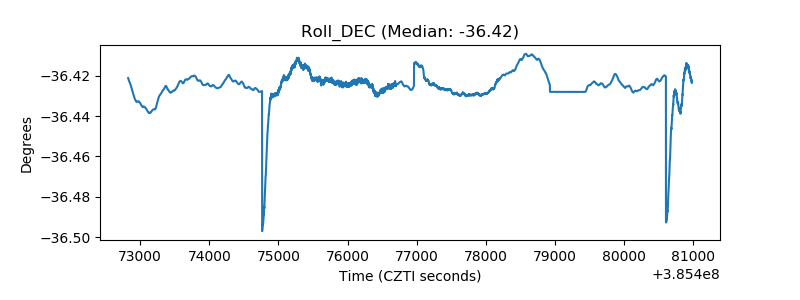 |
| _Roll_RA | 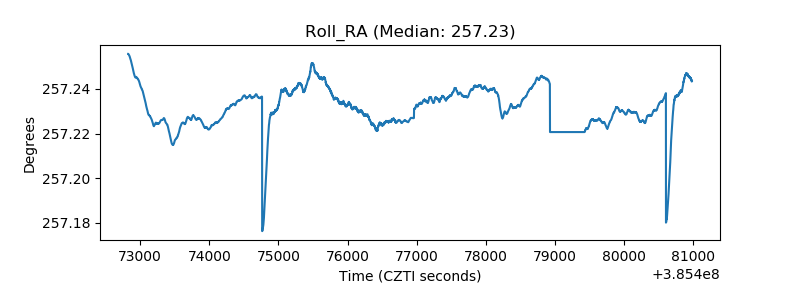 |
| Veto Counter | 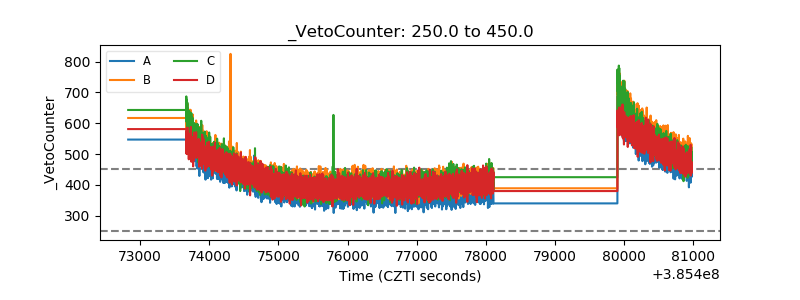 |