| Param | Original file | Final file |
|---|---|---|
| Filename | modeM0/AS1A10_123T11_9000005014_34996cztM0_level2.evt | modeM0/AS1A10_123T11_9000005014_34996cztM0_level2_quad_clean.evt |
| Size (bytes) | 1,252,978,560 | 132,759,360 |
| Size | 1.2 GB | 126.6 MB |
| Events in quadrant A | 15,060,448 | 670,384 |
| Events in quadrant B | 6,282,391 | 838,860 |
| Events in quadrant C | 6,734,630 | 832,456 |
| Events in quadrant D | 8,995,461 | 782,471 |
| Mode M0 | |||
|---|---|---|---|
| Quadrant | BADHDUFLAG | Total packets | Discarded packets |
| A | 0 | 53504 | 3 |
| B | 0 | 27006 | 3 |
| C | 0 | 27655 | 3 |
| D | 0 | 35720 | 3 |
| Mode SS | |||
|---|---|---|---|
| Quadrant | BADHDUFLAG | Total packets | Discarded packets |
| A | 0 | 264 | 0 |
| B | 0 | 264 | 0 |
| C | 0 | 264 | 0 |
| D | 0 | 264 | 0 |
| Mode M9 | |||
|---|---|---|---|
| Quadrant | BADHDUFLAG | Total packets | Discarded packets |
| A | 0 | 31 | 0 |
| B | 0 | 31 | 0 |
| C | 0 | 31 | 0 |
| D | 0 | 32 | 0 |
| Quadrant | Total seconds | Saturated seconds | Saturation percentage |
|---|---|---|---|
| A | 12949 | 3630 | 28.033053% |
| B | 12949 | 73 | 0.563750% |
| C | 12949 | 63 | 0.486524% |
| D | 12949 | 286 | 2.208665% |
Noise dominated data is calculated using 1-second bins in cleaned event files. If a bin has >2000 counts, and if more than 50% of those come from <1% of pixels, then it is considered to be noise-dominated and hence unusable.
| Quadrant | # 1 sec bins | Bins with >0 counts | Bins with >2000 counts | High rate bins dominated by noise | Noise dominated (total time) | Noise dominated (detector-on time) | Marked lightcurve |
|---|---|---|---|---|---|---|---|
| A | 15634 | 12951 | 3036 | 3036 | 19.42% | 23.44% | 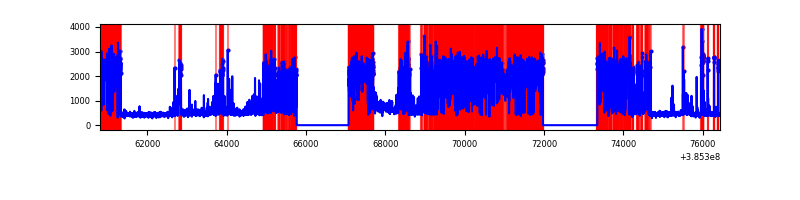 |
| B | 15634 | 12951 | 35 | 35 | 0.22% | 0.27% | 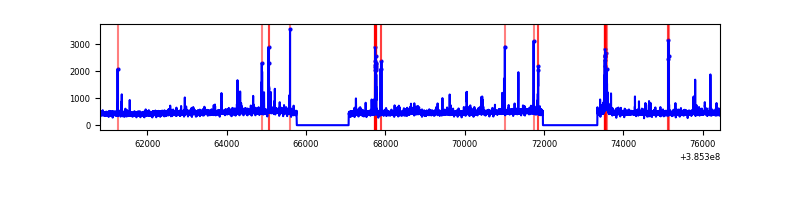 |
| C | 15634 | 12951 | 49 | 49 | 0.31% | 0.38% | 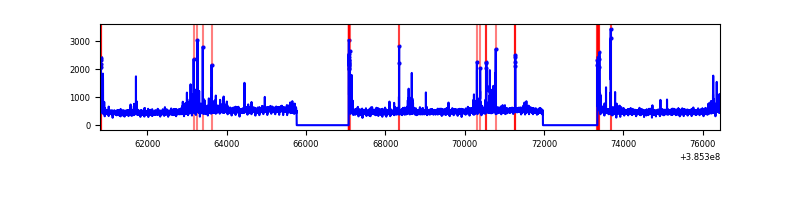 |
| D | 15634 | 12951 | 241 | 241 | 1.54% | 1.86% |  |
Top three noisy pixels from each quadrant. If the there are fewer than three noisy pixels in the level2.evt file, extra rows are filled as -1
| Pixel properties | Quadrant properties | ||||||
|---|---|---|---|---|---|---|---|
| Quadrant | DetID | PixID | Counts | Sigma | Mean | Median | Sigma |
| A | 15 | 169 | 9522919 | 35654.96 | 1338 | 1311 | 267.0 |
| A | 15 | 223 | 173627 | 645.26 | 1338 | 1311 | 267.0 |
| A | 10 | 83 | 90262 | 333.09 | 1338 | 1311 | 267.0 |
| B | 5 | 172 | 129662 | 444.09 | 1494 | 1453 | 288.7 |
| B | 4 | 232 | 116958 | 400.08 | 1494 | 1453 | 288.7 |
| B | 12 | 111 | 36344 | 120.85 | 1494 | 1453 | 288.7 |
| C | 15 | 214 | 531449 | 1565.58 | 1459 | 1468 | 338.5 |
| C | 15 | 159 | 310552 | 913.04 | 1459 | 1468 | 338.5 |
| C | 0 | 10 | 153431 | 448.9 | 1459 | 1468 | 338.5 |
| D | 8 | 195 | 1947527 | 5470.65 | 1456 | 1414 | 355.7 |
| D | 13 | 249 | 713672 | 2002.2 | 1456 | 1414 | 355.7 |
| D | 2 | 250 | 161221 | 449.23 | 1456 | 1414 | 355.7 |
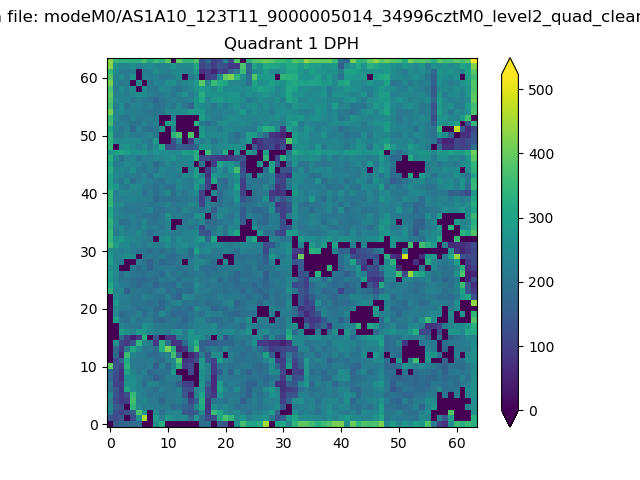
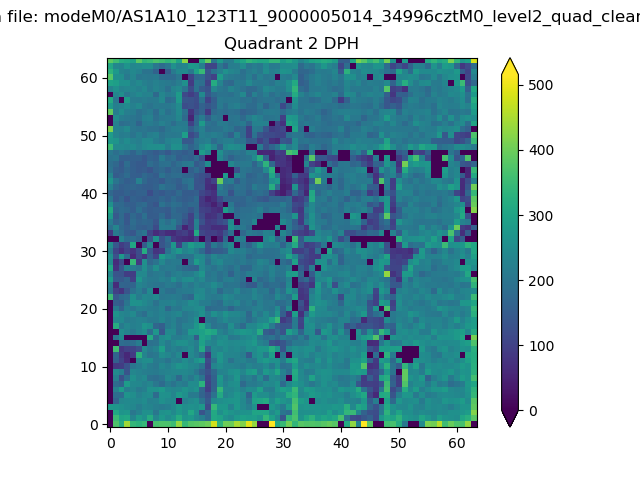
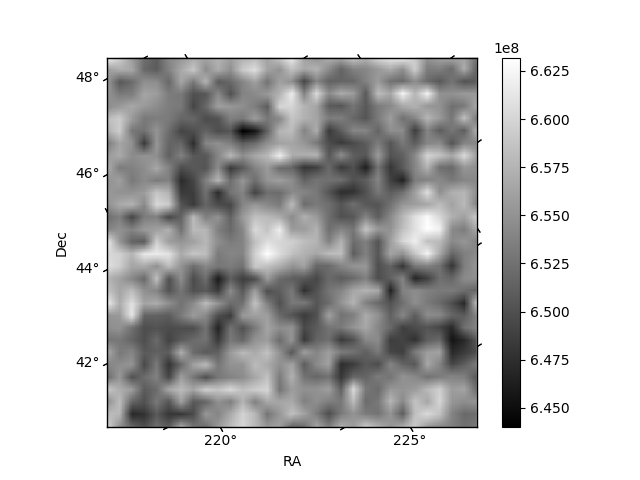
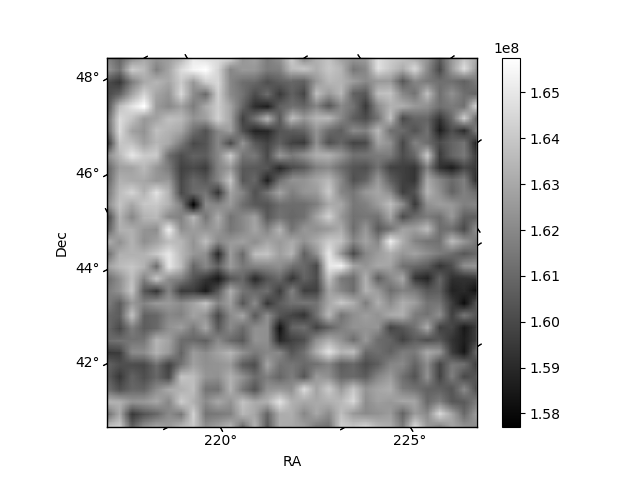
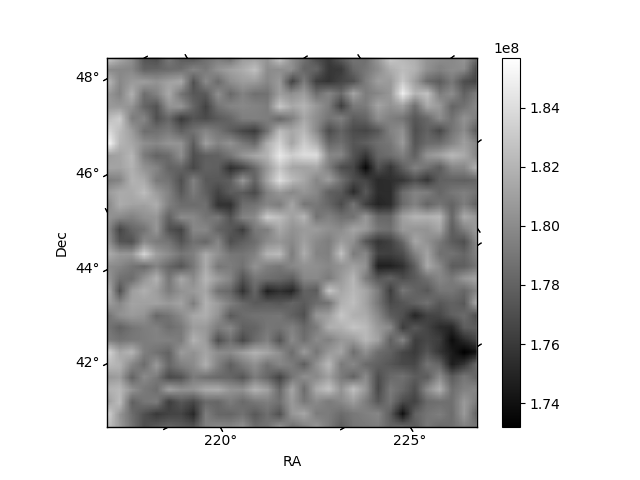
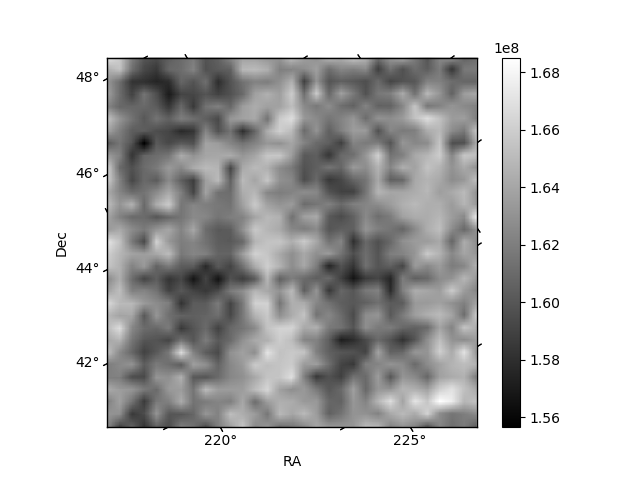
Histogram calculated using DETX and DETY for each event in the final _common_clean file
| Quadrant A | 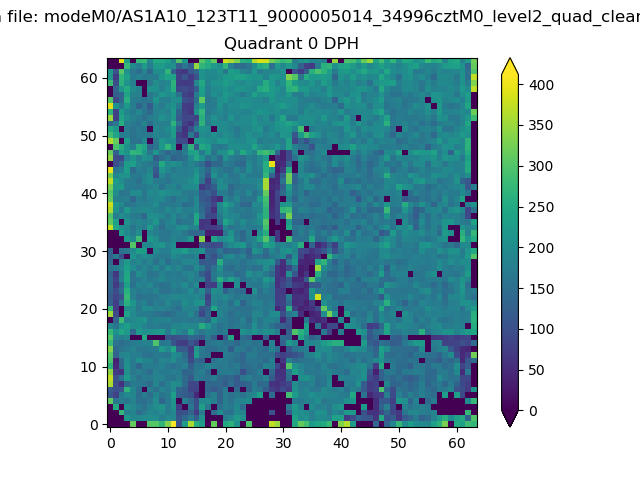 |
 |
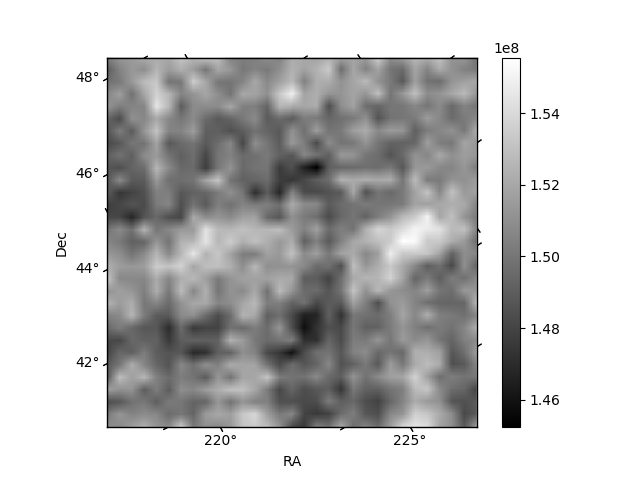
Quadrant B |
|---|---|---|---|
| Quadrant D | 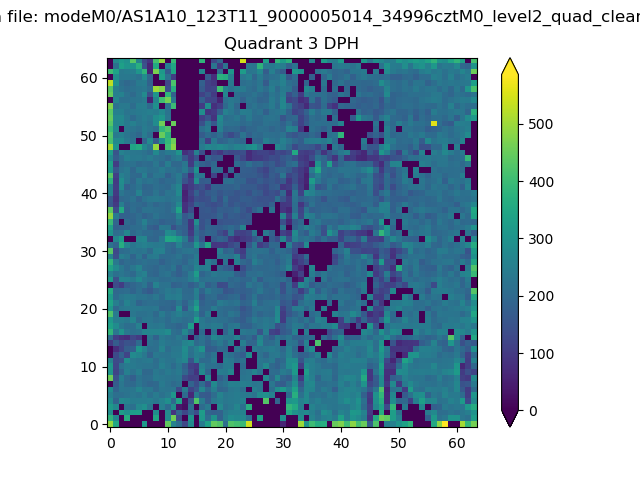 |
 |
Quadrant C |
| Plot type | Count rate plots | Images |
|---|---|---|
| Comparison with Poisson distribution Blue bars denote a histogram of data divided into 1 sec bins. Red curve is a Poisson curve with rate = median count rate of data. |
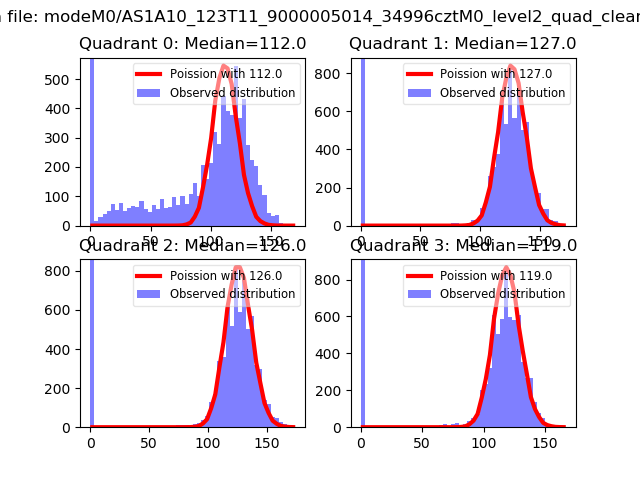 |
 |
| Quadrant-wise count rates Data is divided into 100 sec bins |
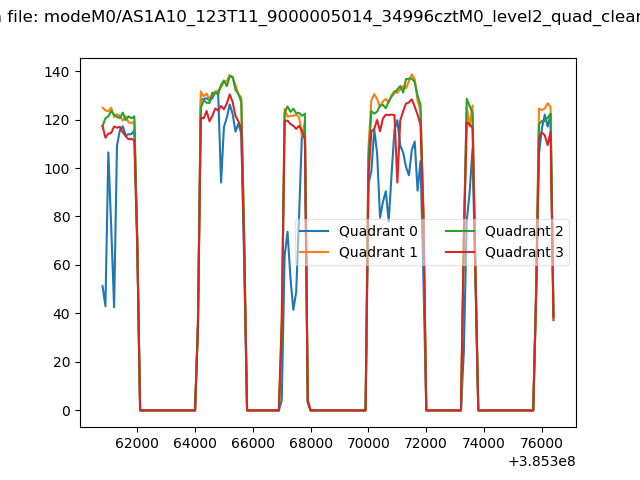 |
|
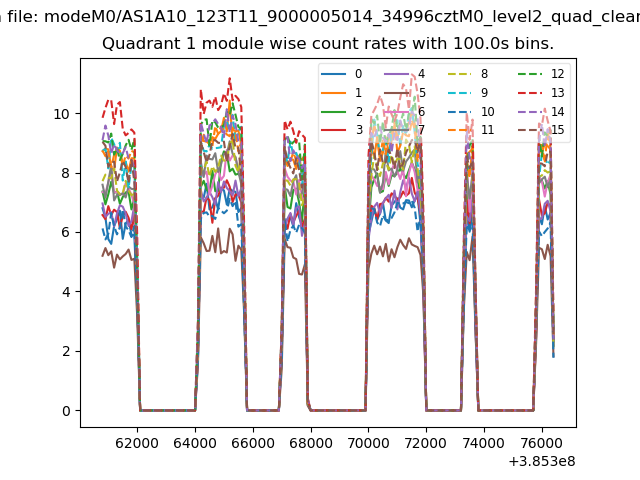
| Module-wise count rates for Quadrant A Data is divided into 100 sec bins |
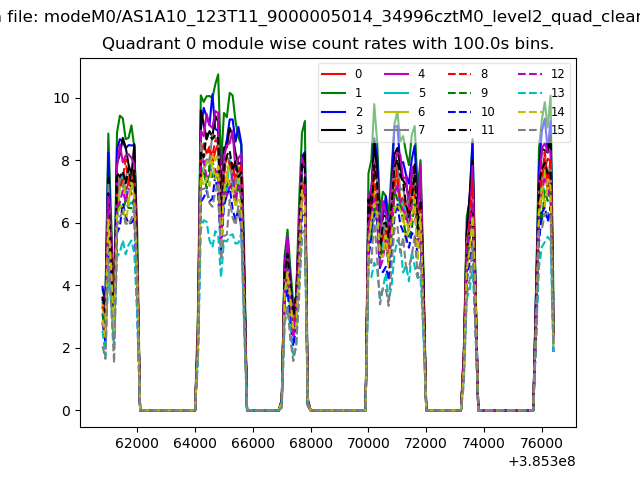 |
 |
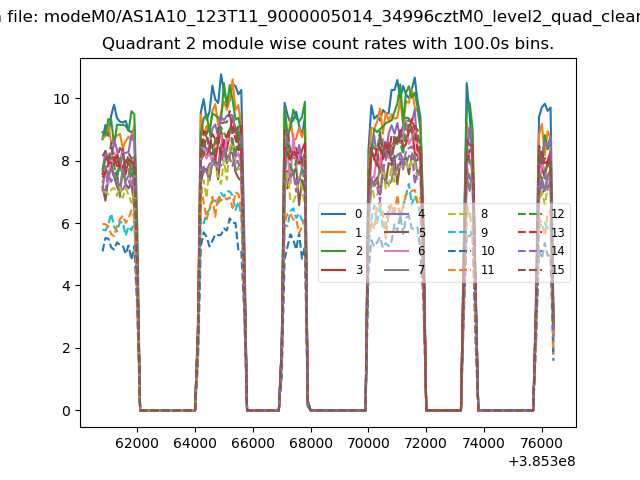
| Module-wise count rates for Quadrant B Data is divided into 100 sec bins |
 |
 |
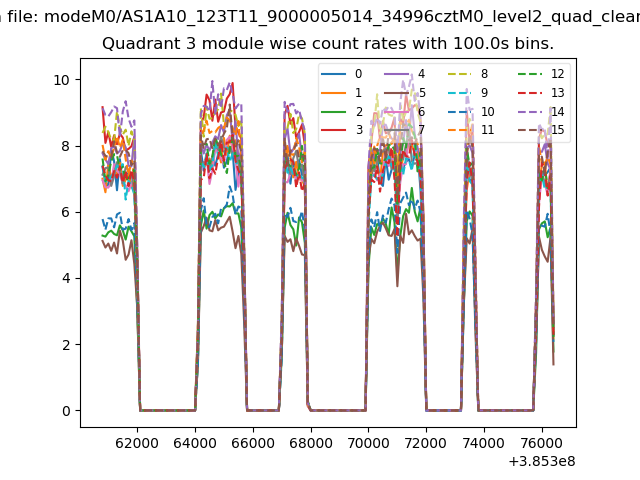
| Module-wise count rates for Quadrant C Data is divided into 100 sec bins |
 |
 |
| Module-wise count rates for Quadrant D Data is divided into 100 sec bins |
 |
 |
| Parameter | Plot |
|---|---|
| CZT HV Monitor | 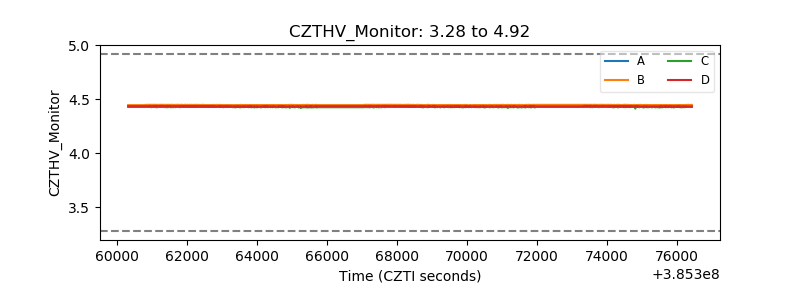 |
| D_VDD | 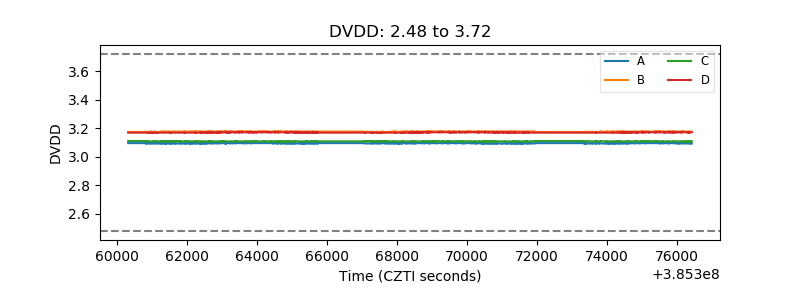 |
| Temperature 1 | 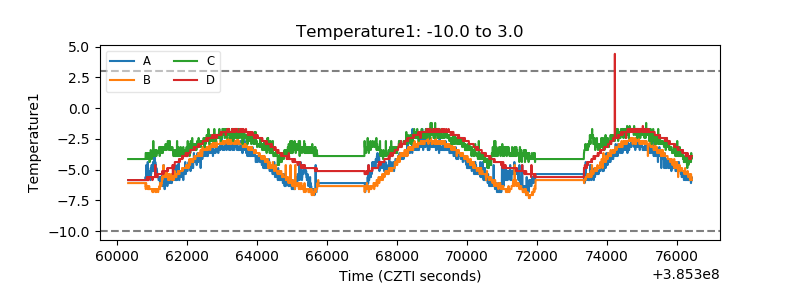 |
| Veto HV Monitor | 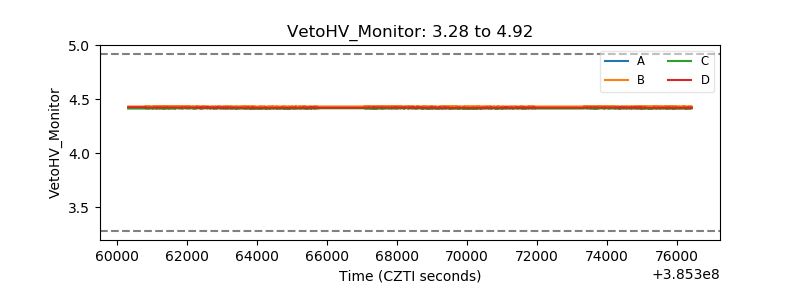 |
| Veto LLD | 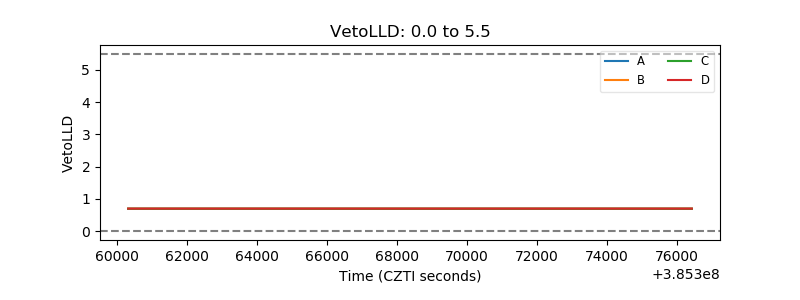 |
| Alpha Counter | 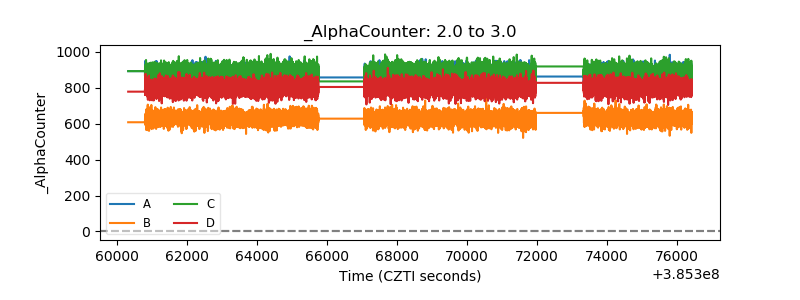 |
| _CPM_Rate | 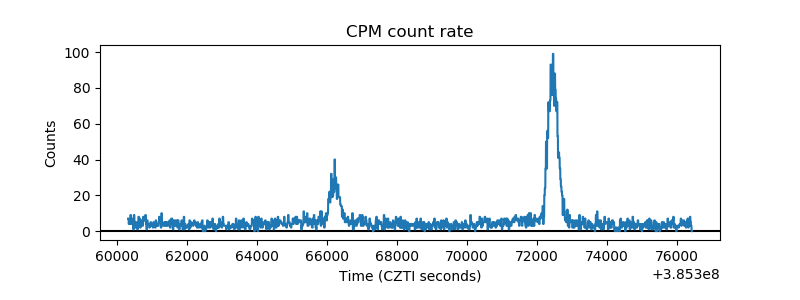 |
| CZT Counter | 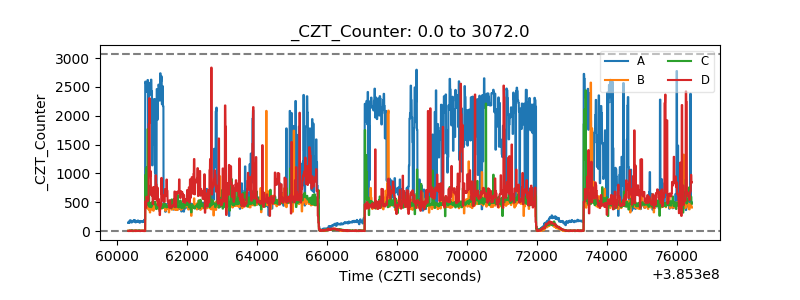 |
| +2.5 Volts monitor | 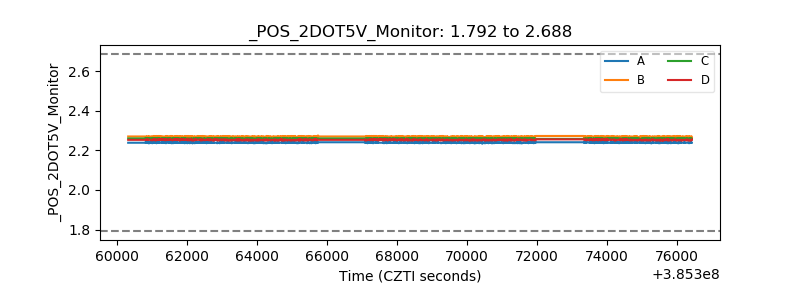 |
| +5 Volts monitor | 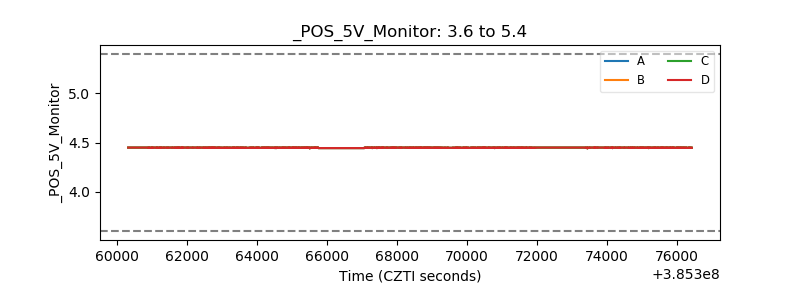 |
| _ROLL_ROT | 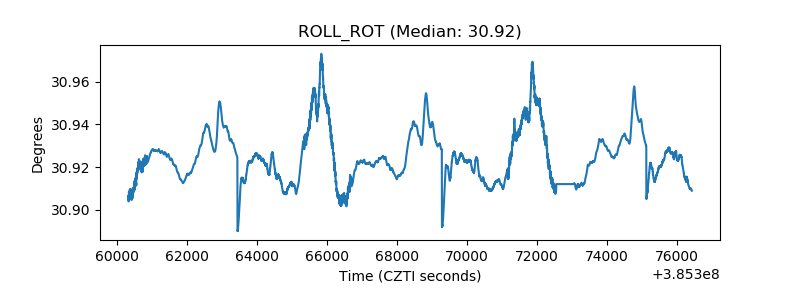 |
| _Roll_DEC | 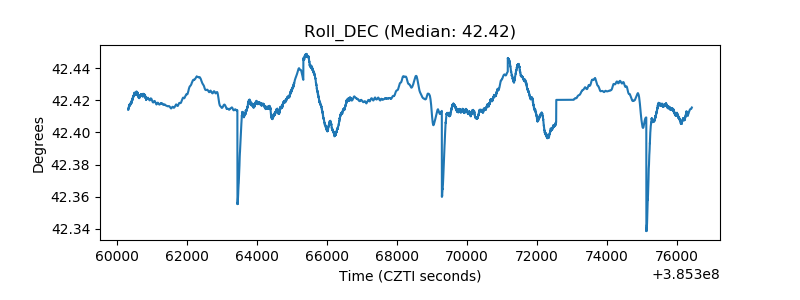 |
| _Roll_RA | 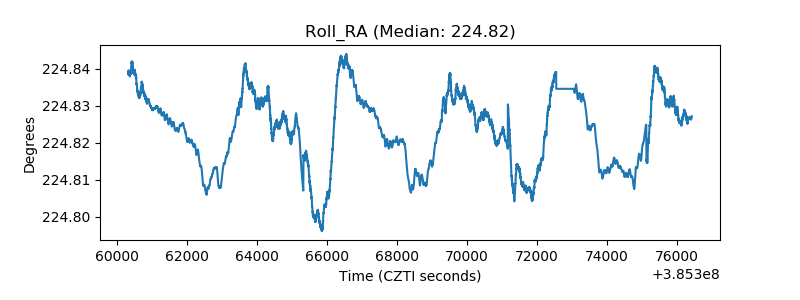 |
| Veto Counter | 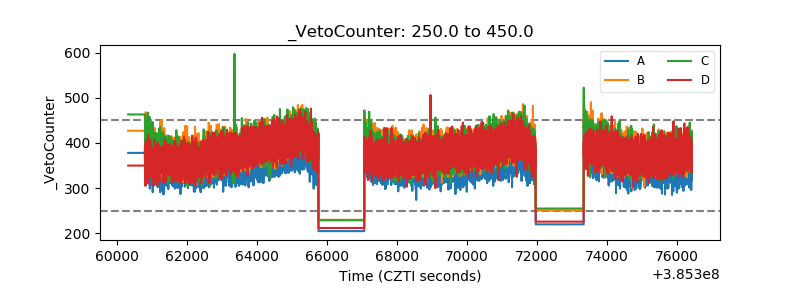 |