| Param | Original file | Final file |
|---|---|---|
| Filename | modeM0/AS1A10_123T09_9000005012_34984cztM0_level2.evt | modeM0/AS1A10_123T09_9000005012_34984cztM0_level2_quad_clean.evt |
| Size (bytes) | 431,127,360 | 70,948,800 |
| Size | 411.2 MB | 67.7 MB |
| Events in quadrant A | 2,656,685 | 449,951 |
| Events in quadrant B | 2,926,064 | 452,027 |
| Events in quadrant C | 2,950,819 | 450,714 |
| Events in quadrant D | 4,162,725 | 423,794 |
| Mode SS | |||
|---|---|---|---|
| Quadrant | BADHDUFLAG | Total packets | Discarded packets |
| A | 0 | 108 | 0 |
| B | 0 | 108 | 0 |
| C | 0 | 108 | 0 |
| D | 0 | 108 | 0 |
| Mode M0 | |||
|---|---|---|---|
| Quadrant | BADHDUFLAG | Total packets | Discarded packets |
| A | 0 | 11414 | 3 |
| B | 0 | 11977 | 2 |
| C | 0 | 11917 | 2 |
| D | 0 | 16023 | 2 |
| Mode M9 | |||
|---|---|---|---|
| Quadrant | BADHDUFLAG | Total packets | Discarded packets |
| A | 0 | 25 | 0 |
| B | 0 | 25 | 0 |
| C | 0 | 25 | 0 |
| D | 0 | 26 | 0 |
| Quadrant | Total seconds | Saturated seconds | Saturation percentage |
|---|---|---|---|
| A | 5311 | 15 | 0.282433% |
| B | 5311 | 69 | 1.299190% |
| C | 5311 | 49 | 0.922613% |
| D | 5311 | 98 | 1.845227% |
Noise dominated data is calculated using 1-second bins in cleaned event files. If a bin has >2000 counts, and if more than 50% of those come from <1% of pixels, then it is considered to be noise-dominated and hence unusable.
| Quadrant | # 1 sec bins | Bins with >0 counts | Bins with >2000 counts | High rate bins dominated by noise | Noise dominated (total time) | Noise dominated (detector-on time) | Marked lightcurve |
|---|---|---|---|---|---|---|---|
| A | 7104 | 5312 | 6 | 6 | 0.08% | 0.11% | 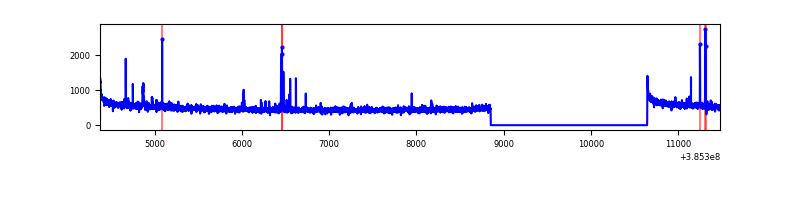 |
| B | 7104 | 5312 | 39 | 39 | 0.55% | 0.73% | 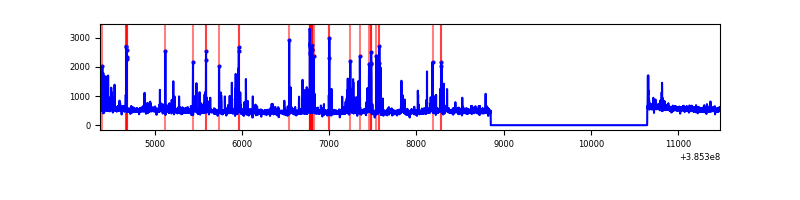 |
| C | 7104 | 5312 | 42 | 42 | 0.59% | 0.79% | 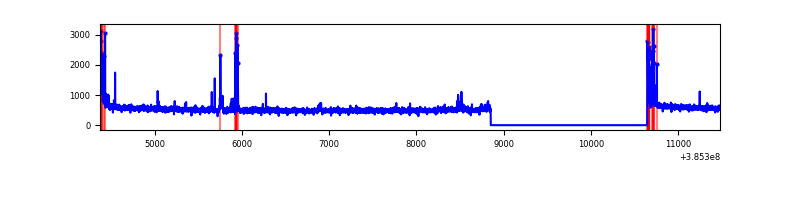 |
| D | 7104 | 5312 | 72 | 72 | 1.01% | 1.36% | 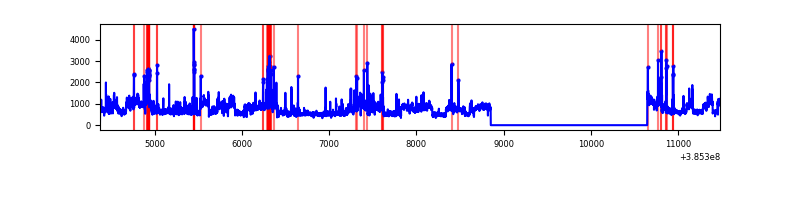 |
Top three noisy pixels from each quadrant. If the there are fewer than three noisy pixels in the level2.evt file, extra rows are filled as -1
| Pixel properties | Quadrant properties | ||||||
|---|---|---|---|---|---|---|---|
| Quadrant | DetID | PixID | Counts | Sigma | Mean | Median | Sigma |
| A | 10 | 83 | 74515 | 570.61 | 647 | 636 | 129.5 |
| A | 15 | 174 | 48263 | 367.85 | 647 | 636 | 129.5 |
| A | 9 | 143 | 25170 | 189.49 | 647 | 636 | 129.5 |
| B | 5 | 172 | 250996 | 2045.92 | 640 | 624 | 122.4 |
| B | 10 | 245 | 39435 | 317.14 | 640 | 624 | 122.4 |
| B | 3 | 112 | 38612 | 310.42 | 640 | 624 | 122.4 |
| C | 15 | 214 | 222640 | 1519.63 | 634 | 639 | 146.1 |
| C | 0 | 10 | 136076 | 927.08 | 634 | 639 | 146.1 |
| C | 15 | 159 | 55665 | 376.66 | 634 | 639 | 146.1 |
| D | 8 | 195 | 1300905 | 8509.82 | 630 | 613 | 152.8 |
| D | 13 | 249 | 168131 | 1096.33 | 630 | 613 | 152.8 |
| D | 12 | 6 | 61278 | 397.03 | 630 | 613 | 152.8 |
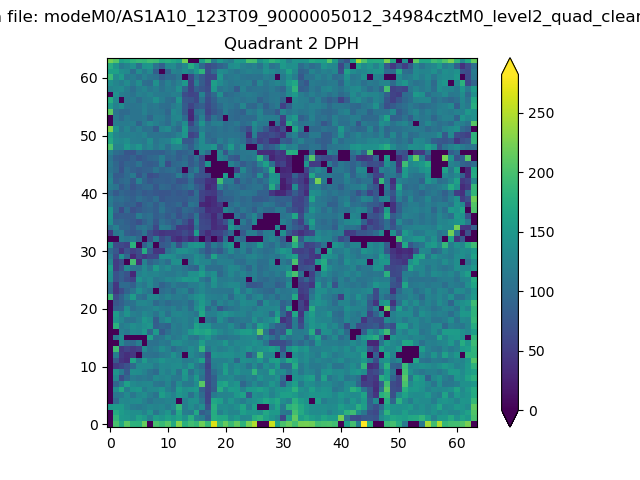
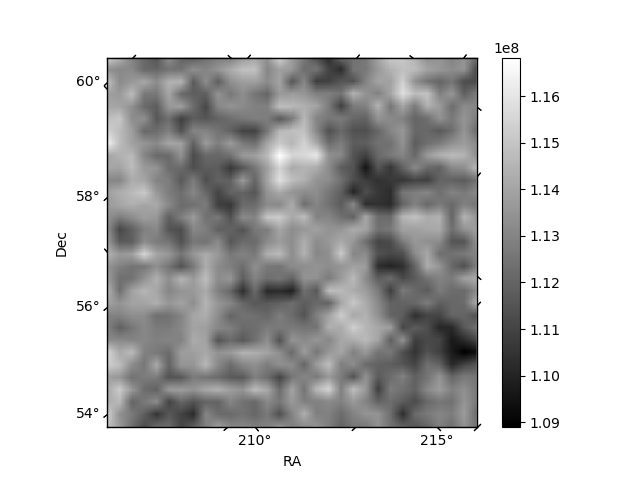
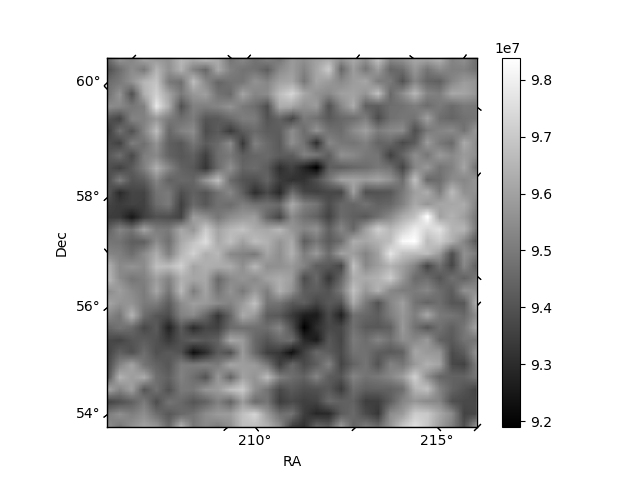
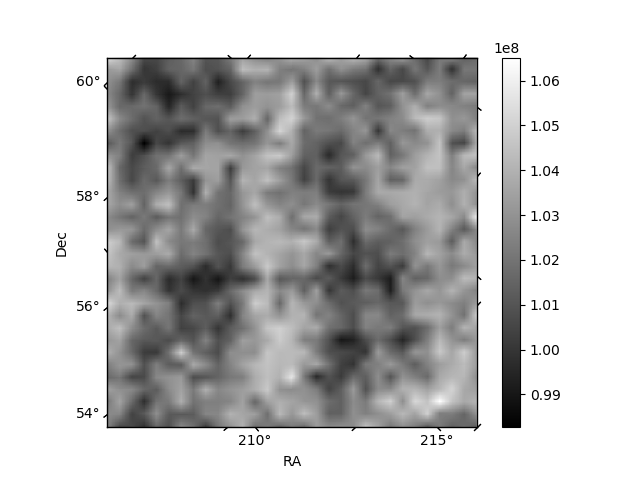
Histogram calculated using DETX and DETY for each event in the final _common_clean file
| Quadrant A | 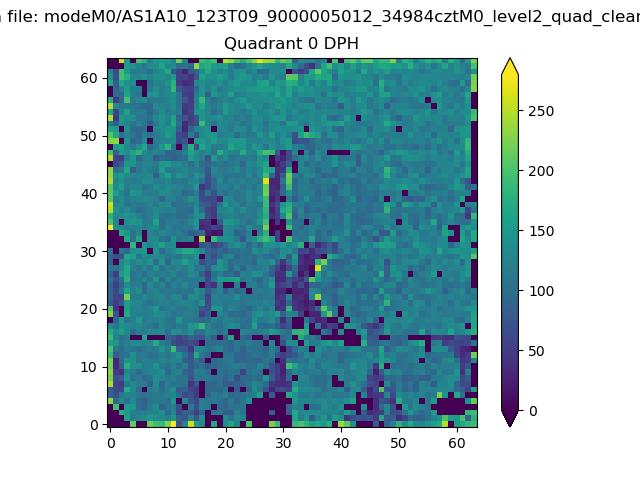 |
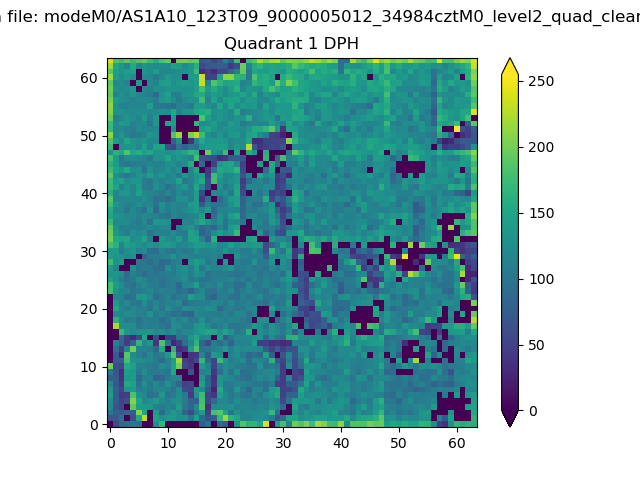 |
Quadrant B |
|---|---|---|---|
| Quadrant D | 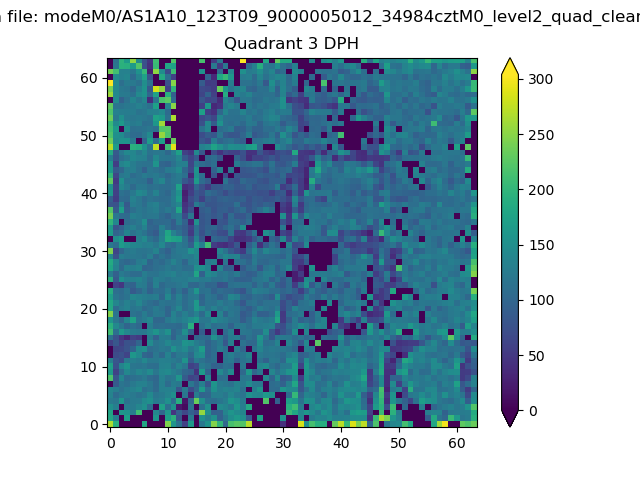 |
 |
Quadrant C |
| Plot type | Count rate plots | Images |
|---|---|---|
| Comparison with Poisson distribution Blue bars denote a histogram of data divided into 1 sec bins. Red curve is a Poisson curve with rate = median count rate of data. |
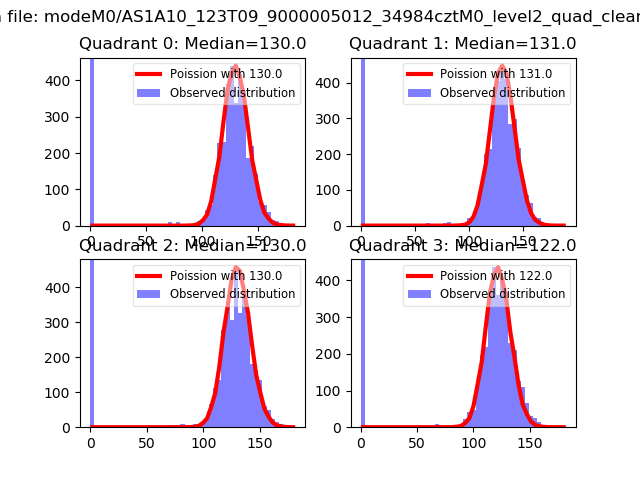 |
 |
| Quadrant-wise count rates Data is divided into 100 sec bins |
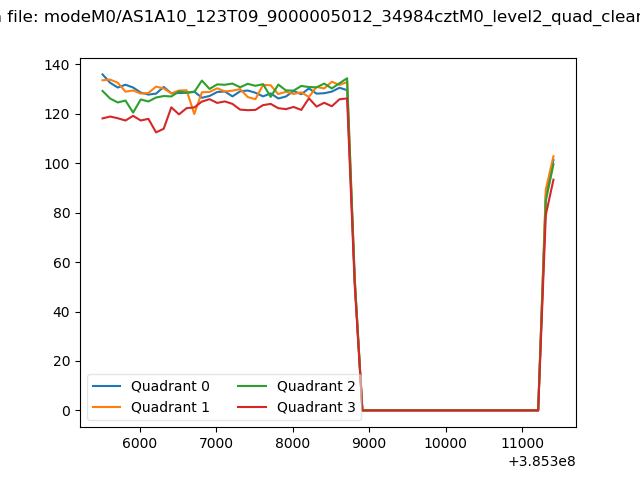 |
|
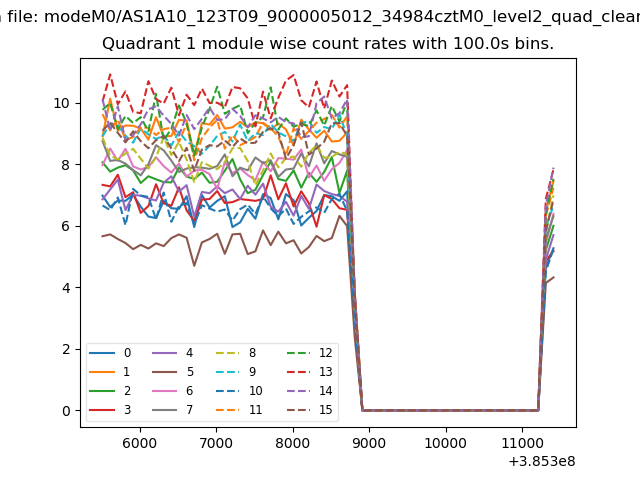
| Module-wise count rates for Quadrant A Data is divided into 100 sec bins |
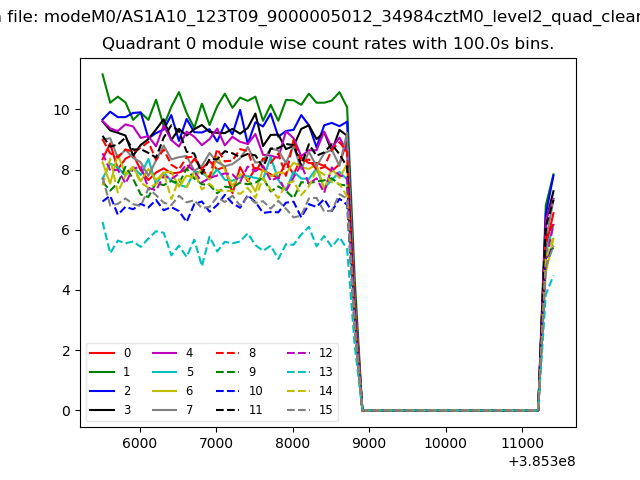 |
 |
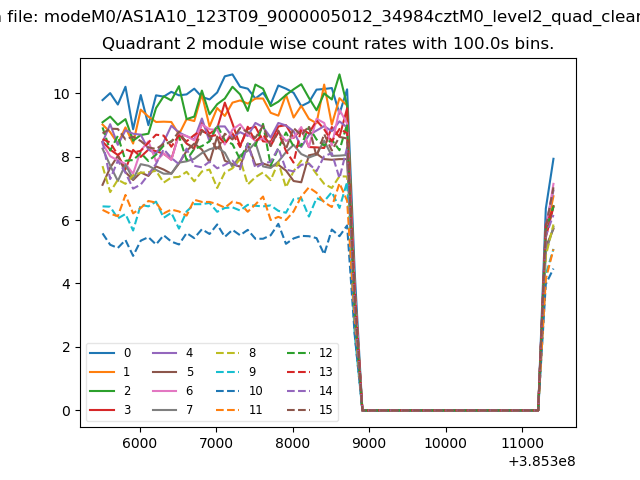
| Module-wise count rates for Quadrant B Data is divided into 100 sec bins |
 |
 |
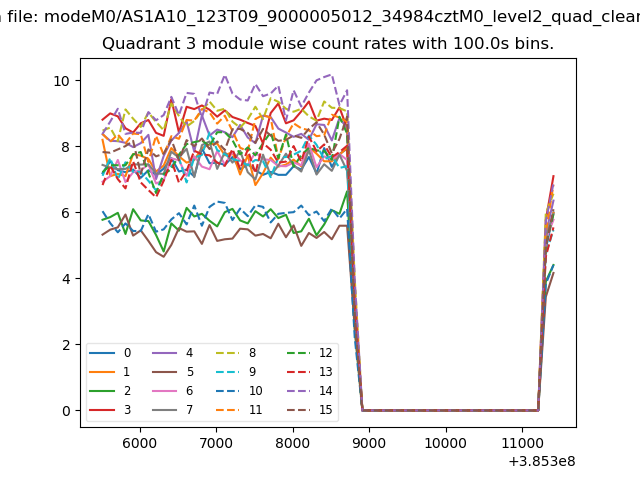
| Module-wise count rates for Quadrant C Data is divided into 100 sec bins |
 |
 |
| Module-wise count rates for Quadrant D Data is divided into 100 sec bins |
 |
 |
| Parameter | Plot |
|---|---|
| CZT HV Monitor | 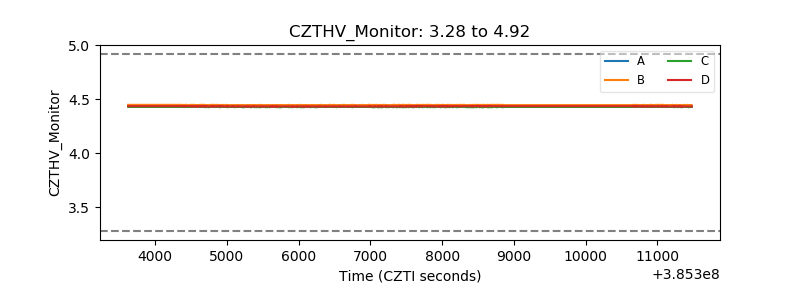 |
| D_VDD | 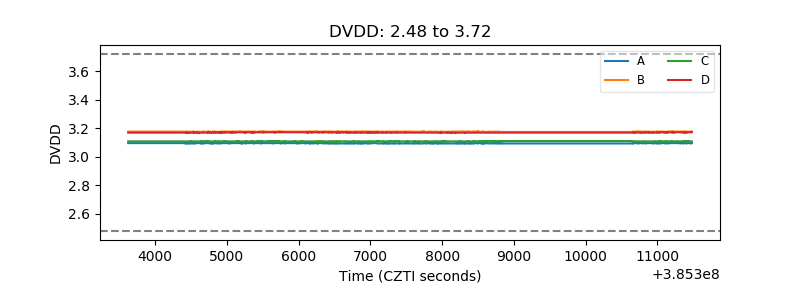 |
| Temperature 1 | 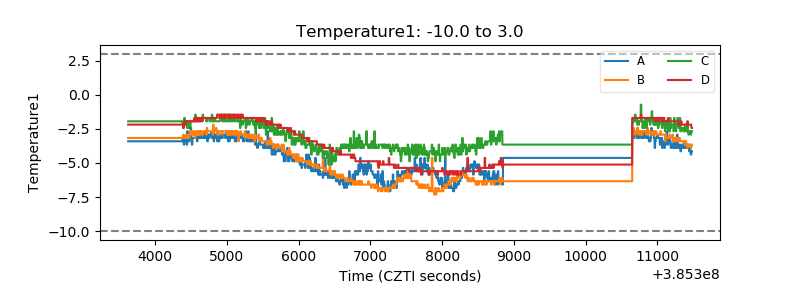 |
| Veto HV Monitor | 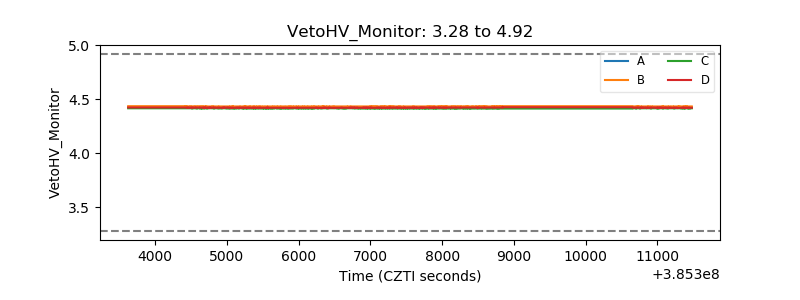 |
| Veto LLD | 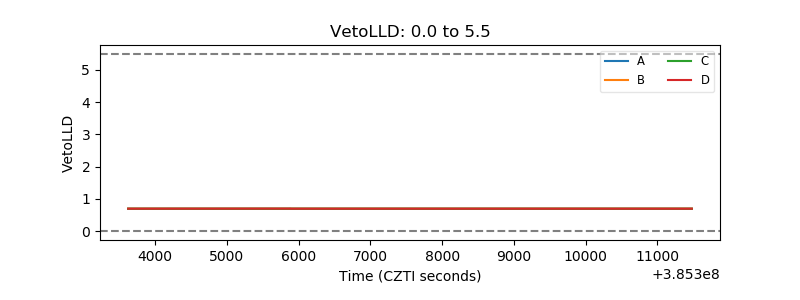 |
| Alpha Counter | 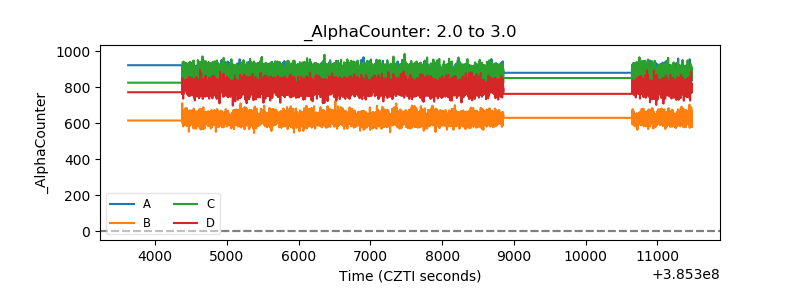 |
| _CPM_Rate | 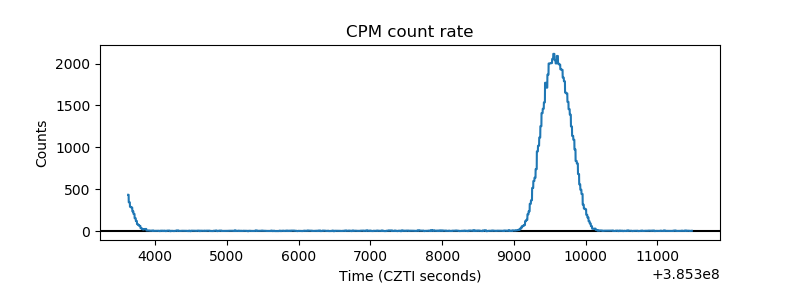 |
| CZT Counter | 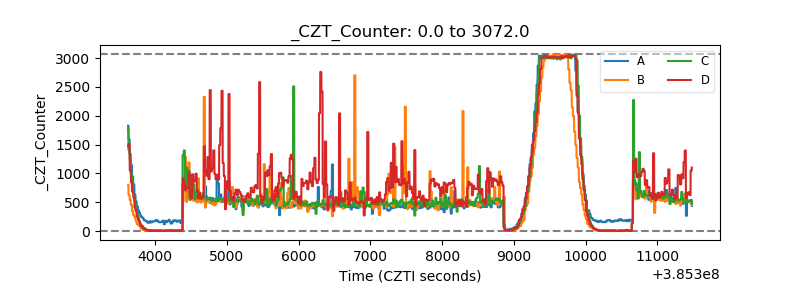 |
| +2.5 Volts monitor | 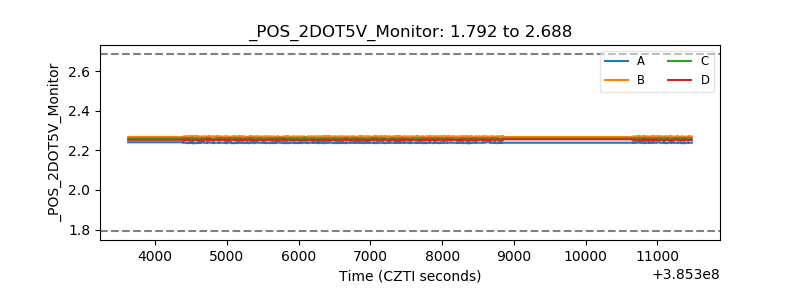 |
| +5 Volts monitor | 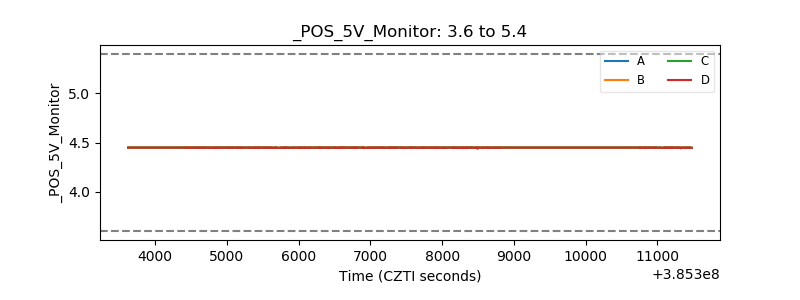 |
| _ROLL_ROT | 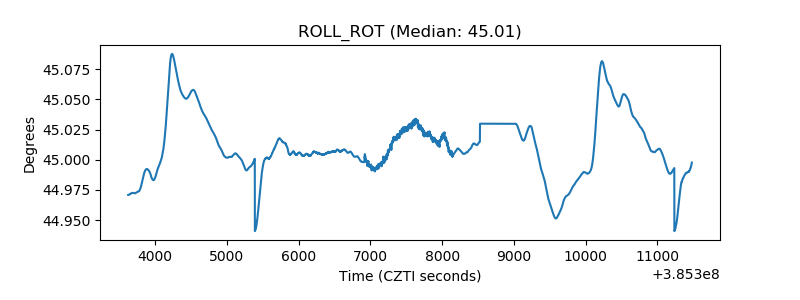 |
| _Roll_DEC | 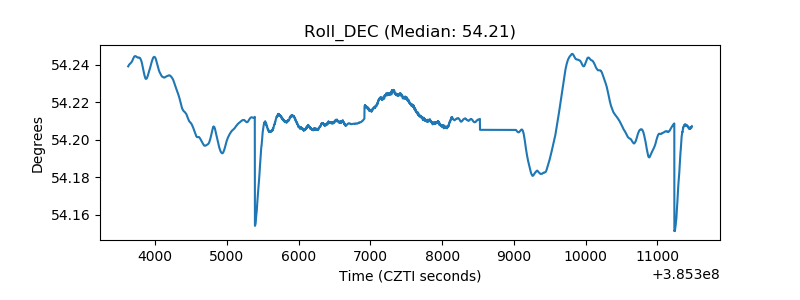 |
| _Roll_RA | 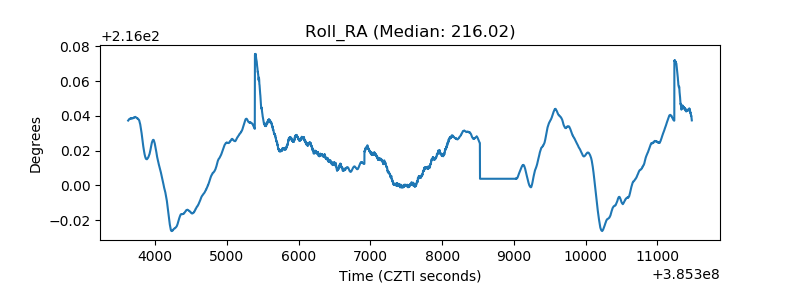 |
| Veto Counter | 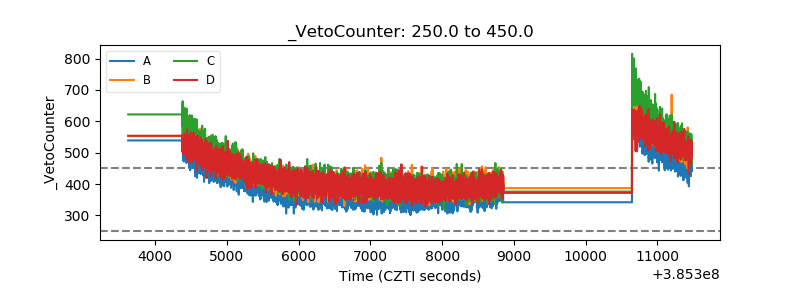 |