| Param | Original file | Final file |
|---|---|---|
| Filename | modeM0/AS1A10_123T09_9000005012_34981cztM0_level2.evt | modeM0/AS1A10_123T09_9000005012_34981cztM0_level2_quad_clean.evt |
| Size (bytes) | 1,213,608,960 | 166,204,800 |
| Size | 1.1 GB | 158.5 MB |
| Events in quadrant A | 6,835,761 | 1,015,964 |
| Events in quadrant B | 10,012,797 | 1,016,520 |
| Events in quadrant C | 7,508,009 | 1,017,780 |
| Events in quadrant D | 11,397,001 | 959,502 |
| Mode SS | |||
|---|---|---|---|
| Quadrant | BADHDUFLAG | Total packets | Discarded packets |
| A | 0 | 302 | 0 |
| B | 0 | 302 | 0 |
| C | 0 | 302 | 0 |
| D | 0 | 302 | 0 |
| Mode M0 | |||
|---|---|---|---|
| Quadrant | BADHDUFLAG | Total packets | Discarded packets |
| A | 0 | 30080 | 4 |
| B | 0 | 39383 | 3 |
| C | 0 | 30860 | 3 |
| D | 0 | 43897 | 3 |
| Mode M9 | |||
|---|---|---|---|
| Quadrant | BADHDUFLAG | Total packets | Discarded packets |
| A | 0 | 43 | 0 |
| B | 0 | 43 | 0 |
| C | 0 | 43 | 0 |
| D | 0 | 43 | 0 |
| Quadrant | Total seconds | Saturated seconds | Saturation percentage |
|---|---|---|---|
| A | 14833 | 14 | 0.094384% |
| B | 14833 | 982 | 6.620373% |
| C | 14833 | 52 | 0.350570% |
| D | 14833 | 255 | 1.719140% |
Noise dominated data is calculated using 1-second bins in cleaned event files. If a bin has >2000 counts, and if more than 50% of those come from <1% of pixels, then it is considered to be noise-dominated and hence unusable.
| Quadrant | # 1 sec bins | Bins with >0 counts | Bins with >2000 counts | High rate bins dominated by noise | Noise dominated (total time) | Noise dominated (detector-on time) | Marked lightcurve |
|---|---|---|---|---|---|---|---|
| A | 19162 | 14836 | 4 | 4 | 0.02% | 0.03% | 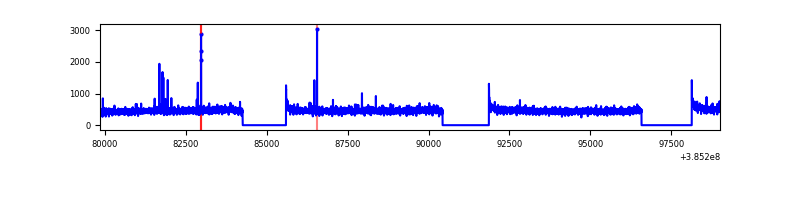 |
| B | 19162 | 14836 | 761 | 761 | 3.97% | 5.13% | 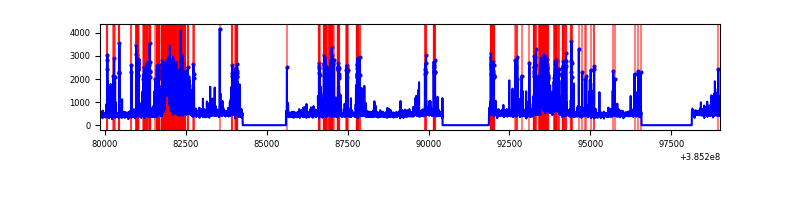 |
| C | 19162 | 14836 | 43 | 43 | 0.22% | 0.29% | 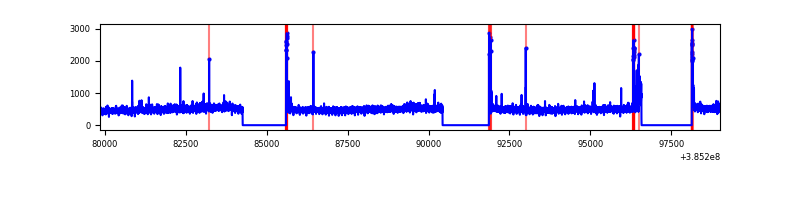 |
| D | 19162 | 14836 | 209 | 209 | 1.09% | 1.41% | 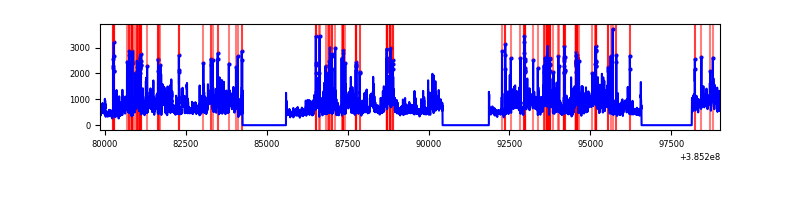 |
Top three noisy pixels from each quadrant. If the there are fewer than three noisy pixels in the level2.evt file, extra rows are filled as -1
| Pixel properties | Quadrant properties | ||||||
|---|---|---|---|---|---|---|---|
| Quadrant | DetID | PixID | Counts | Sigma | Mean | Median | Sigma |
| A | 10 | 83 | 137961 | 396.57 | 1717 | 1675 | 343.7 |
| A | 9 | 143 | 45260 | 126.82 | 1717 | 1675 | 343.7 |
| A | 13 | 254 | 24150 | 65.4 | 1717 | 1675 | 343.7 |
| B | 5 | 172 | 2781618 | 8695.36 | 1662 | 1617 | 319.7 |
| B | 5 | 255 | 283475 | 881.6 | 1662 | 1617 | 319.7 |
| B | 0 | 190 | 208442 | 646.91 | 1662 | 1617 | 319.7 |
| C | 15 | 214 | 608228 | 1566.22 | 1675 | 1687 | 387.3 |
| C | 0 | 10 | 119491 | 304.2 | 1675 | 1687 | 387.3 |
| C | 14 | 67 | 102973 | 261.54 | 1675 | 1687 | 387.3 |
| D | 8 | 195 | 3312860 | 8202.06 | 1663 | 1616 | 403.7 |
| D | 13 | 249 | 430770 | 1063.03 | 1663 | 1616 | 403.7 |
| D | 2 | 249 | 341010 | 840.69 | 1663 | 1616 | 403.7 |
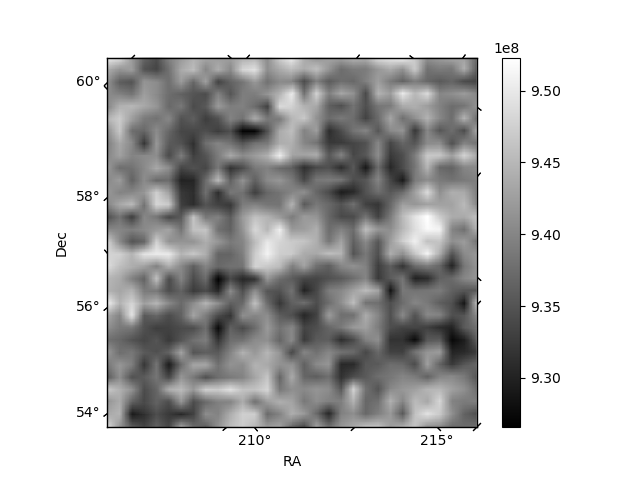
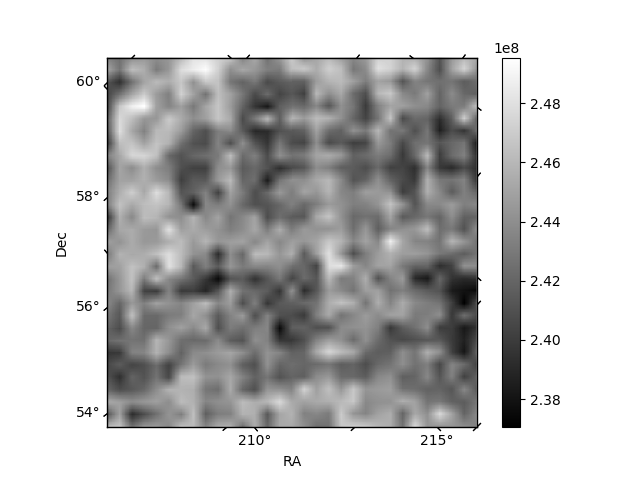
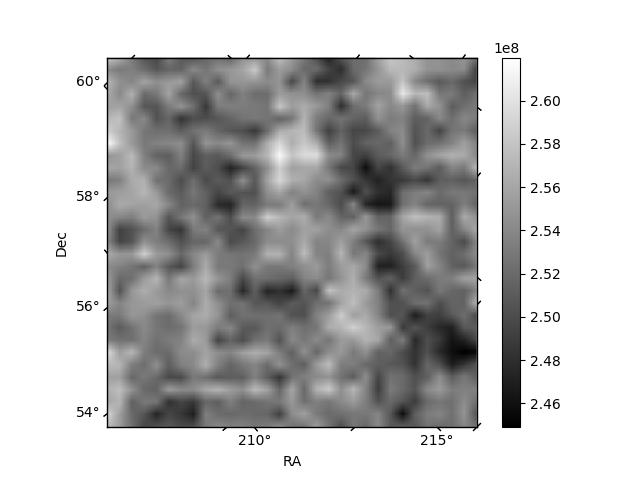
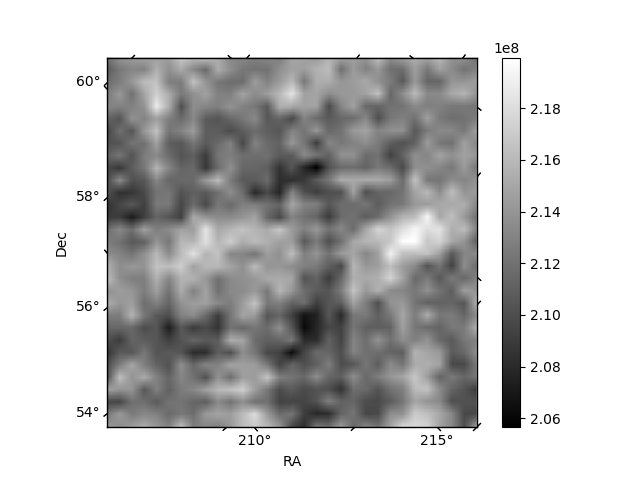
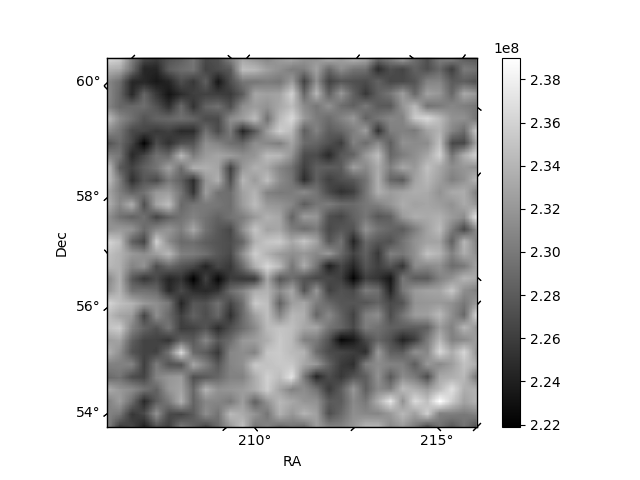
Histogram calculated using DETX and DETY for each event in the final _common_clean file
| Quadrant A | 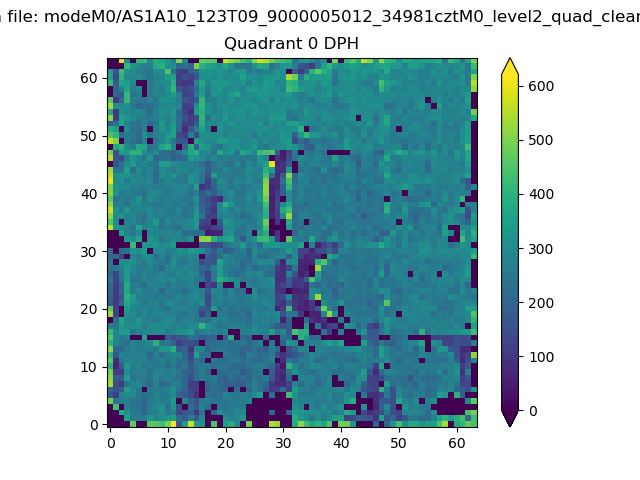 |
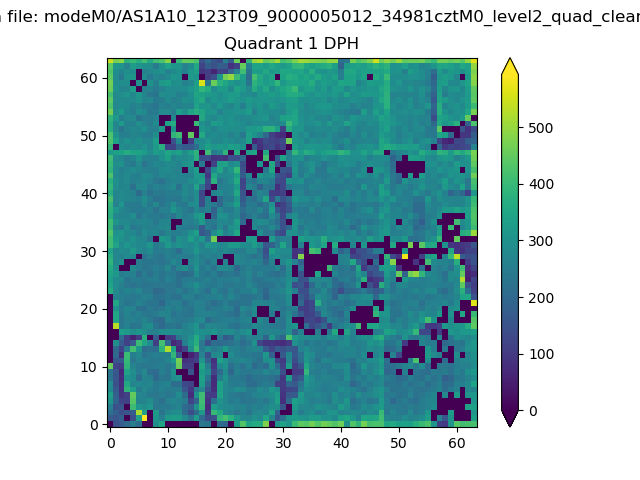 |
Quadrant B |
|---|---|---|---|
| Quadrant D |  |
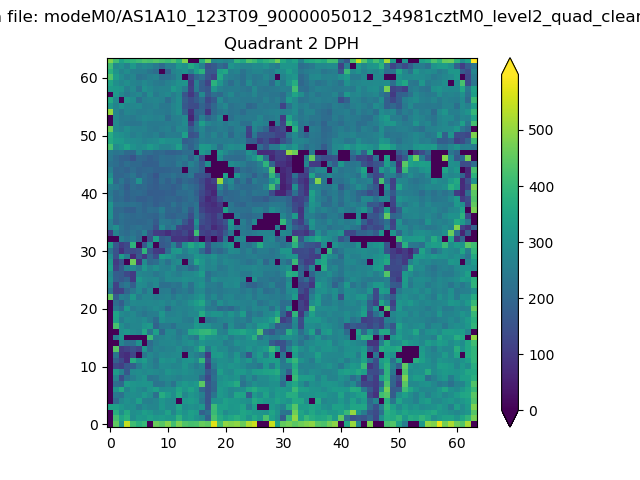 |
Quadrant C |
| Plot type | Count rate plots | Images |
|---|---|---|
| Comparison with Poisson distribution Blue bars denote a histogram of data divided into 1 sec bins. Red curve is a Poisson curve with rate = median count rate of data. |
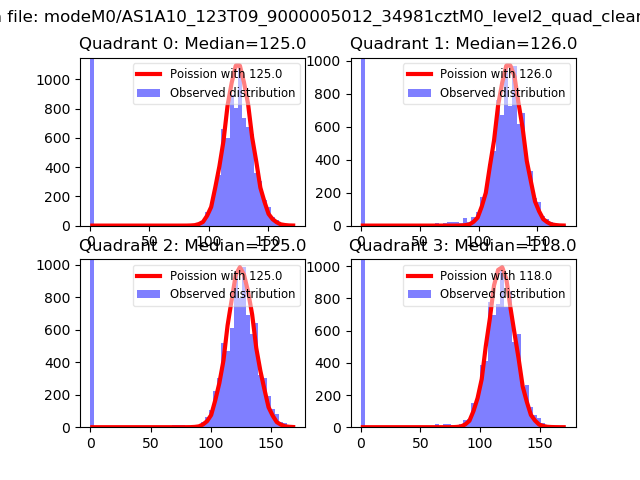 |
 |
| Quadrant-wise count rates Data is divided into 100 sec bins |
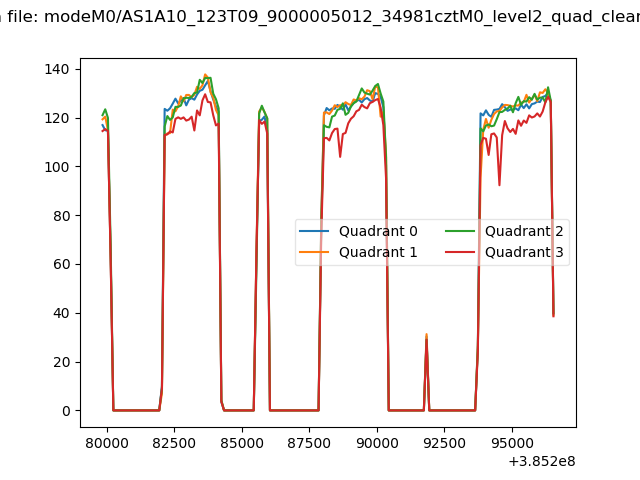 |
|
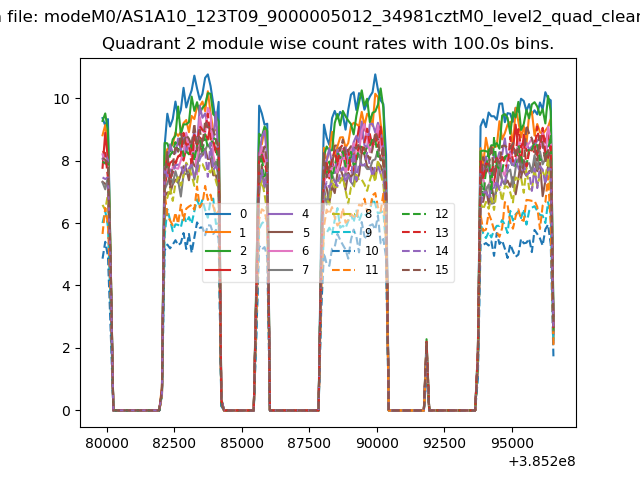
| Module-wise count rates for Quadrant A Data is divided into 100 sec bins |
 |
 |
| Module-wise count rates for Quadrant B Data is divided into 100 sec bins |
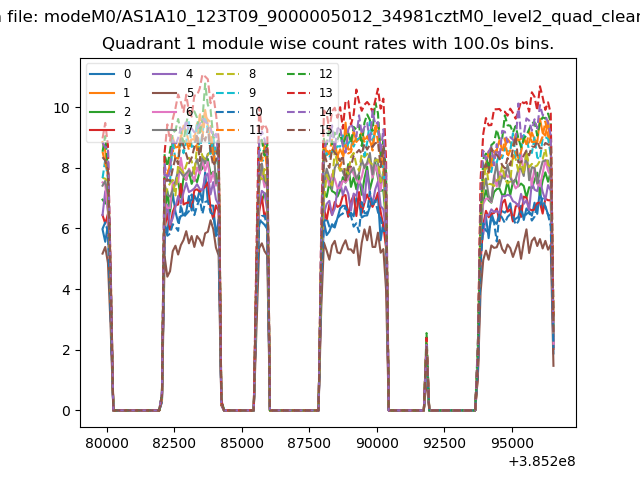 |
 |
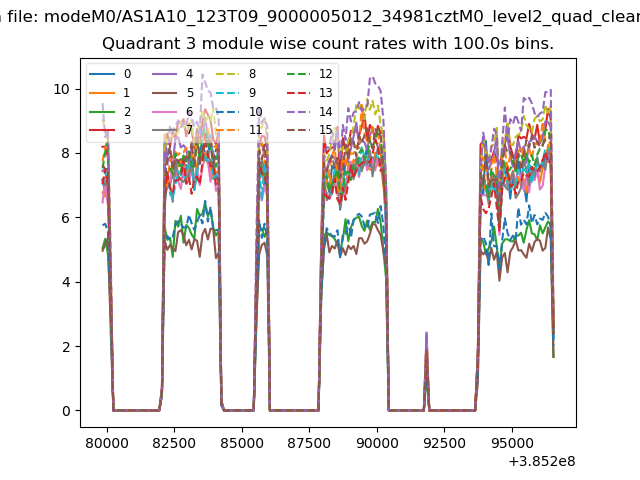
| Module-wise count rates for Quadrant C Data is divided into 100 sec bins |
 |
 |
| Module-wise count rates for Quadrant D Data is divided into 100 sec bins |
 |
 |
| Parameter | Plot |
|---|---|
| CZT HV Monitor | 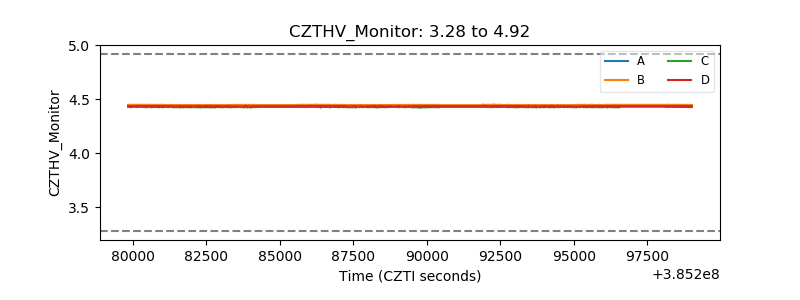 |
| D_VDD | 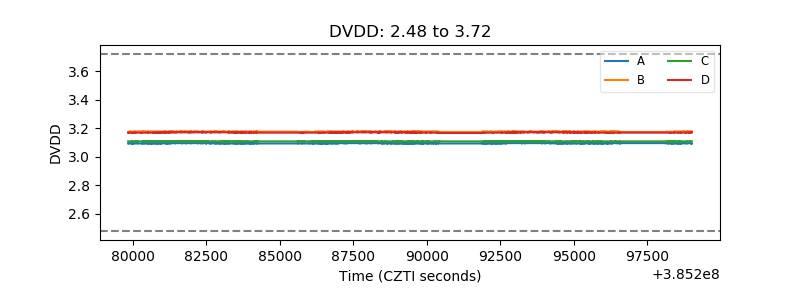 |
| Temperature 1 | 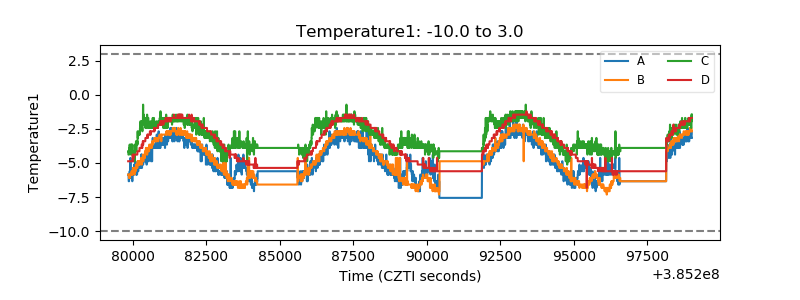 |
| Veto HV Monitor | 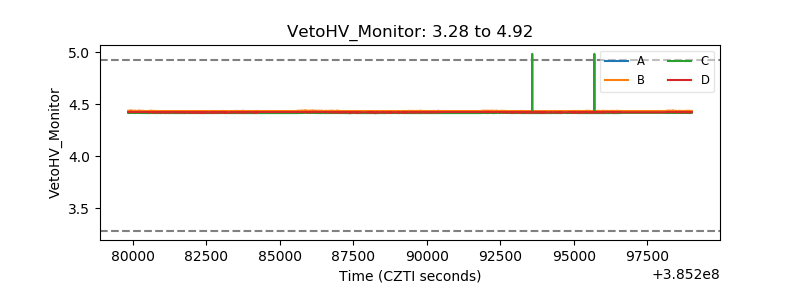 |
| Veto LLD | 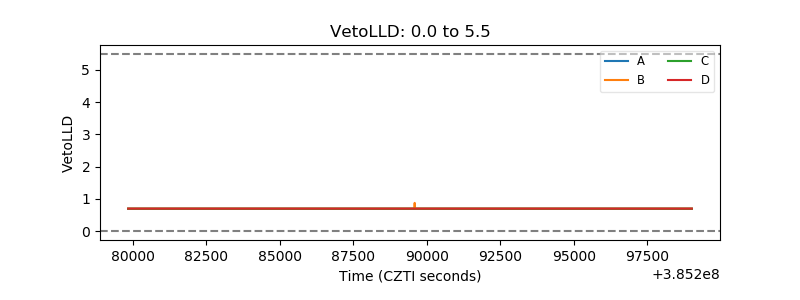 |
| Alpha Counter | 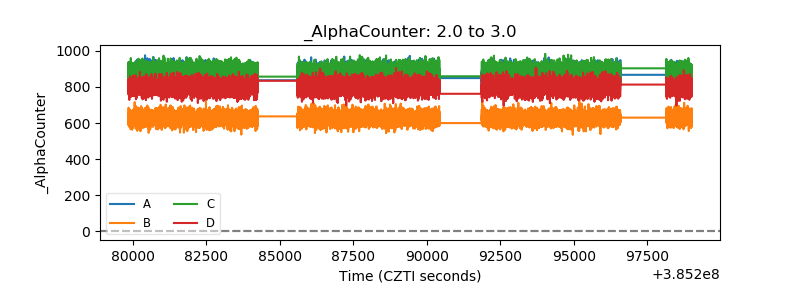 |
| _CPM_Rate | 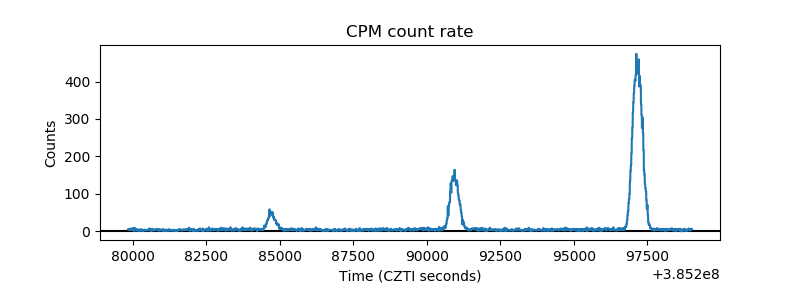 |
| CZT Counter | 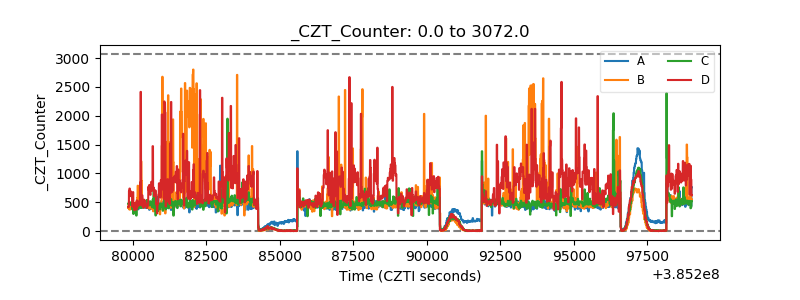 |
| +2.5 Volts monitor | 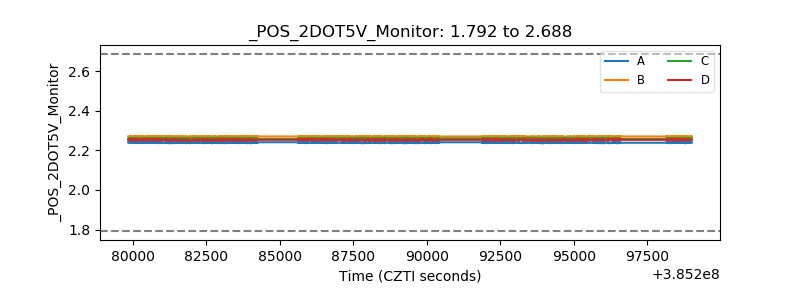 |
| +5 Volts monitor | 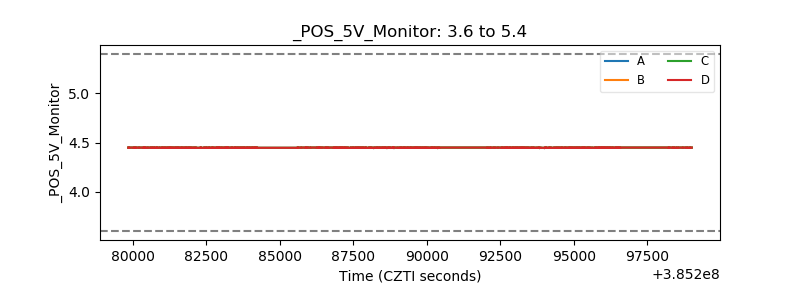 |
| _ROLL_ROT | 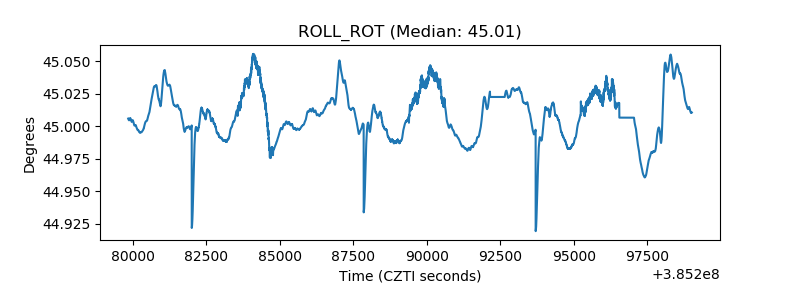 |
| _Roll_DEC | 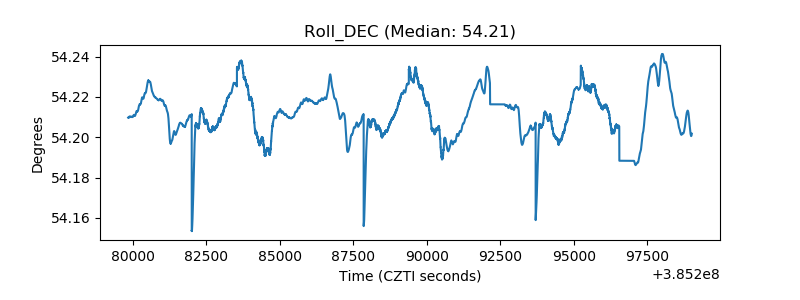 |
| _Roll_RA | 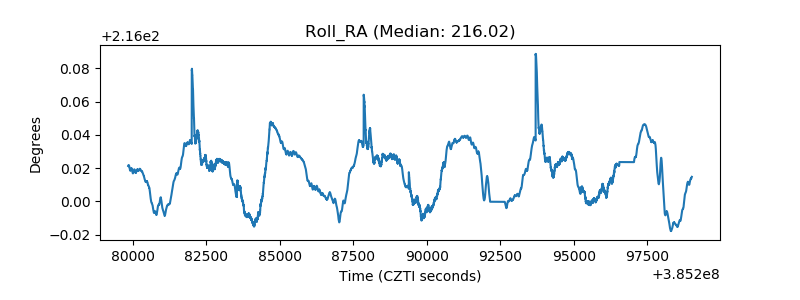 |
| Veto Counter | 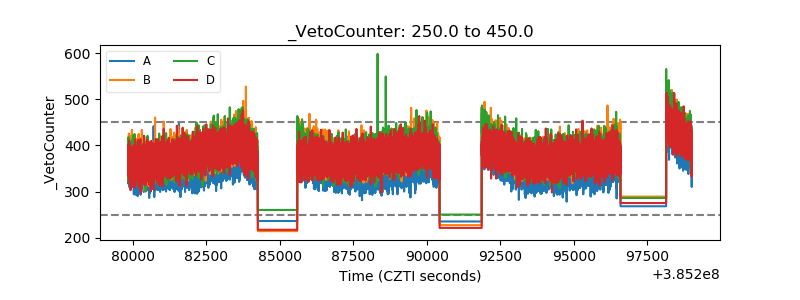 |