| Param | Original file | Final file |
|---|---|---|
| Filename | modeM0/AS1A10_123T09_9000005012_34980cztM0_level2.evt | modeM0/AS1A10_123T09_9000005012_34980cztM0_level2_quad_clean.evt |
| Size (bytes) | 111,165,120 | 17,919,360 |
| Size | 106.0 MB | 17.1 MB |
| Events in quadrant A | 688,372 | 106,066 |
| Events in quadrant B | 867,913 | 105,208 |
| Events in quadrant C | 773,183 | 109,875 |
| Events in quadrant D | 928,331 | 105,641 |
| Mode SS | |||
|---|---|---|---|
| Quadrant | BADHDUFLAG | Total packets | Discarded packets |
| A | 0 | 32 | 0 |
| B | 0 | 32 | 0 |
| C | 0 | 32 | 0 |
| D | 0 | 32 | 0 |
| Mode M0 | |||
|---|---|---|---|
| Quadrant | BADHDUFLAG | Total packets | Discarded packets |
| A | 0 | 3163 | 2 |
| B | 0 | 3699 | 1 |
| C | 0 | 3316 | 1 |
| D | 0 | 3891 | 1 |
| Mode M9 | |||
|---|---|---|---|
| Quadrant | BADHDUFLAG | Total packets | Discarded packets |
| A | 0 | 2 | 0 |
| B | 0 | 2 | 0 |
| C | 0 | 2 | 0 |
| D | 0 | 3 | 0 |
| Quadrant | Total seconds | Saturated seconds | Saturation percentage |
|---|---|---|---|
| A | 1556 | 1 | 0.064267% |
| B | 1556 | 62 | 3.984576% |
| C | 1556 | 17 | 1.092545% |
| D | 1556 | 20 | 1.285347% |
Noise dominated data is calculated using 1-second bins in cleaned event files. If a bin has >2000 counts, and if more than 50% of those come from <1% of pixels, then it is considered to be noise-dominated and hence unusable.
| Quadrant | # 1 sec bins | Bins with >0 counts | Bins with >2000 counts | High rate bins dominated by noise | Noise dominated (total time) | Noise dominated (detector-on time) | Marked lightcurve |
|---|---|---|---|---|---|---|---|
| A | 1556 | 1556 | 0 | 0 | 0.00% | 0.00% | 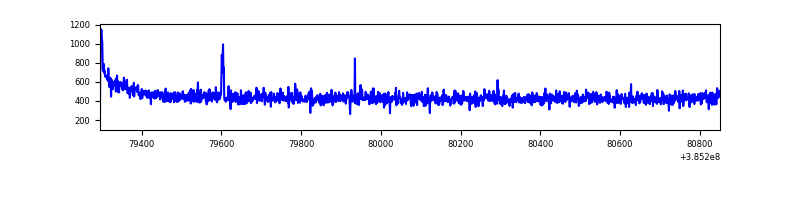 |
| B | 1556 | 1556 | 55 | 55 | 3.53% | 3.53% | 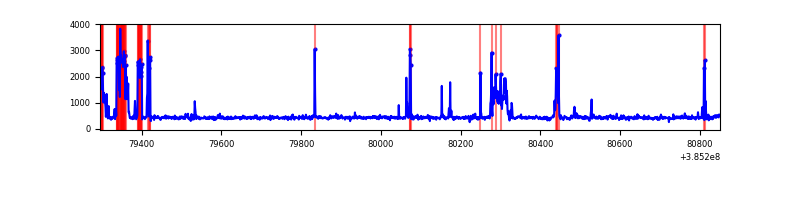 |
| C | 1556 | 1556 | 14 | 14 | 0.90% | 0.90% | 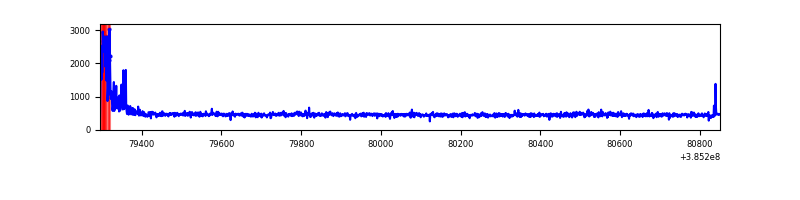 |
| D | 1555 | 1555 | 18 | 18 | 1.16% | 1.16% | 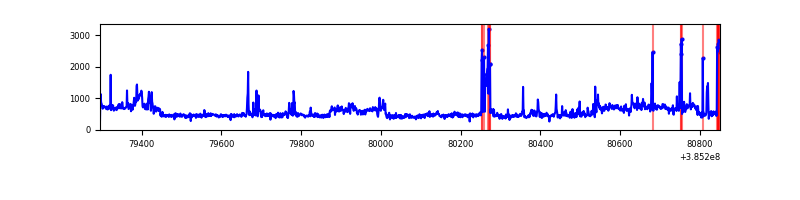 |
Top three noisy pixels from each quadrant. If the there are fewer than three noisy pixels in the level2.evt file, extra rows are filled as -1
| Pixel properties | Quadrant properties | ||||||
|---|---|---|---|---|---|---|---|
| Quadrant | DetID | PixID | Counts | Sigma | Mean | Median | Sigma |
| A | 10 | 83 | 30375 | 829.11 | 168 | 165 | 36.4 |
| A | 15 | 169 | 4626 | 122.43 | 168 | 165 | 36.4 |
| A | 13 | 254 | 2273 | 57.85 | 168 | 165 | 36.4 |
| B | 5 | 172 | 192830 | 5661.38 | 164 | 159 | 34.0 |
| B | 5 | 255 | 17975 | 523.5 | 164 | 159 | 34.0 |
| B | 0 | 190 | 7244 | 208.18 | 164 | 159 | 34.0 |
| C | 15 | 214 | 68130 | 1731.35 | 160 | 161 | 39.3 |
| C | 0 | 10 | 65523 | 1664.95 | 160 | 161 | 39.3 |
| C | 14 | 67 | 9904 | 248.18 | 160 | 161 | 39.3 |
| D | 8 | 195 | 197280 | 4757.06 | 161 | 156 | 41.4 |
| D | 2 | 249 | 62412 | 1502.38 | 161 | 156 | 41.4 |
| D | 2 | 207 | 21440 | 513.63 | 161 | 156 | 41.4 |
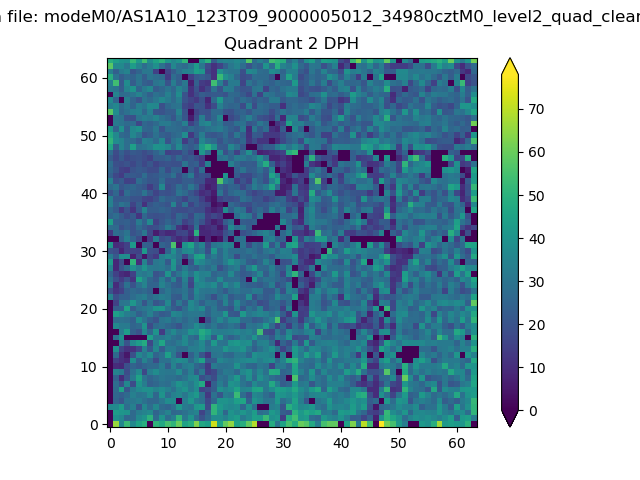
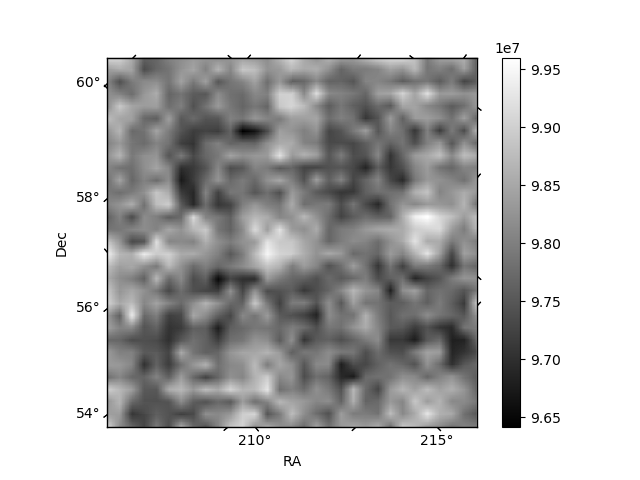
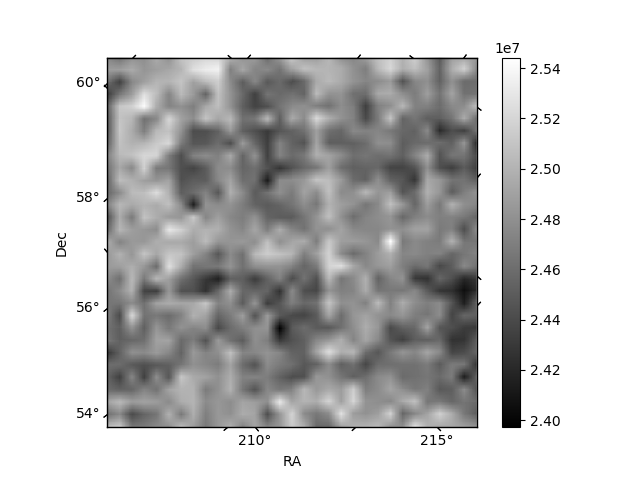
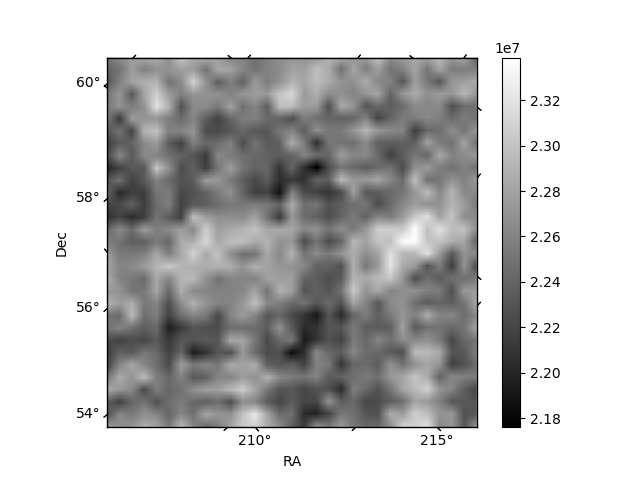
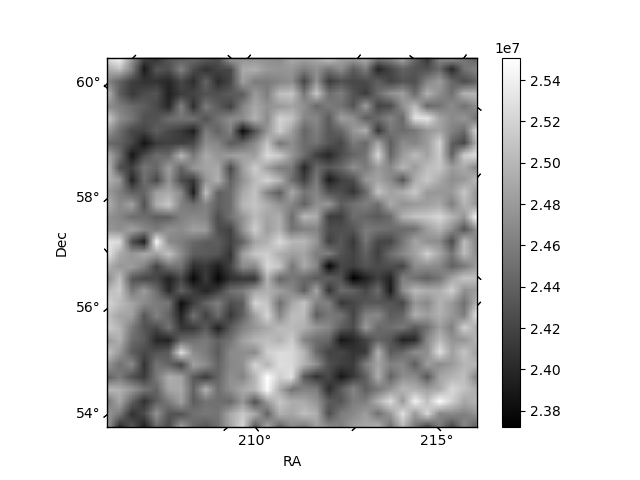
Histogram calculated using DETX and DETY for each event in the final _common_clean file
| Quadrant A | 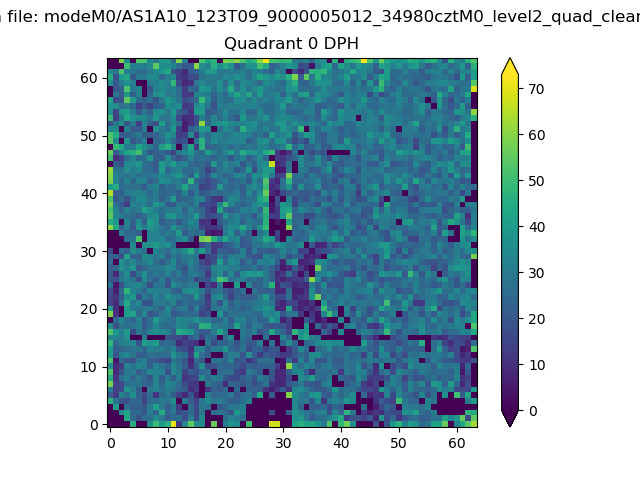 |
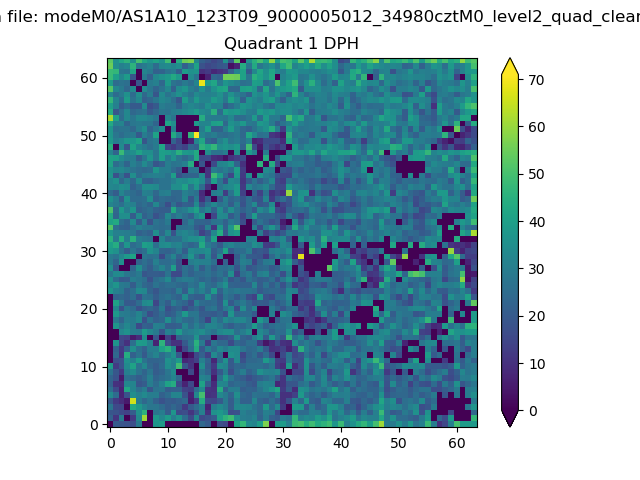 |
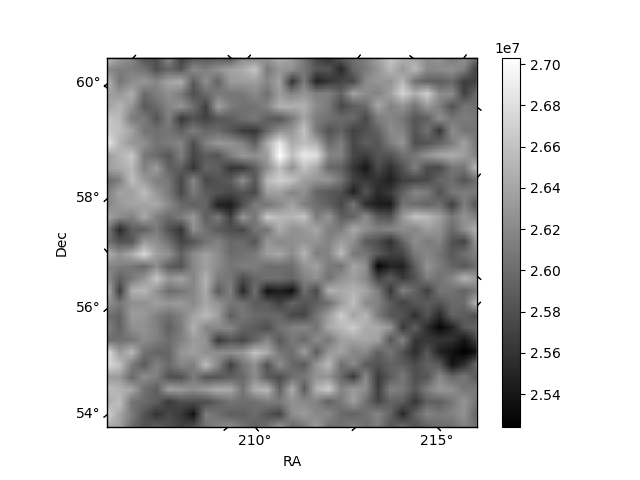
Quadrant B |
|---|---|---|---|
| Quadrant D | 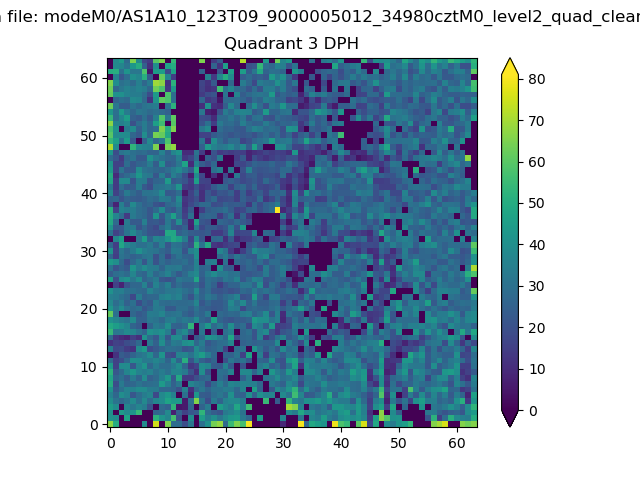 |
 |
Quadrant C |
| Plot type | Count rate plots | Images |
|---|---|---|
| Comparison with Poisson distribution Blue bars denote a histogram of data divided into 1 sec bins. Red curve is a Poisson curve with rate = median count rate of data. |
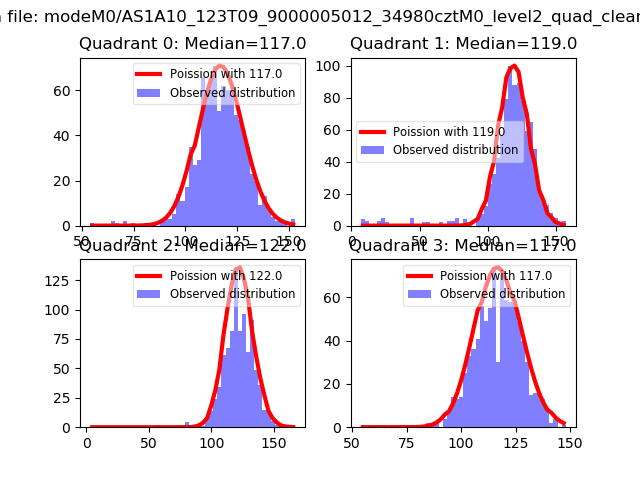 |
 |
| Quadrant-wise count rates Data is divided into 100 sec bins |
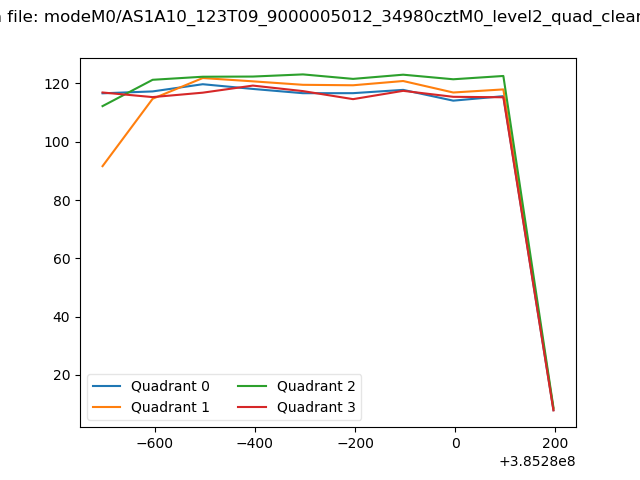 |
|
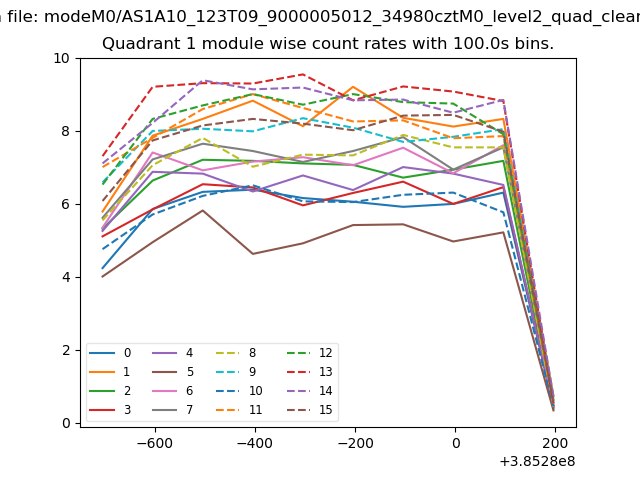
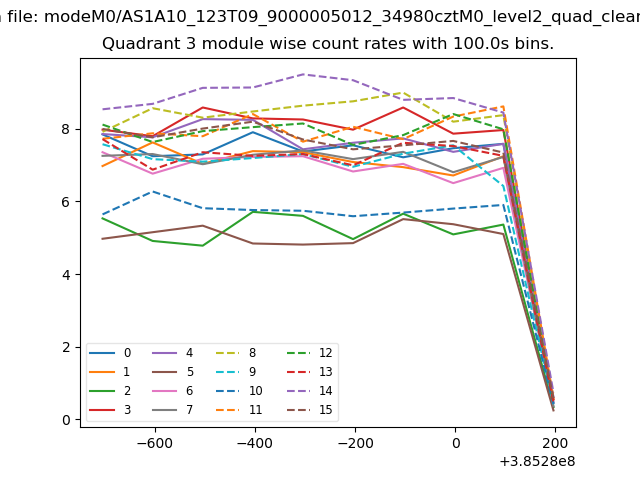
| Module-wise count rates for Quadrant A Data is divided into 100 sec bins |
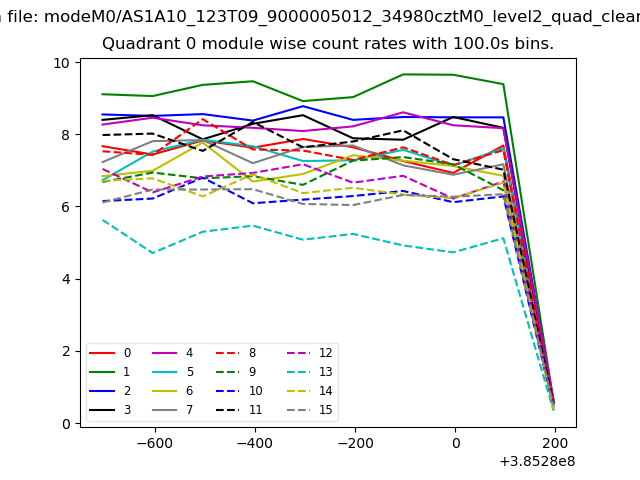 |
 |
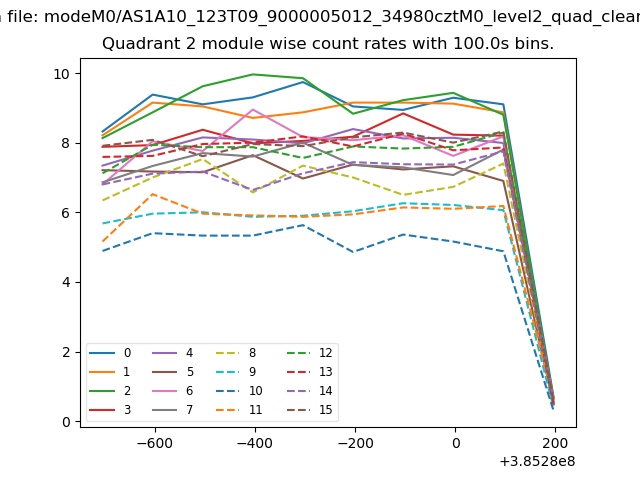
| Module-wise count rates for Quadrant B Data is divided into 100 sec bins |
 |
 |
| Module-wise count rates for Quadrant C Data is divided into 100 sec bins |
 |
 |
| Module-wise count rates for Quadrant D Data is divided into 100 sec bins |
 |
 |
| Parameter | Plot |
|---|---|
| CZT HV Monitor | 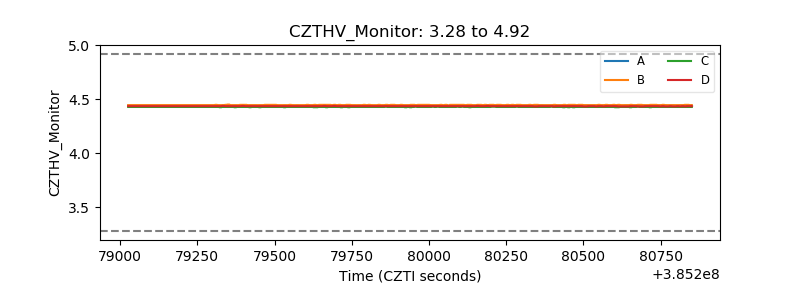 |
| D_VDD | 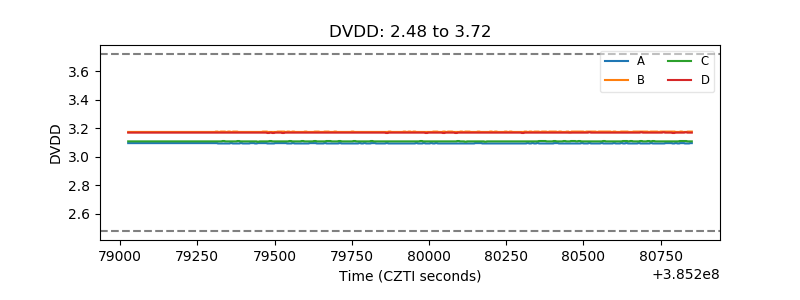 |
| Temperature 1 | 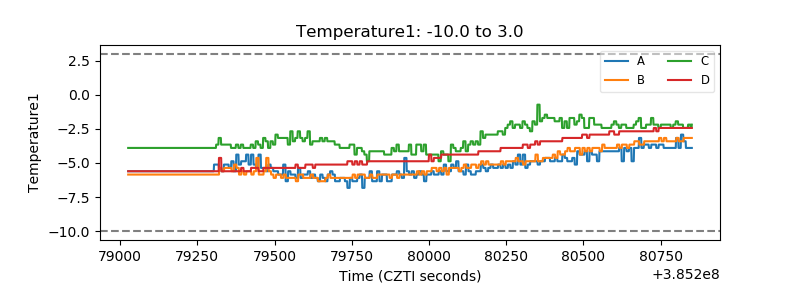 |
| Veto HV Monitor | 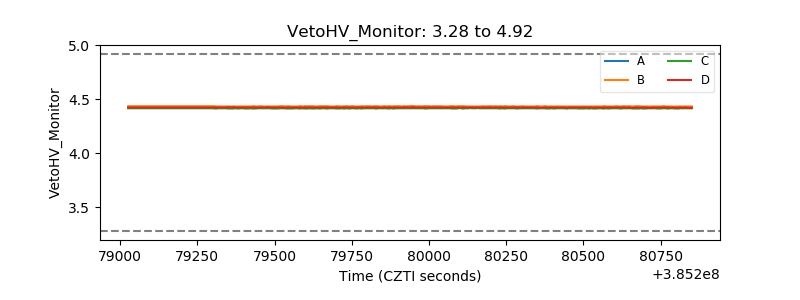 |
| Veto LLD | 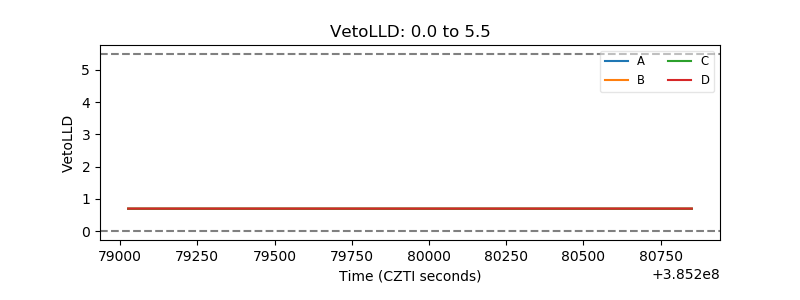 |
| Alpha Counter | 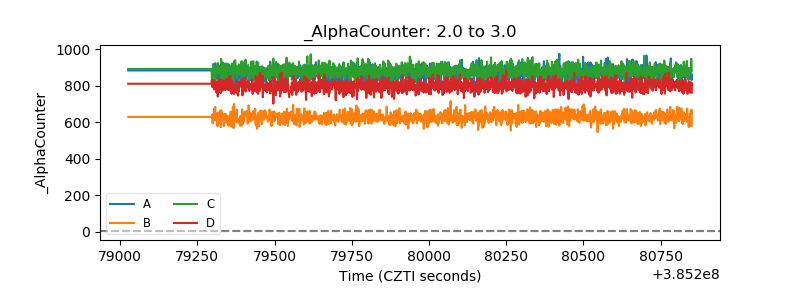 |
| _CPM_Rate | 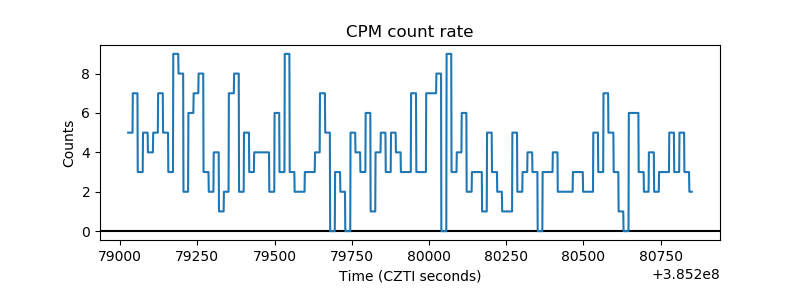 |
| CZT Counter | 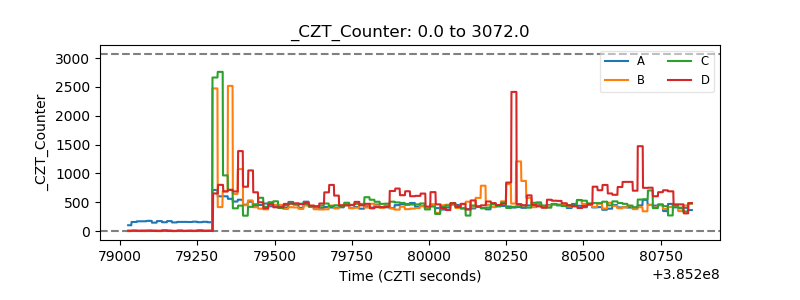 |
| +2.5 Volts monitor | 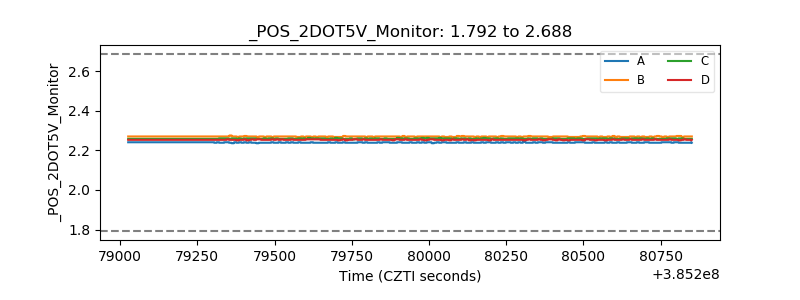 |
| +5 Volts monitor | 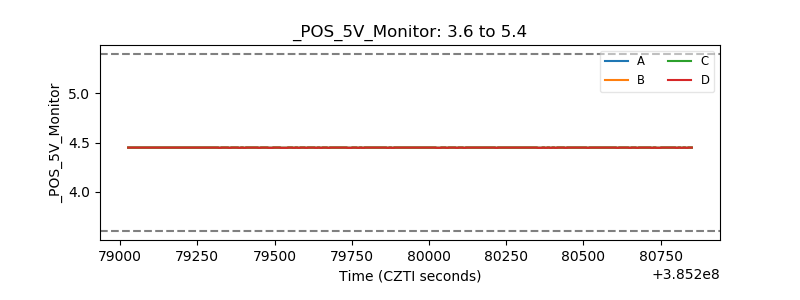 |
| _ROLL_ROT | 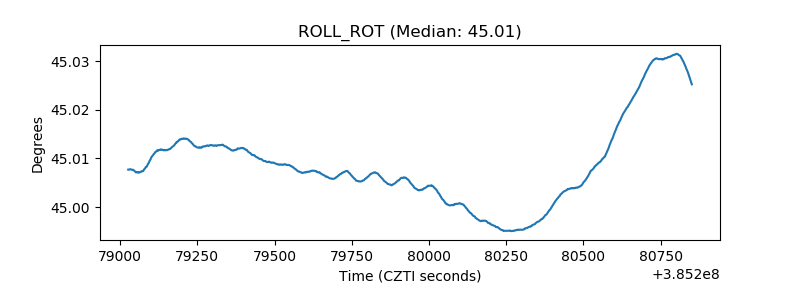 |
| _Roll_DEC | 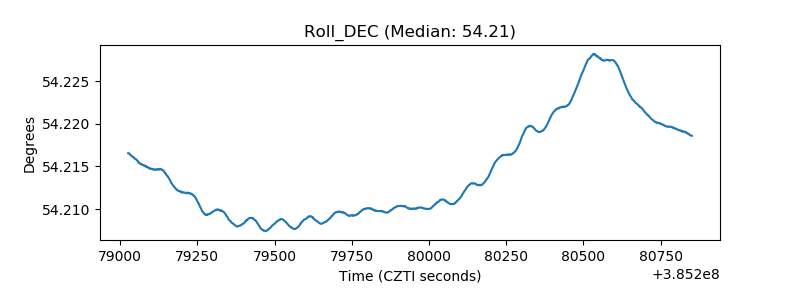 |
| _Roll_RA | 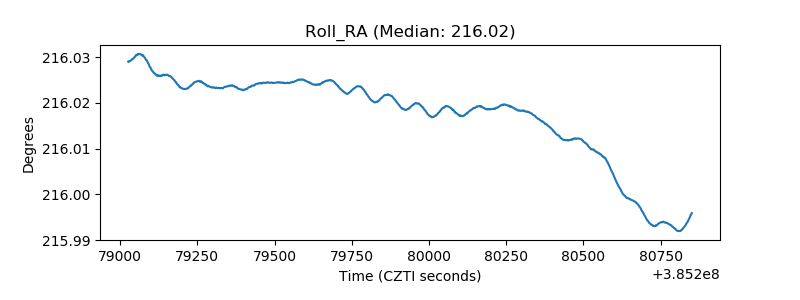 |
| Veto Counter | 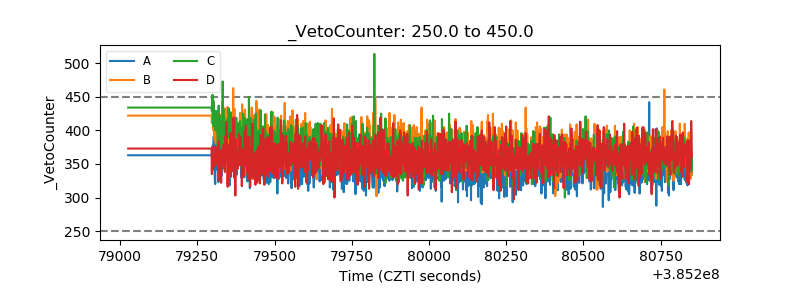 |