| Param | Original file | Final file |
|---|---|---|
| Filename | modeM0/AS1A10_123T09_9000005012_34977cztM0_level2.evt | modeM0/AS1A10_123T09_9000005012_34977cztM0_level2_quad_clean.evt |
| Size (bytes) | 510,638,400 | 75,153,600 |
| Size | 487.0 MB | 71.7 MB |
| Events in quadrant A | 2,749,284 | 476,507 |
| Events in quadrant B | 3,147,131 | 486,520 |
| Events in quadrant C | 3,002,967 | 485,445 |
| Events in quadrant D | 6,166,997 | 416,820 |
| Mode SS | |||
|---|---|---|---|
| Quadrant | BADHDUFLAG | Total packets | Discarded packets |
| A | 0 | 120 | 0 |
| B | 0 | 120 | 0 |
| C | 0 | 120 | 0 |
| D | 0 | 120 | 0 |
| Mode M0 | |||
|---|---|---|---|
| Quadrant | BADHDUFLAG | Total packets | Discarded packets |
| A | 0 | 12185 | 3 |
| B | 0 | 13351 | 2 |
| C | 0 | 12582 | 2 |
| D | 0 | 22425 | 2 |
| Mode M9 | |||
|---|---|---|---|
| Quadrant | BADHDUFLAG | Total packets | Discarded packets |
| A | 0 | 30 | 0 |
| B | 0 | 30 | 0 |
| C | 0 | 30 | 0 |
| D | 0 | 30 | 0 |
| Quadrant | Total seconds | Saturated seconds | Saturation percentage |
|---|---|---|---|
| A | 5872 | 20 | 0.340599% |
| B | 5872 | 128 | 2.179837% |
| C | 5872 | 55 | 0.936649% |
| D | 5872 | 1039 | 17.694142% |
Noise dominated data is calculated using 1-second bins in cleaned event files. If a bin has >2000 counts, and if more than 50% of those come from <1% of pixels, then it is considered to be noise-dominated and hence unusable.
| Quadrant | # 1 sec bins | Bins with >0 counts | Bins with >2000 counts | High rate bins dominated by noise | Noise dominated (total time) | Noise dominated (detector-on time) | Marked lightcurve |
|---|---|---|---|---|---|---|---|
| A | 8828 | 5874 | 11 | 11 | 0.12% | 0.19% | 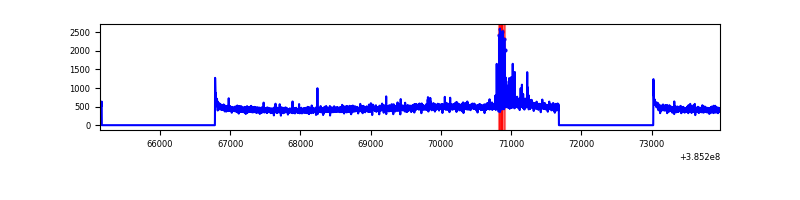 |
| B | 8828 | 5874 | 94 | 94 | 1.06% | 1.60% | 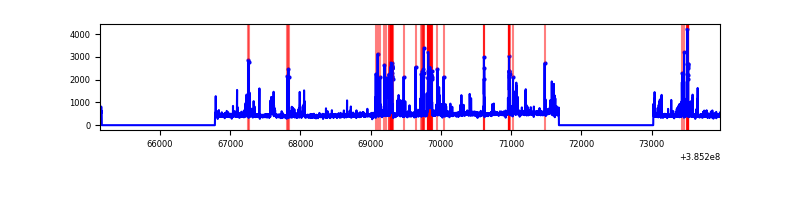 |
| C | 8828 | 5874 | 52 | 52 | 0.59% | 0.89% |  |
| D | 8828 | 5874 | 890 | 890 | 10.08% | 15.15% | 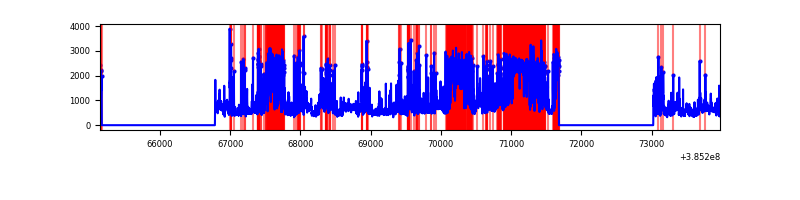 |
Top three noisy pixels from each quadrant. If the there are fewer than three noisy pixels in the level2.evt file, extra rows are filled as -1
| Pixel properties | Quadrant properties | ||||||
|---|---|---|---|---|---|---|---|
| Quadrant | DetID | PixID | Counts | Sigma | Mean | Median | Sigma |
| A | 15 | 223 | 84770 | 630.0 | 661 | 645 | 133.5 |
| A | 10 | 83 | 74239 | 551.13 | 661 | 645 | 133.5 |
| A | 13 | 6 | 22231 | 161.65 | 661 | 645 | 133.5 |
| B | 5 | 172 | 380503 | 3020.98 | 653 | 635 | 125.7 |
| B | 0 | 190 | 89951 | 710.3 | 653 | 635 | 125.7 |
| B | 4 | 232 | 42961 | 336.6 | 653 | 635 | 125.7 |
| C | 15 | 214 | 245948 | 1637.03 | 643 | 648 | 149.8 |
| C | 0 | 10 | 206654 | 1374.79 | 643 | 648 | 149.8 |
| C | 14 | 67 | 33717 | 220.69 | 643 | 648 | 149.8 |
| D | 2 | 249 | 1708745 | 11848.77 | 592 | 576 | 144.2 |
| D | 8 | 195 | 766932 | 5315.86 | 592 | 576 | 144.2 |
| D | 10 | 118 | 695786 | 4822.35 | 592 | 576 | 144.2 |
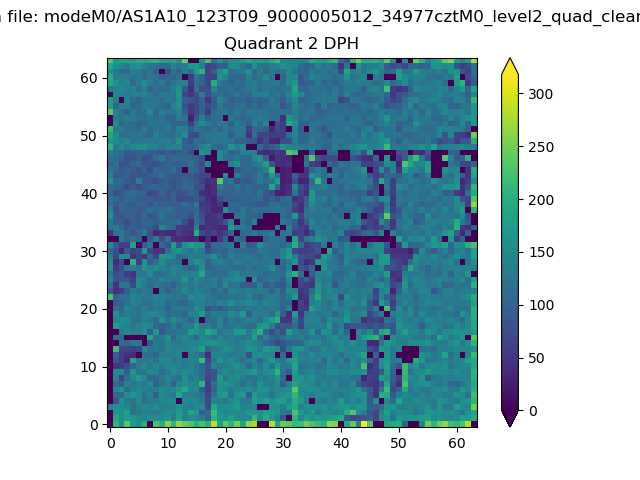
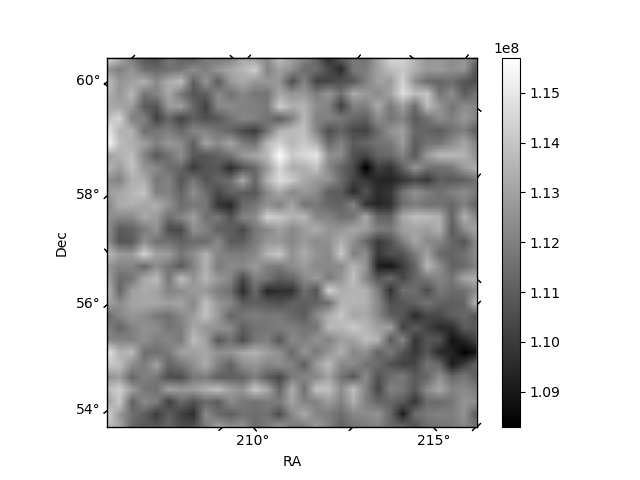
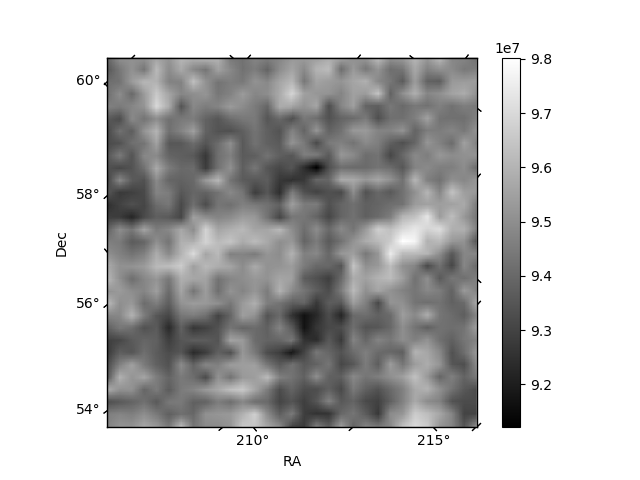
Histogram calculated using DETX and DETY for each event in the final _common_clean file
| Quadrant A | 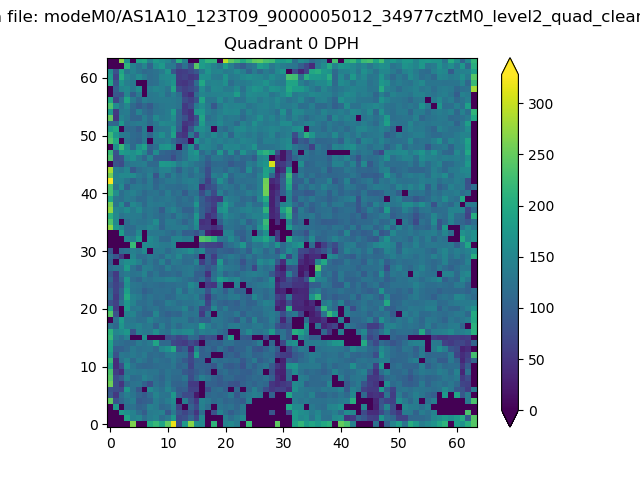 |
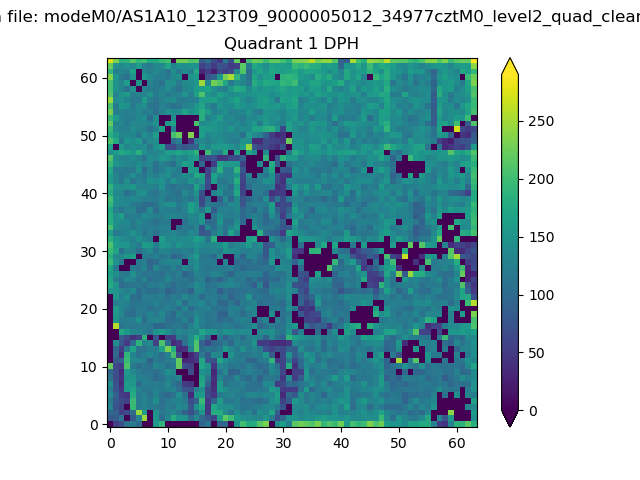 |
Quadrant B |
|---|---|---|---|
| Quadrant D | 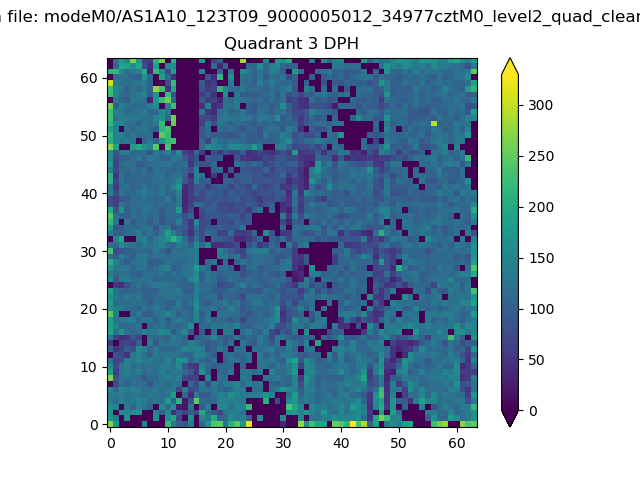 |
 |
Quadrant C |
| Plot type | Count rate plots | Images |
|---|---|---|
| Comparison with Poisson distribution Blue bars denote a histogram of data divided into 1 sec bins. Red curve is a Poisson curve with rate = median count rate of data. |
 |
 |
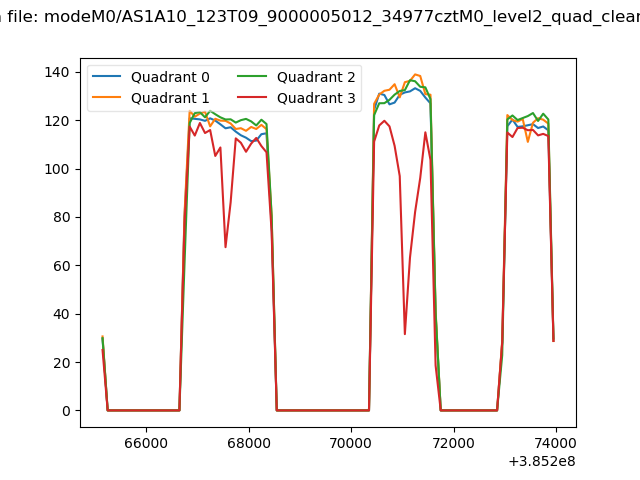
| Quadrant-wise count rates Data is divided into 100 sec bins |
 |
|
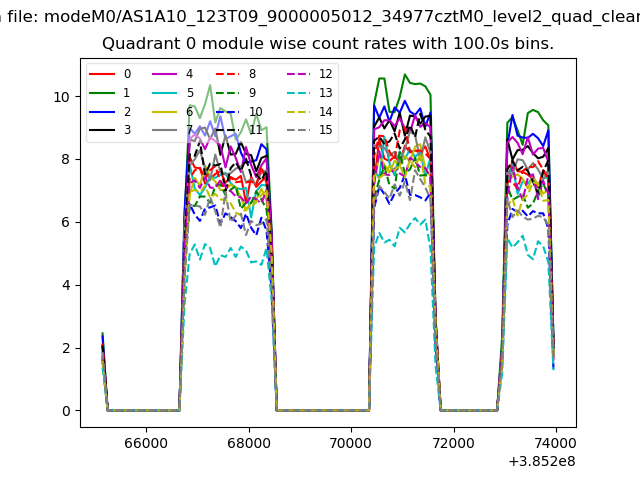
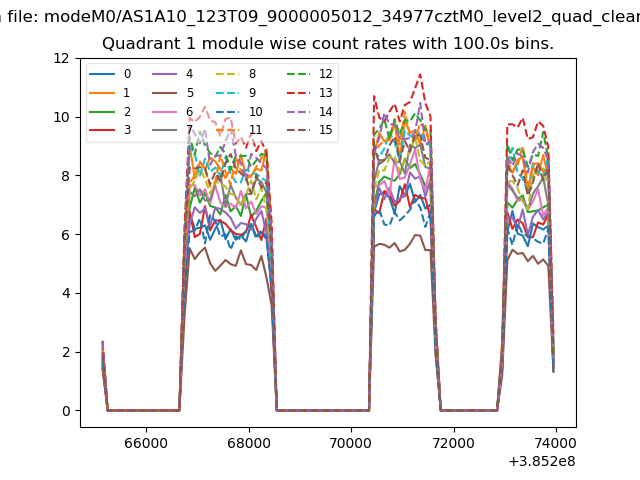
| Module-wise count rates for Quadrant A Data is divided into 100 sec bins |
 |
 |
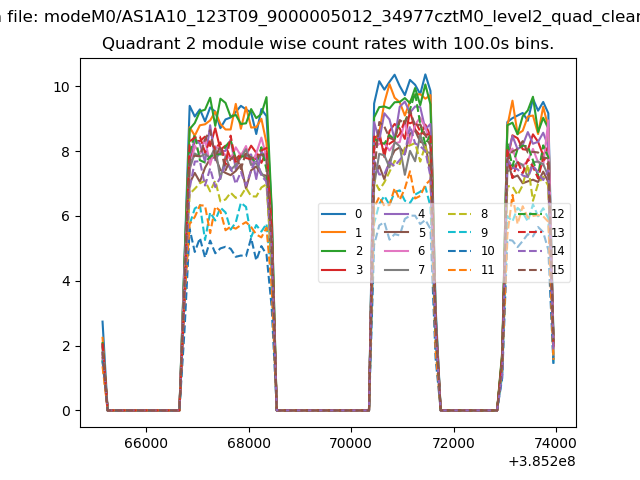
| Module-wise count rates for Quadrant B Data is divided into 100 sec bins |
 |
 |
| Module-wise count rates for Quadrant C Data is divided into 100 sec bins |
 |
 |
| Module-wise count rates for Quadrant D Data is divided into 100 sec bins |
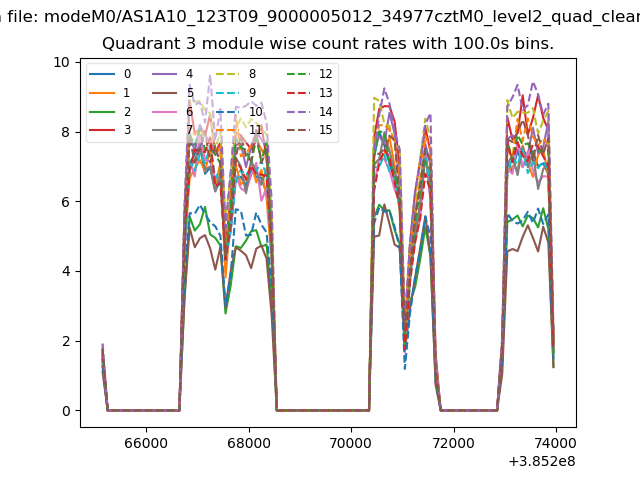 |
 |
| Parameter | Plot |
|---|---|
| CZT HV Monitor | 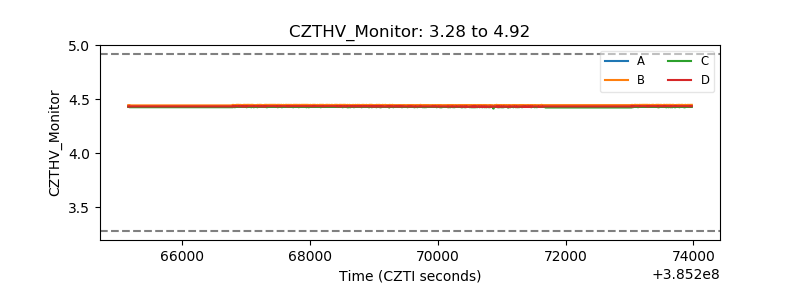 |
| D_VDD | 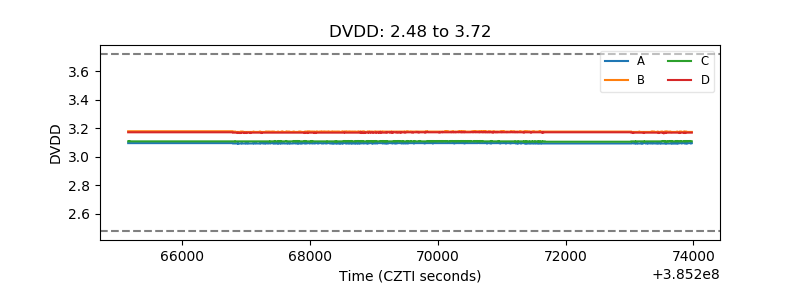 |
| Temperature 1 | 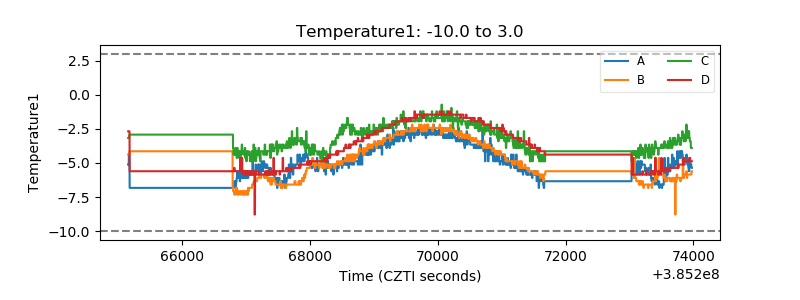 |
| Veto HV Monitor | 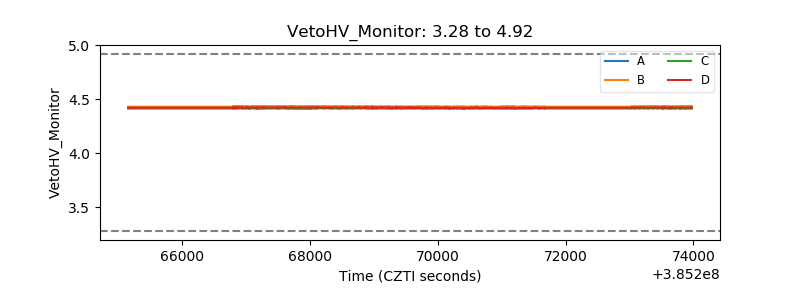 |
| Veto LLD | 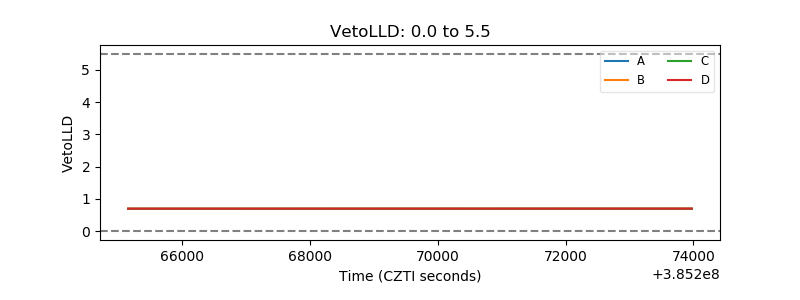 |
| Alpha Counter |  |
| _CPM_Rate | 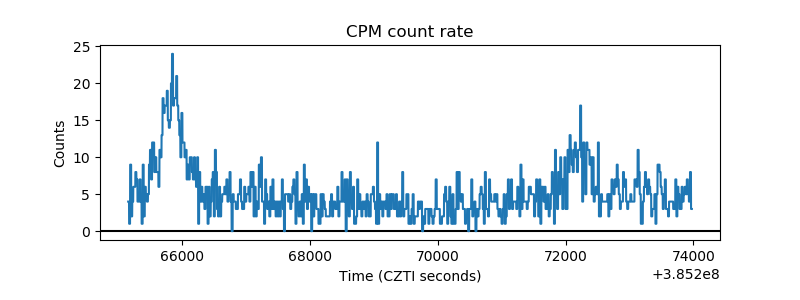 |
| CZT Counter | 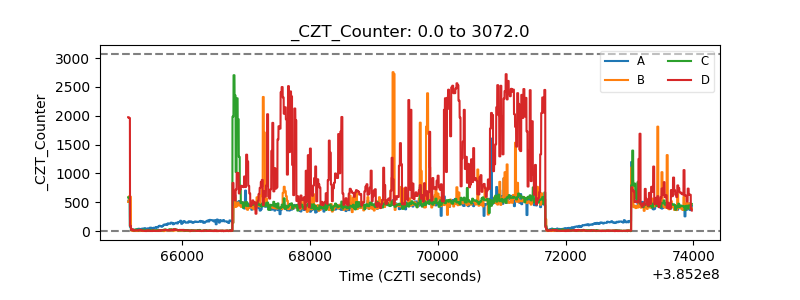 |
| +2.5 Volts monitor | 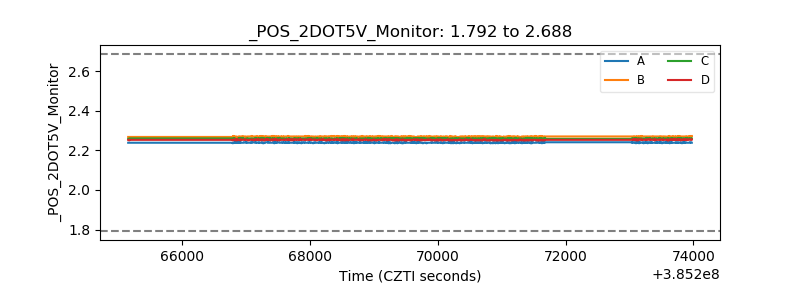 |
| +5 Volts monitor | 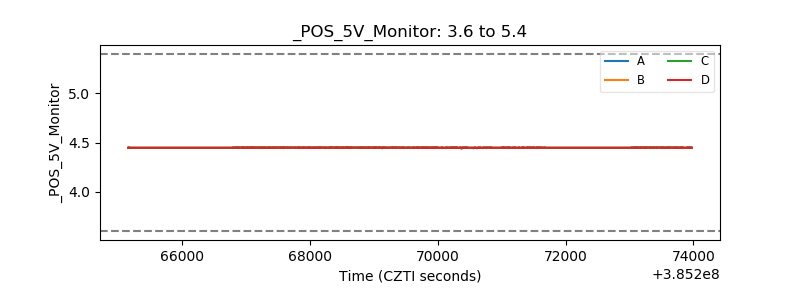 |
| _ROLL_ROT | 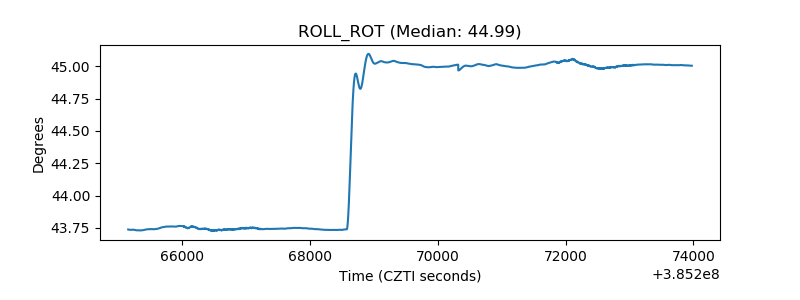 |
| _Roll_DEC | 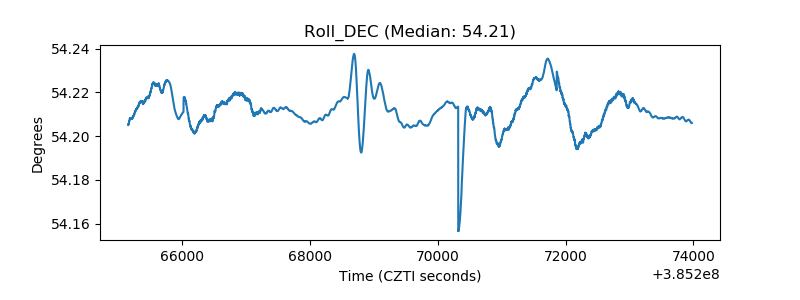 |
| _Roll_RA | 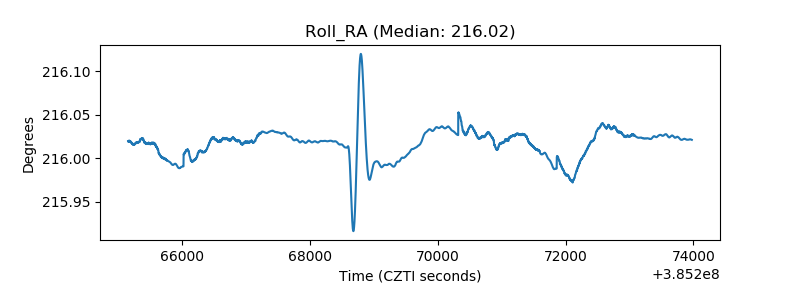 |
| Veto Counter | 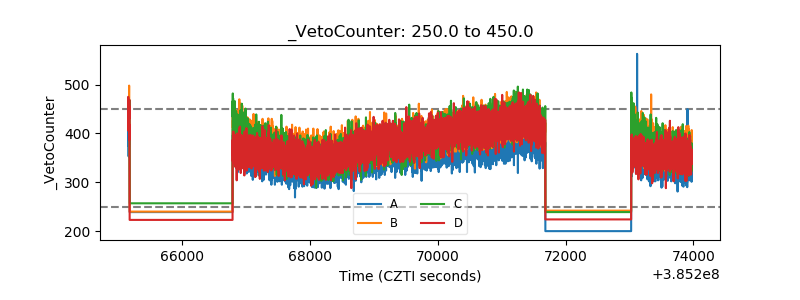 |