| Param | Original file | Final file |
|---|---|---|
| Filename | modeM0/AS1A10_123T09_9000005012cztM0_level2_bc.evt | modeM0/AS1A10_123T09_9000005012cztM0_level2_quad_clean.evt |
| Size (bytes) | 2,125,661,760 | 571,939,200 |
| Size | 2.0 GB | 545.4 MB |
| Events in quadrant A | 9,786,737 | 3,582,778 |
| Events in quadrant B | 13,991,423 | 3,602,040 |
| Events in quadrant C | 11,943,129 | 3,616,313 |
| Events in quadrant D | 25,487,714 | 3,328,501 |
| Mode SS | |||
|---|---|---|---|
| Quadrant | BADHDUFLAG | Total packets | Discarded packets |
| A | 0 | 950 | 0 |
| B | 0 | 950 | 0 |
| C | 0 | 950 | 0 |
| D | 0 | 950 | 0 |
| Mode M0 | |||
|---|---|---|---|
| Quadrant | BADHDUFLAG | Total packets | Discarded packets |
| A | 0 | 95259 | 0 |
| B | 0 | 113545 | 0 |
| C | 0 | 97764 | 0 |
| D | 0 | 149438 | 0 |
| Mode M9 | |||
|---|---|---|---|
| Quadrant | BADHDUFLAG | Total packets | Discarded packets |
| A | 0 | 161 | 0 |
| B | 0 | 161 | 0 |
| C | 0 | 161 | 0 |
| D | 0 | 161 | 0 |
| Quadrant | Total seconds | Saturated seconds | Saturation percentage |
|---|---|---|---|
| A | 46530 | 74 | 0.159037% |
| B | 46530 | 1857 | 3.990974% |
| C | 46530 | 241 | 0.517945% |
| D | 46530 | 2412 | 5.183752% |
Noise dominated data is calculated using 1-second bins in cleaned event files. If a bin has >2000 counts, and if more than 50% of those come from <1% of pixels, then it is considered to be noise-dominated and hence unusable.
| Quadrant | # 1 sec bins | Bins with >0 counts | Bins with >2000 counts | High rate bins dominated by noise | Noise dominated (total time) | Noise dominated (detector-on time) | Marked lightcurve |
|---|---|---|---|---|---|---|---|
| A | 62599 | 46539 | 1 | 1 | 0.00% | 0.00% | 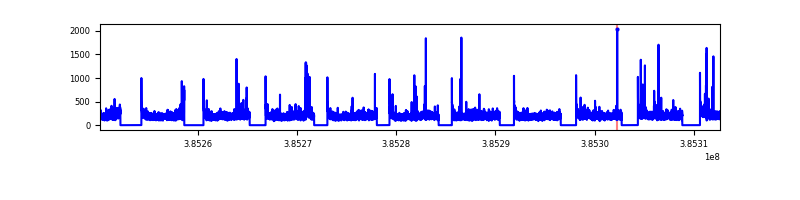 |
| B | 62599 | 46530 | 80 | 80 | 0.13% | 0.17% | 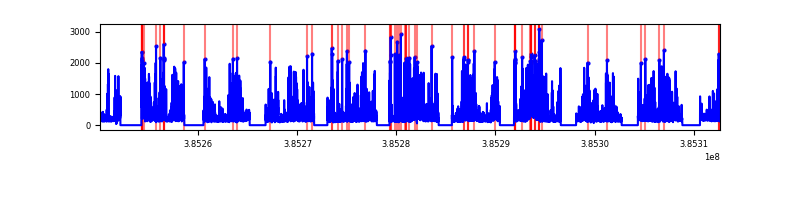 |
| C | 62599 | 46533 | 47 | 47 | 0.08% | 0.10% | 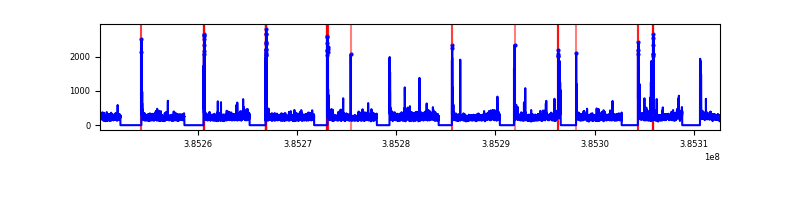 |
| D | 62599 | 46530 | 200 | 200 | 0.32% | 0.43% | 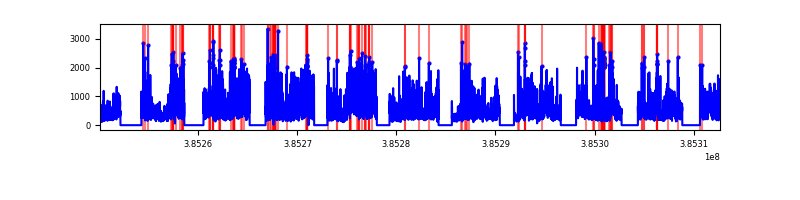 |
Top three noisy pixels from each quadrant. If the there are fewer than three noisy pixels in the level2.evt file, extra rows are filled as -1
| Pixel properties | Quadrant properties | ||||||
|---|---|---|---|---|---|---|---|
| Quadrant | DetID | PixID | Counts | Sigma | Mean | Median | Sigma |
| A | 10 | 83 | 425653 | 821.62 | 2331 | 2291 | 515.3 |
| A | 13 | 6 | 113846 | 216.49 | 2331 | 2291 | 515.3 |
| A | 9 | 143 | 94504 | 178.96 | 2331 | 2291 | 515.3 |
| B | 5 | 172 | 3293889 | 7128.52 | 2322 | 2266 | 461.8 |
| B | 3 | 112 | 451944 | 973.85 | 2322 | 2266 | 461.8 |
| B | 0 | 190 | 314597 | 676.4 | 2322 | 2266 | 461.8 |
| C | 15 | 214 | 1824228 | 3454.9 | 2306 | 2282 | 527.4 |
| C | 0 | 10 | 555486 | 1049.02 | 2306 | 2282 | 527.4 |
| C | 14 | 67 | 293693 | 552.59 | 2306 | 2282 | 527.4 |
| D | 8 | 195 | 9746063 | 18075.08 | 2261 | 2189 | 539.1 |
| D | 2 | 249 | 1889852 | 3501.65 | 2261 | 2189 | 539.1 |
| D | 13 | 249 | 1195408 | 2213.45 | 2261 | 2189 | 539.1 |
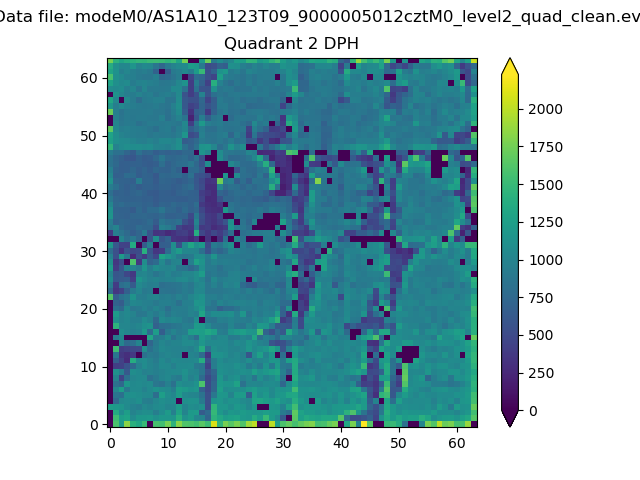
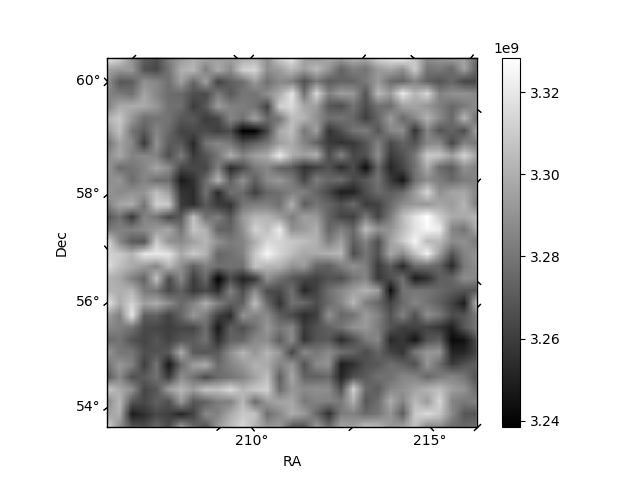
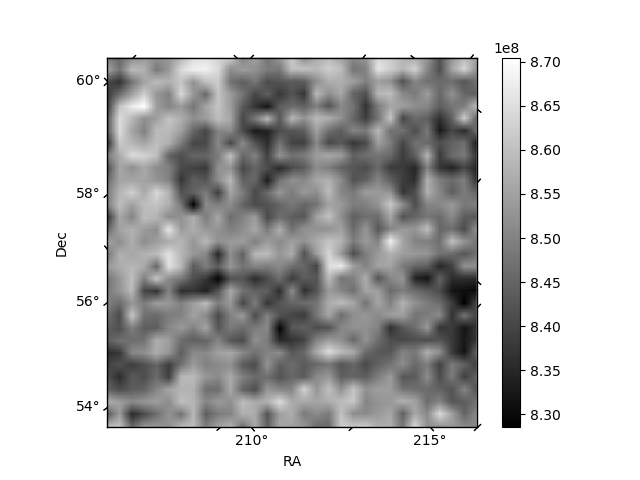
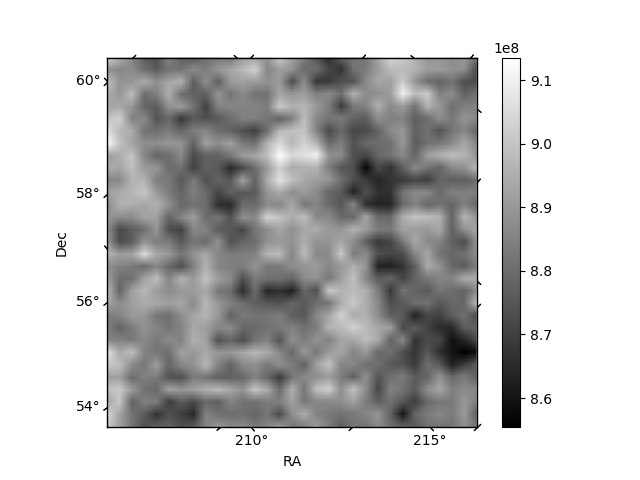
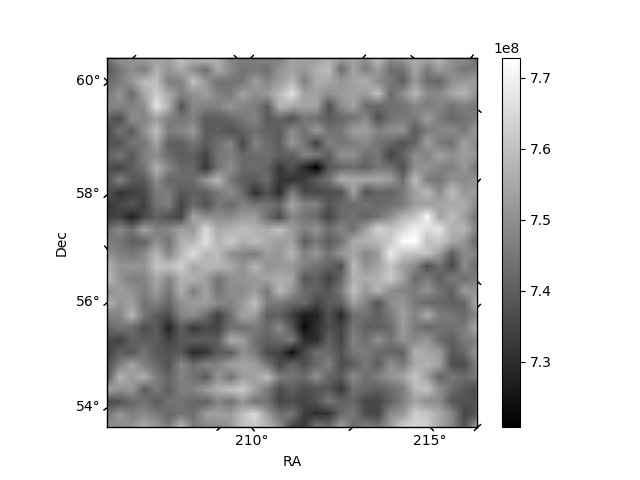
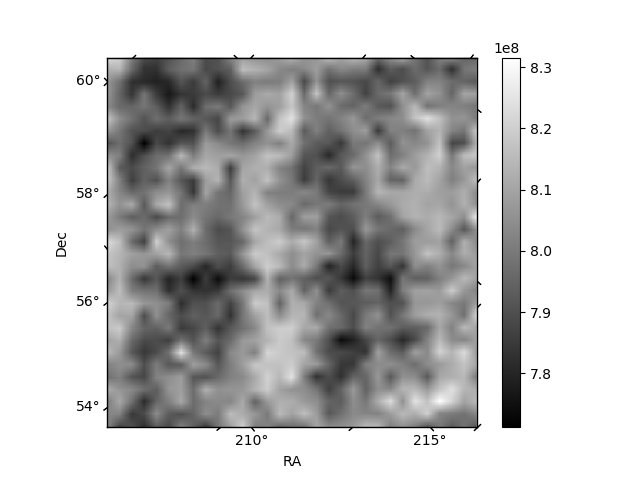
Histogram calculated using DETX and DETY for each event in the final _common_clean file
| Quadrant A | 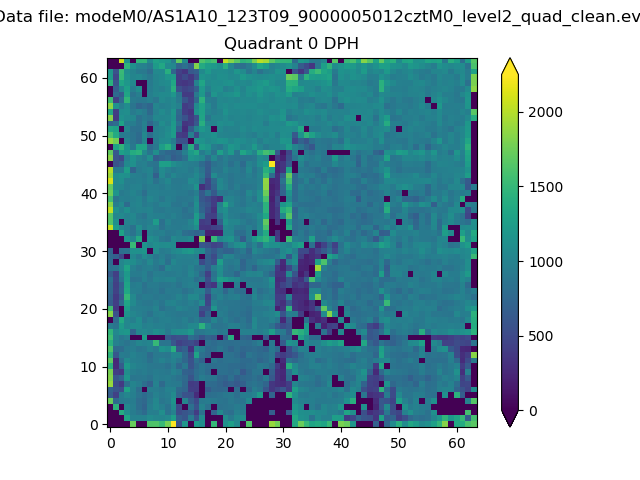 |
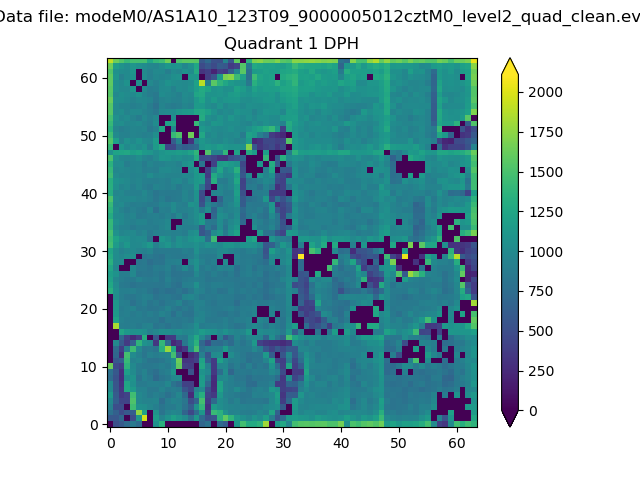 |
Quadrant B |
|---|---|---|---|
| Quadrant D | 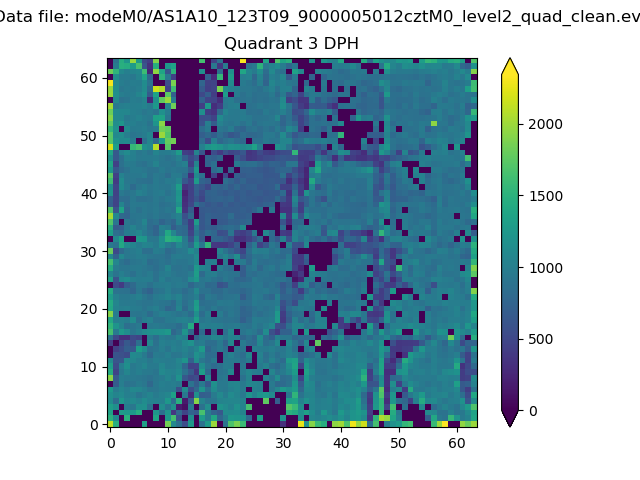 |
 |
Quadrant C |
| Plot type | Count rate plots | Images |
|---|---|---|
| Comparison with Poisson distribution Blue bars denote a histogram of data divided into 1 sec bins. Red curve is a Poisson curve with rate = median count rate of data. |
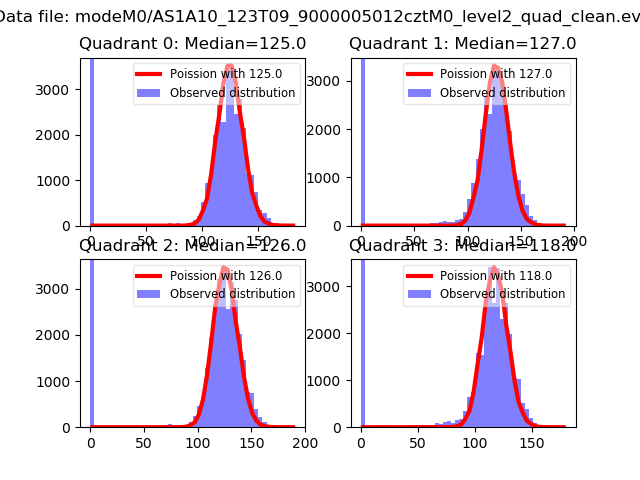 |
 |
| Quadrant-wise count rates Data is divided into 100 sec bins |
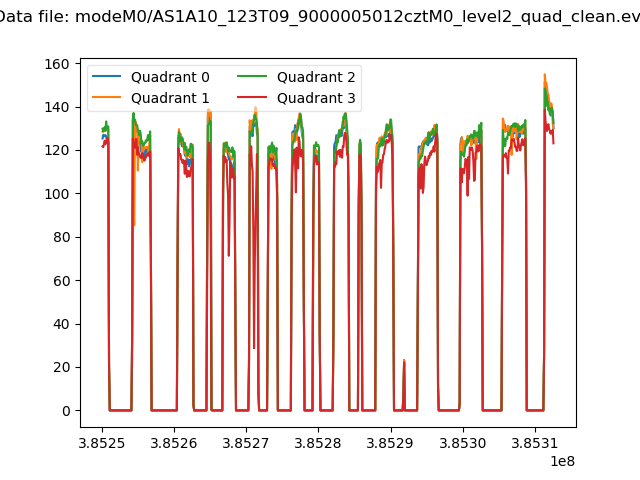 |
|
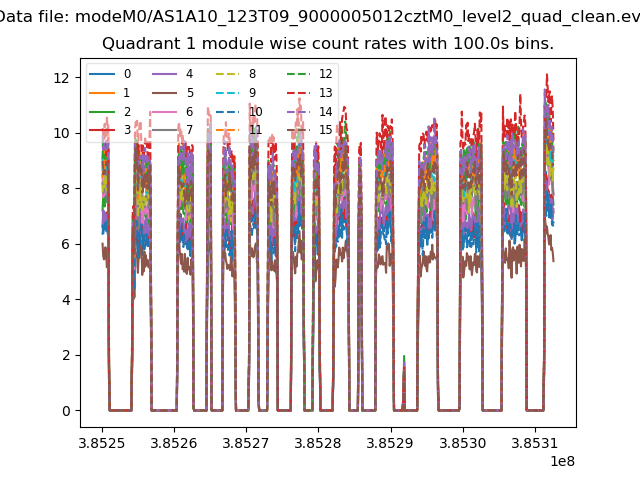
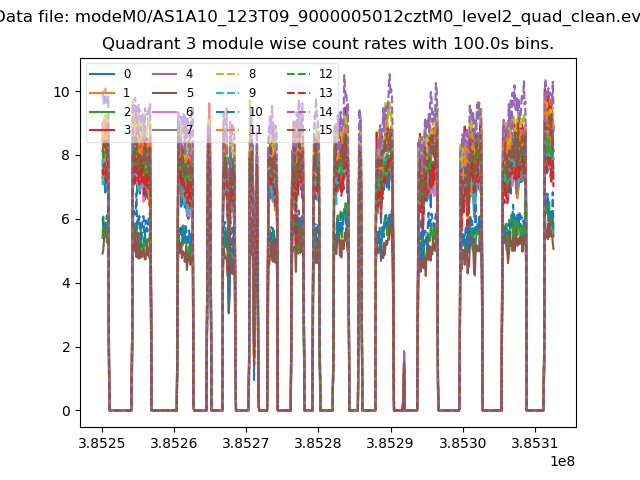
| Module-wise count rates for Quadrant A Data is divided into 100 sec bins |
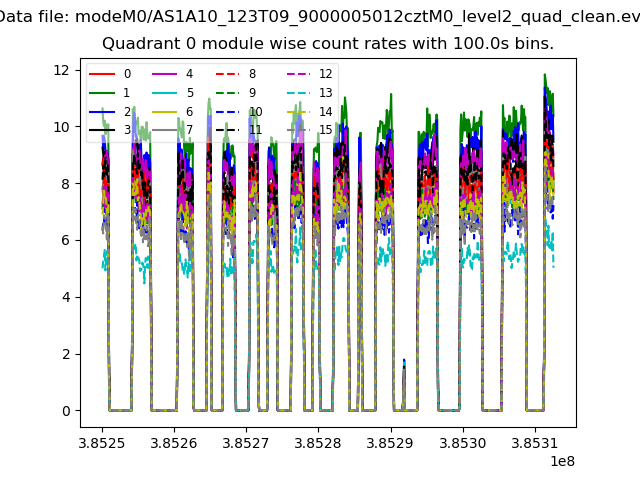 |
 |
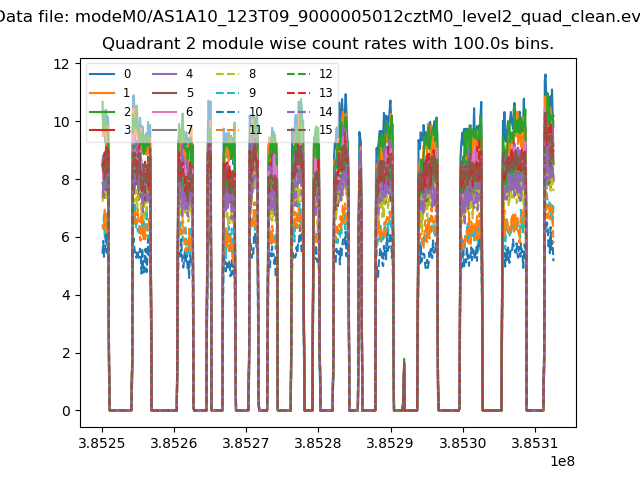
| Module-wise count rates for Quadrant B Data is divided into 100 sec bins |
 |
 |
| Module-wise count rates for Quadrant C Data is divided into 100 sec bins |
 |
 |
| Module-wise count rates for Quadrant D Data is divided into 100 sec bins |
 |
 |
| Parameter | Plot |
|---|---|
| CZT HV Monitor | 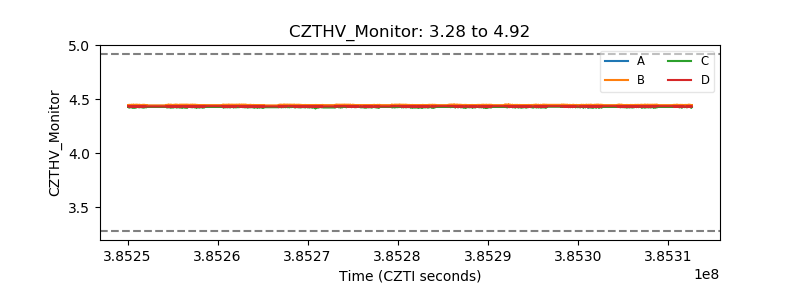 |
| D_VDD | 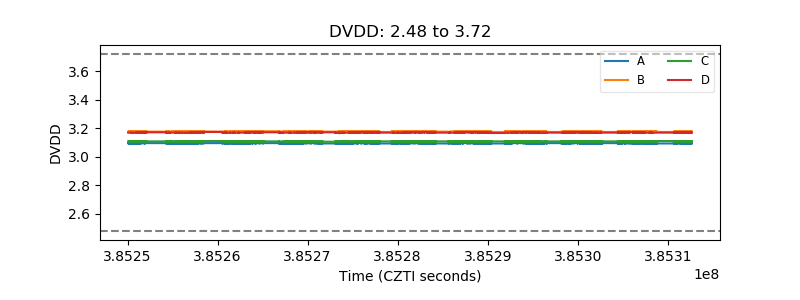 |
| Temperature 1 | 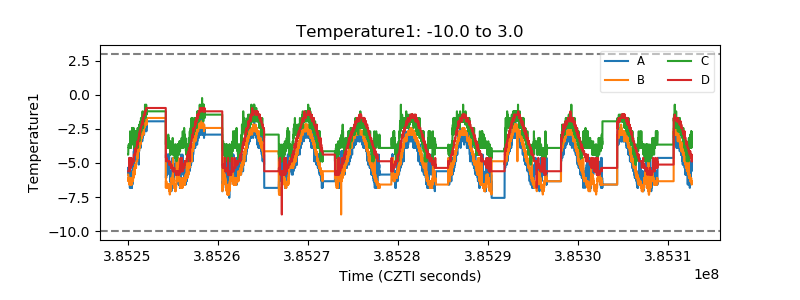 |
| Veto HV Monitor |  |
| Veto LLD | 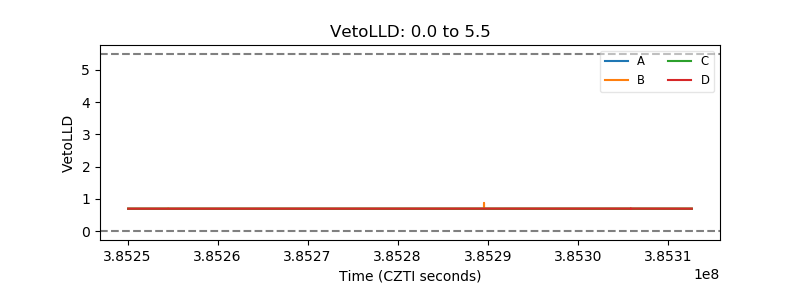 |
| Alpha Counter | 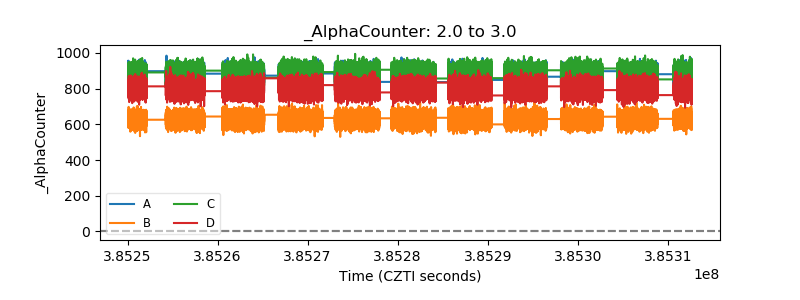 |
| _CPM_Rate | 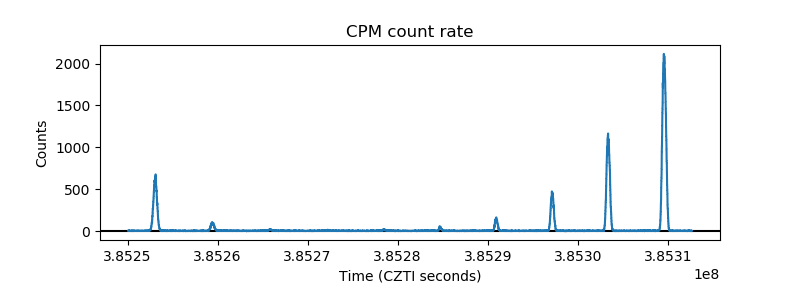 |
| CZT Counter | 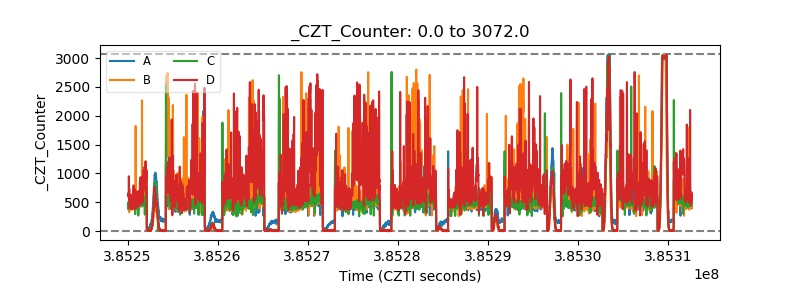 |
| +2.5 Volts monitor | 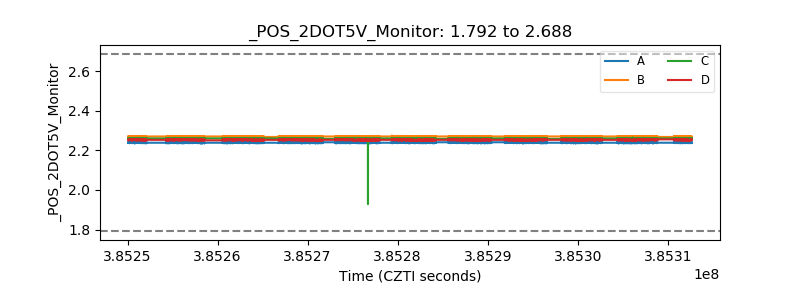 |
| +5 Volts monitor | 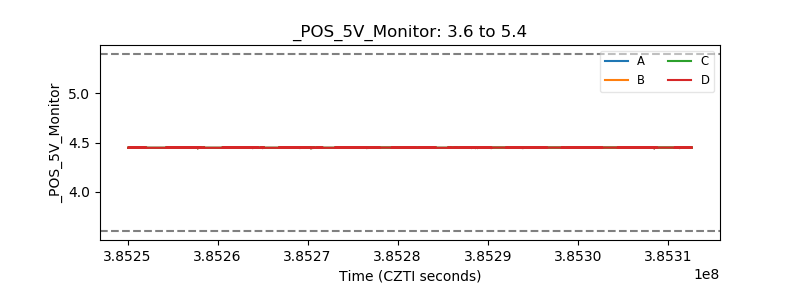 |
| _ROLL_ROT | 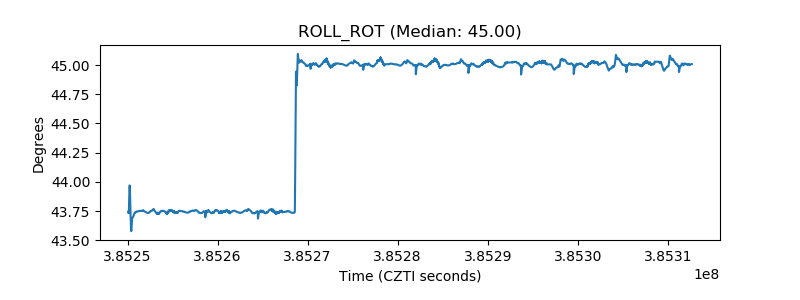 |
| _Roll_DEC | 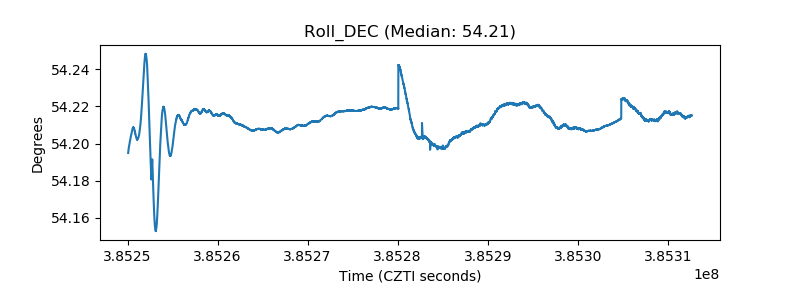 |
| _Roll_RA | 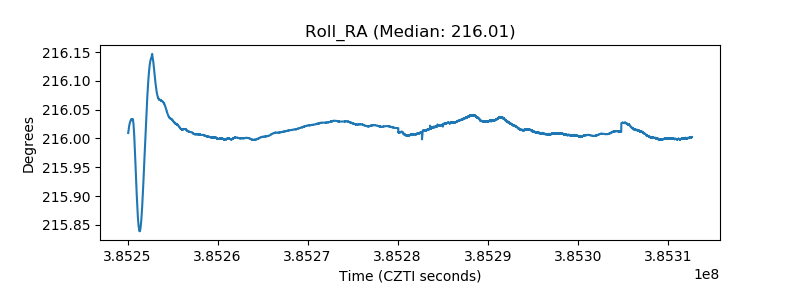 |
| Veto Counter | 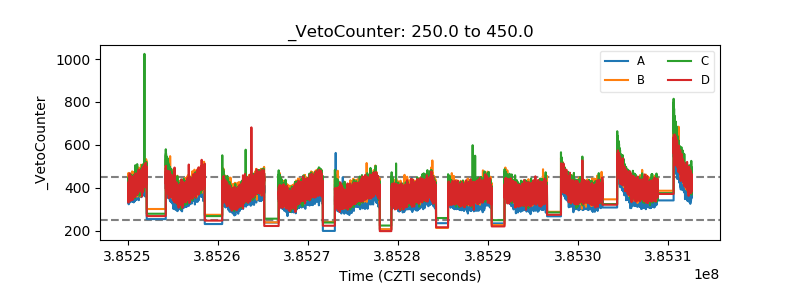 |