| Param | Original file | Final file |
|---|---|---|
| Filename | modeM0/AS1A11_069T01_9000005008_34941cztM0_level2.evt | modeM0/AS1A11_069T01_9000005008_34941cztM0_level2_quad_clean.evt |
| Size (bytes) | 629,182,080 | 78,549,120 |
| Size | 600.0 MB | 74.9 MB |
| Events in quadrant A | 7,642,375 | 458,802 |
| Events in quadrant B | 3,394,735 | 533,173 |
| Events in quadrant C | 2,870,256 | 527,181 |
| Events in quadrant D | 4,788,362 | 486,840 |
| Mode M0 | |||
|---|---|---|---|
| Quadrant | BADHDUFLAG | Total packets | Discarded packets |
| A | 0 | 26256 | 3 |
| B | 0 | 13512 | 2 |
| C | 0 | 11678 | 2 |
| D | 0 | 17883 | 2 |
| Mode SS | |||
|---|---|---|---|
| Quadrant | BADHDUFLAG | Total packets | Discarded packets |
| A | 0 | 108 | 0 |
| B | 0 | 108 | 0 |
| C | 0 | 108 | 0 |
| D | 0 | 108 | 0 |
| Mode M9 | |||
|---|---|---|---|
| Quadrant | BADHDUFLAG | Total packets | Discarded packets |
| A | 0 | 24 | 0 |
| B | 0 | 24 | 0 |
| C | 0 | 24 | 0 |
| D | 0 | 25 | 0 |
| Quadrant | Total seconds | Saturated seconds | Saturation percentage |
|---|---|---|---|
| A | 5311 | 2071 | 38.994540% |
| B | 5311 | 214 | 4.029373% |
| C | 5311 | 92 | 1.732254% |
| D | 5311 | 308 | 5.799285% |
Noise dominated data is calculated using 1-second bins in cleaned event files. If a bin has >2000 counts, and if more than 50% of those come from <1% of pixels, then it is considered to be noise-dominated and hence unusable.
| Quadrant | # 1 sec bins | Bins with >0 counts | Bins with >2000 counts | High rate bins dominated by noise | Noise dominated (total time) | Noise dominated (detector-on time) | Marked lightcurve |
|---|---|---|---|---|---|---|---|
| A | 7162 | 5310 | 2013 | 2013 | 28.11% | 37.91% | 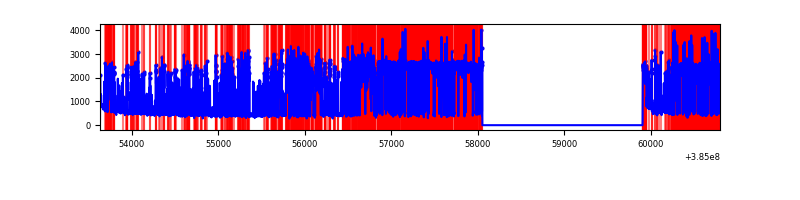 |
| B | 7163 | 5312 | 170 | 170 | 2.37% | 3.20% | 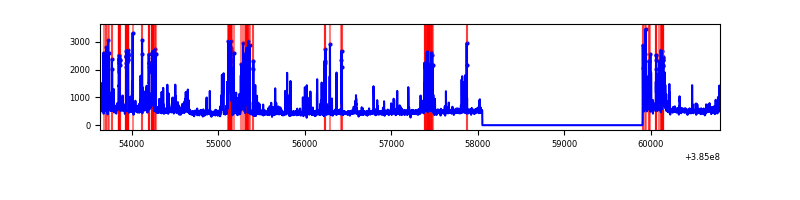 |
| C | 7163 | 5312 | 64 | 64 | 0.89% | 1.20% | 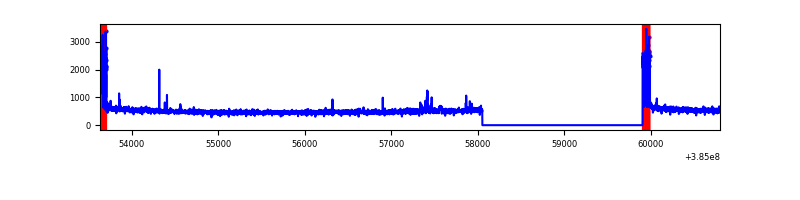 |
| D | 7163 | 5312 | 267 | 267 | 3.73% | 5.03% | 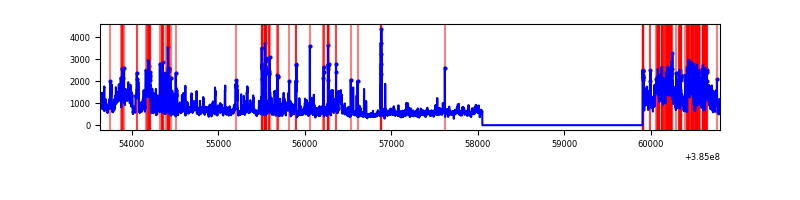 |
Top three noisy pixels from each quadrant. If the there are fewer than three noisy pixels in the level2.evt file, extra rows are filled as -1
| Pixel properties | Quadrant properties | ||||||
|---|---|---|---|---|---|---|---|
| Quadrant | DetID | PixID | Counts | Sigma | Mean | Median | Sigma |
| A | 15 | 169 | 5693110 | 57751.92 | 488 | 478 | 98.6 |
| A | 10 | 83 | 54343 | 546.46 | 488 | 478 | 98.6 |
| A | 13 | 6 | 7431 | 70.54 | 488 | 478 | 98.6 |
| B | 5 | 172 | 775565 | 6640.77 | 617 | 601 | 116.7 |
| B | 0 | 190 | 71879 | 610.79 | 617 | 601 | 116.7 |
| B | 4 | 232 | 47420 | 401.2 | 617 | 601 | 116.7 |
| C | 15 | 214 | 223457 | 1574.11 | 613 | 620 | 141.6 |
| C | 0 | 10 | 217064 | 1528.95 | 613 | 620 | 141.6 |
| C | 8 | 111 | 24139 | 166.14 | 613 | 620 | 141.6 |
| D | 8 | 195 | 610500 | 4125.9 | 608 | 592 | 147.8 |
| D | 1 | 52 | 503522 | 3402.22 | 608 | 592 | 147.8 |
| D | 2 | 31 | 430298 | 2906.87 | 608 | 592 | 147.8 |
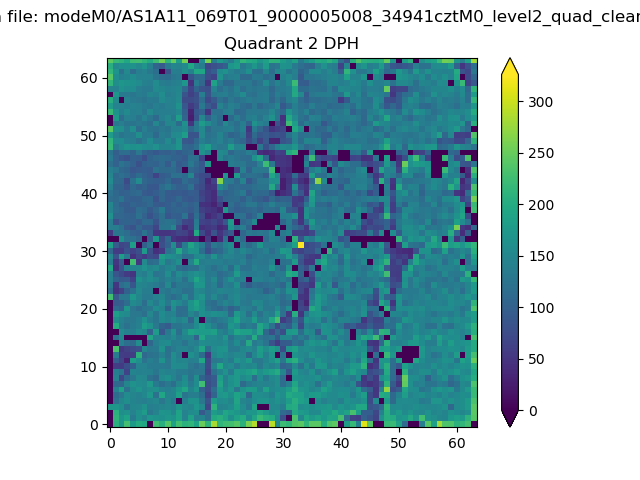
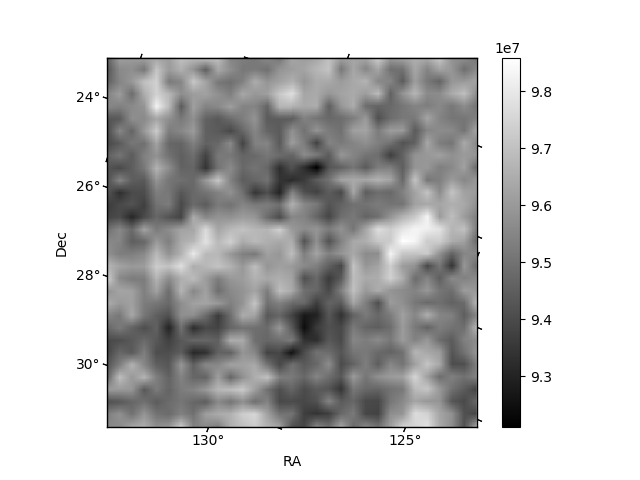
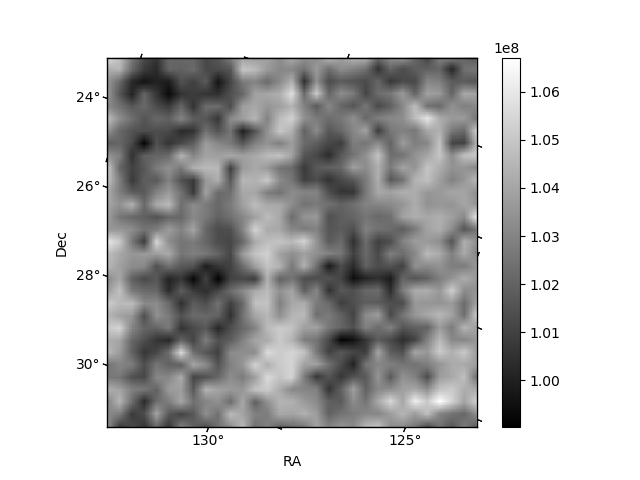
Histogram calculated using DETX and DETY for each event in the final _common_clean file
| Quadrant A | 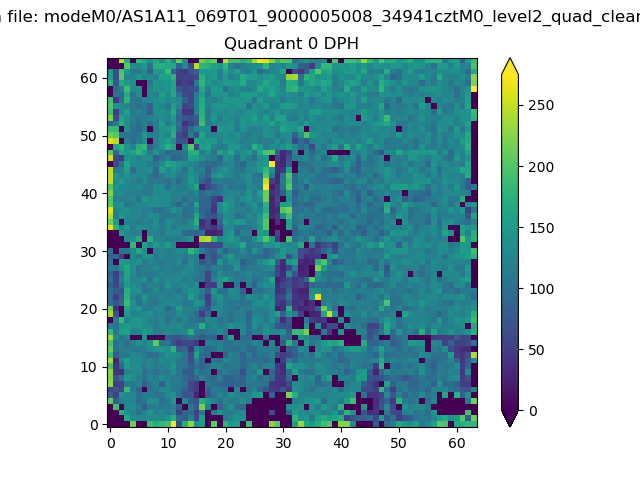 |
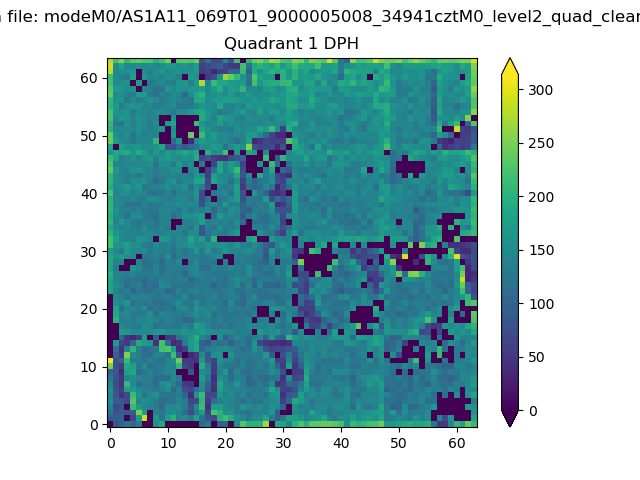 |
Quadrant B |
|---|---|---|---|
| Quadrant D | 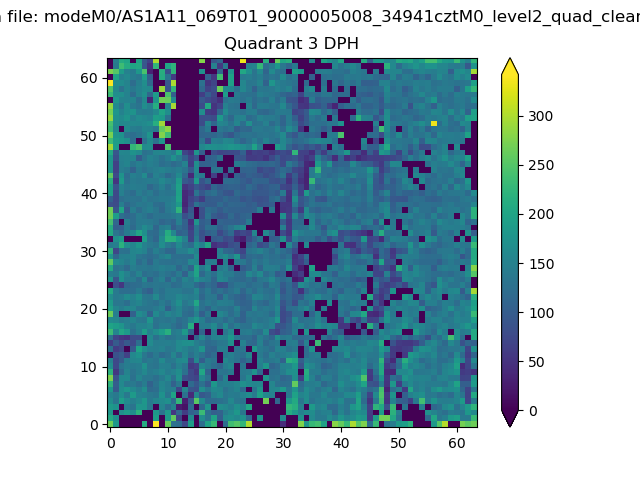 |
 |
Quadrant C |
| Plot type | Count rate plots | Images |
|---|---|---|
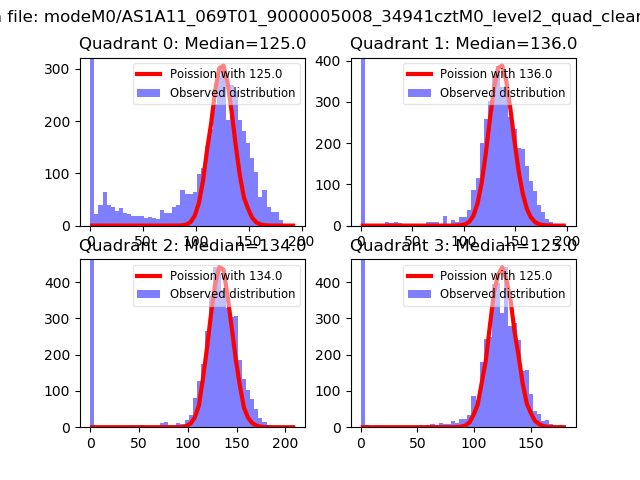
| Comparison with Poisson distribution Blue bars denote a histogram of data divided into 1 sec bins. Red curve is a Poisson curve with rate = median count rate of data. |
 |
 |
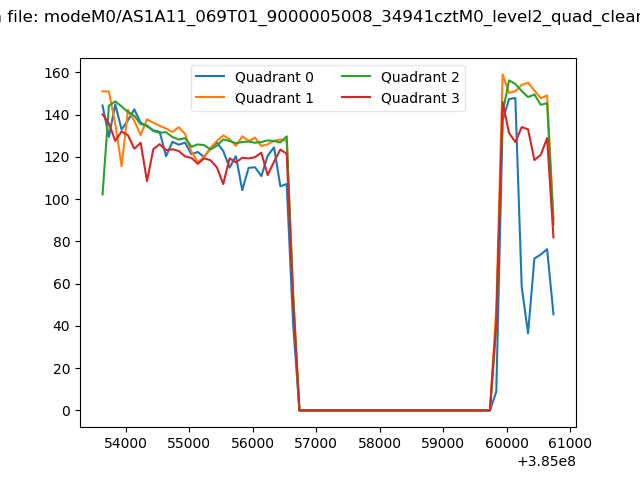
| Quadrant-wise count rates Data is divided into 100 sec bins |
 |
|
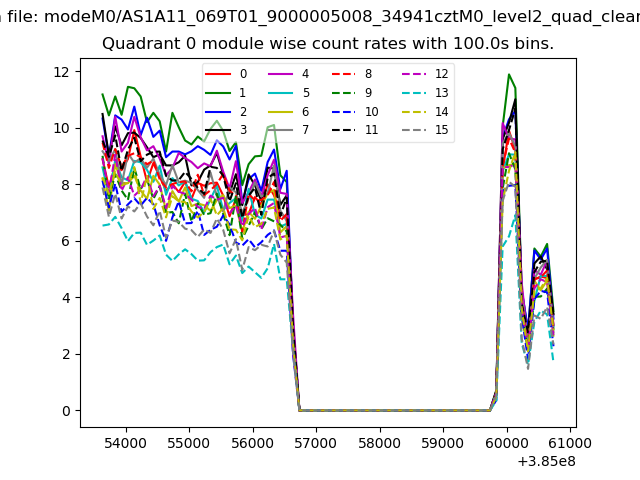
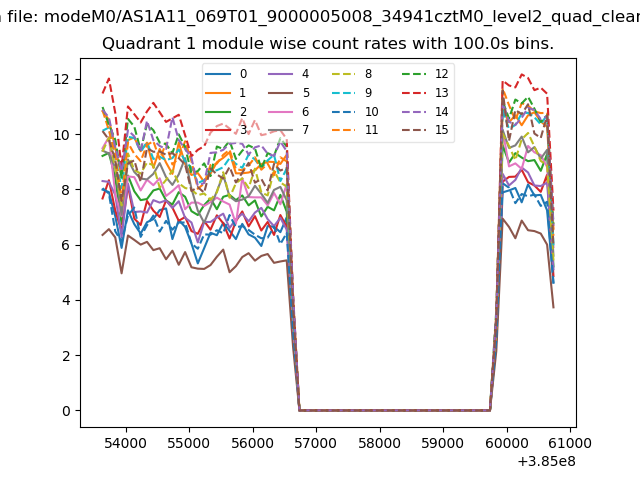
| Module-wise count rates for Quadrant A Data is divided into 100 sec bins |
 |
 |
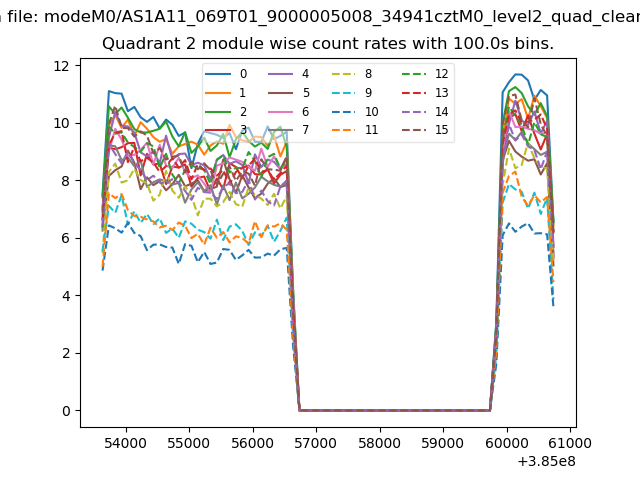
| Module-wise count rates for Quadrant B Data is divided into 100 sec bins |
 |
 |
| Module-wise count rates for Quadrant C Data is divided into 100 sec bins |
 |
 |
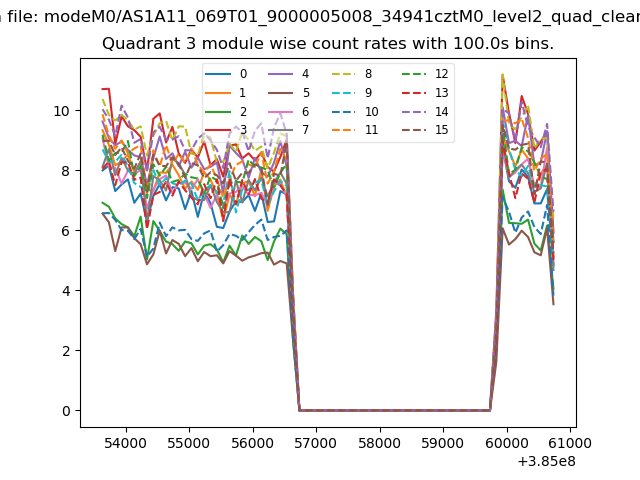
| Module-wise count rates for Quadrant D Data is divided into 100 sec bins |
 |
 |
| Parameter | Plot |
|---|---|
| CZT HV Monitor | 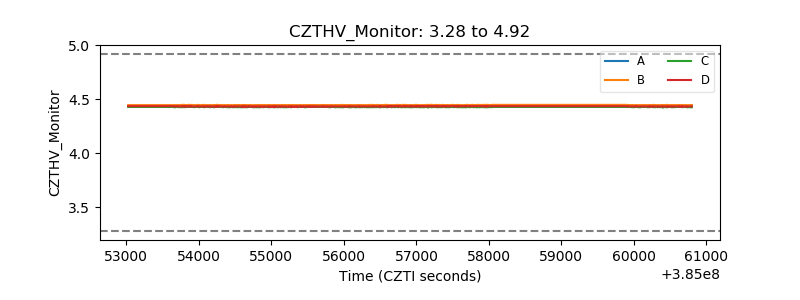 |
| D_VDD | 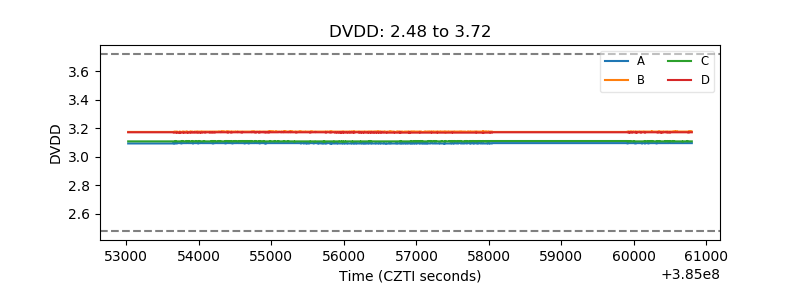 |
| Temperature 1 | 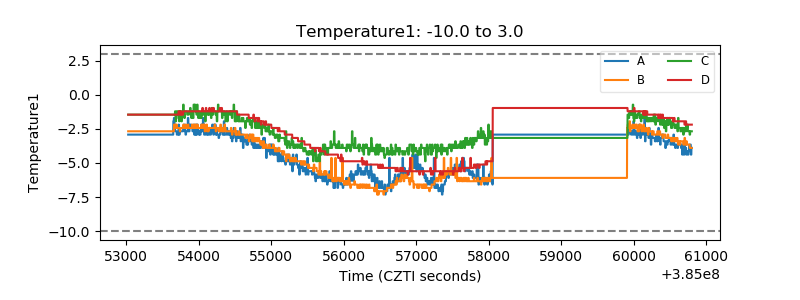 |
| Veto HV Monitor | 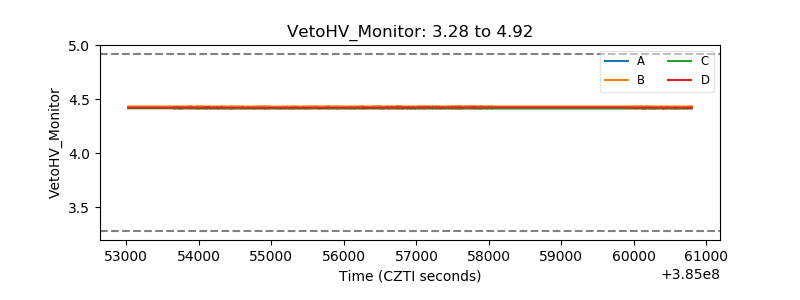 |
| Veto LLD | 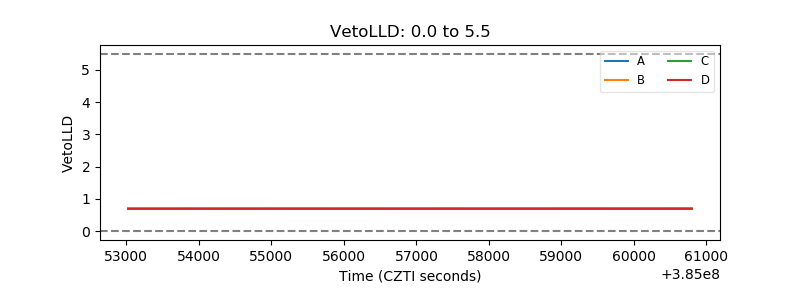 |
| Alpha Counter | 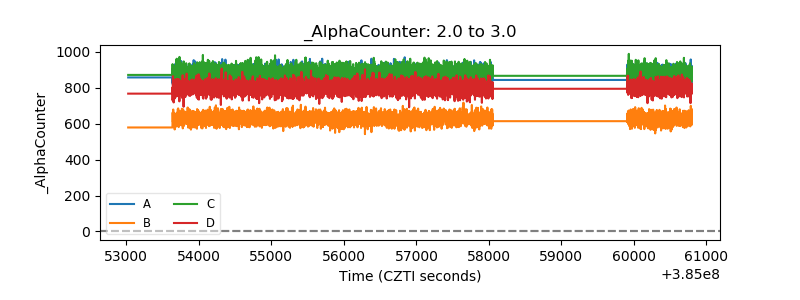 |
| _CPM_Rate | 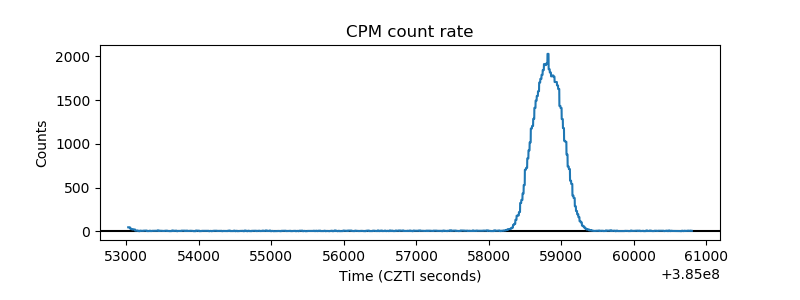 |
| CZT Counter | 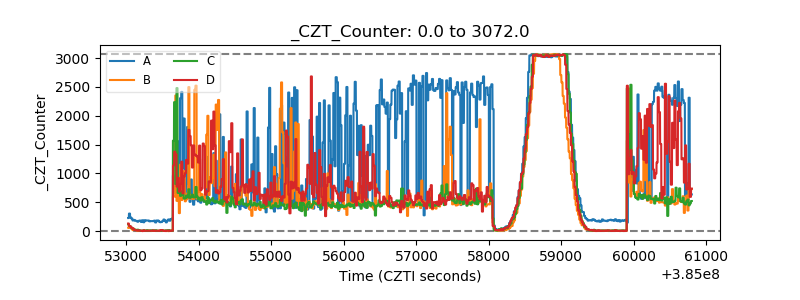 |
| +2.5 Volts monitor | 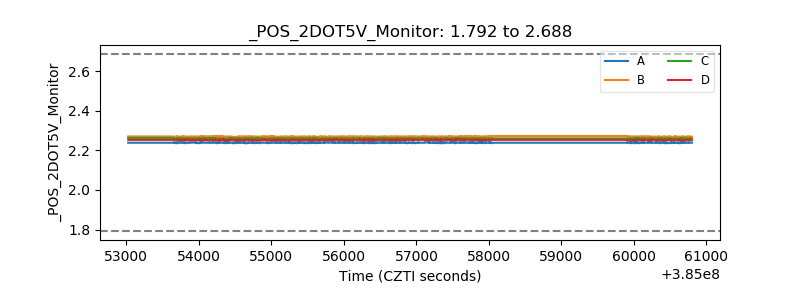 |
| +5 Volts monitor | 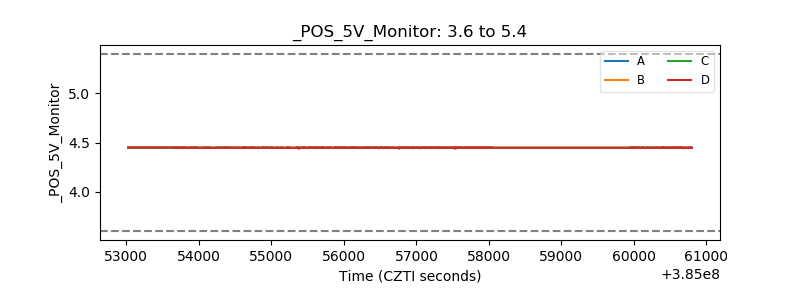 |
| _ROLL_ROT | 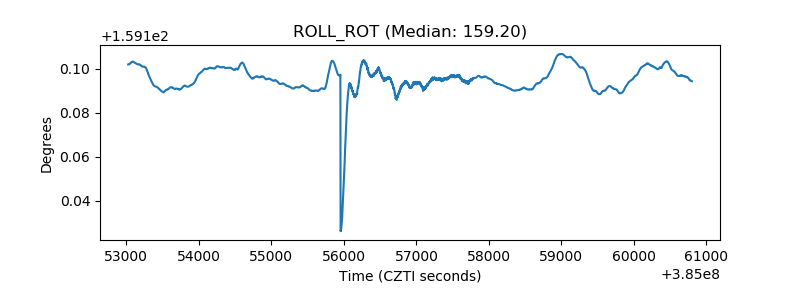 |
| _Roll_DEC | 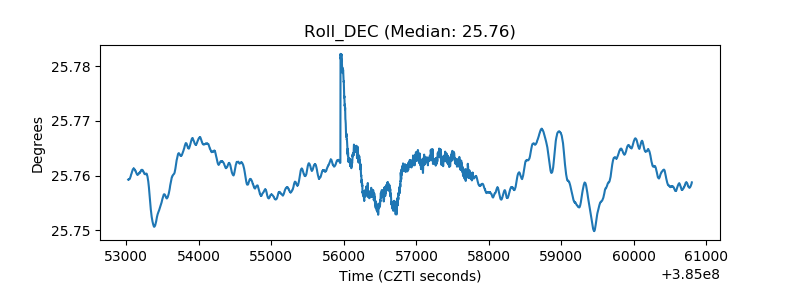 |
| _Roll_RA | 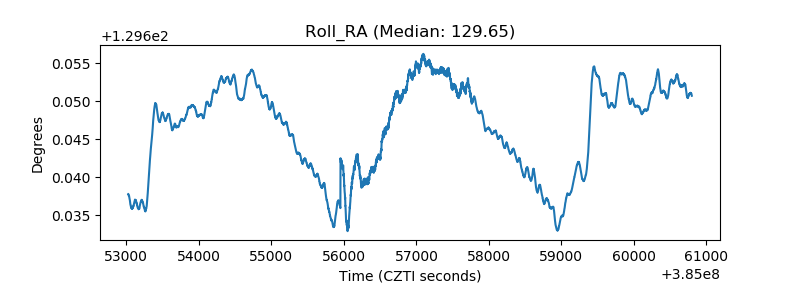 |
| Veto Counter | 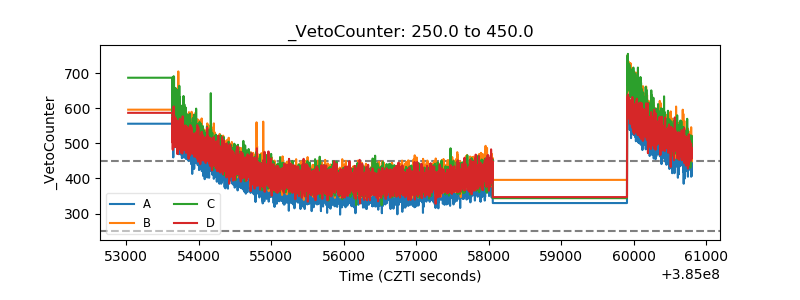 |