| Param | Original file | Final file |
|---|---|---|
| Filename | modeM0/AS1A11_047T09_9000005010_34972cztM0_level2.evt | modeM0/AS1A11_047T09_9000005010_34972cztM0_level2_quad_clean.evt |
| Size (bytes) | 439,021,440 | 72,550,080 |
| Size | 418.7 MB | 69.2 MB |
| Events in quadrant A | 2,474,617 | 478,831 |
| Events in quadrant B | 2,818,679 | 483,855 |
| Events in quadrant C | 2,736,955 | 465,824 |
| Events in quadrant D | 4,930,276 | 421,577 |
| Mode SS | |||
|---|---|---|---|
| Quadrant | BADHDUFLAG | Total packets | Discarded packets |
| A | 0 | 100 | 0 |
| B | 0 | 100 | 0 |
| C | 0 | 100 | 0 |
| D | 0 | 100 | 0 |
| Mode M0 | |||
|---|---|---|---|
| Quadrant | BADHDUFLAG | Total packets | Discarded packets |
| A | 0 | 10376 | 3 |
| B | 0 | 11267 | 2 |
| C | 0 | 10874 | 2 |
| D | 0 | 18041 | 2 |
| Mode M9 | |||
|---|---|---|---|
| Quadrant | BADHDUFLAG | Total packets | Discarded packets |
| A | 0 | 27 | 0 |
| B | 0 | 27 | 0 |
| C | 0 | 27 | 0 |
| D | 0 | 28 | 0 |
| Quadrant | Total seconds | Saturated seconds | Saturation percentage |
|---|---|---|---|
| A | 4946 | 5 | 0.101092% |
| B | 4946 | 96 | 1.940962% |
| C | 4946 | 65 | 1.314193% |
| D | 4946 | 337 | 6.813587% |
Noise dominated data is calculated using 1-second bins in cleaned event files. If a bin has >2000 counts, and if more than 50% of those come from <1% of pixels, then it is considered to be noise-dominated and hence unusable.
| Quadrant | # 1 sec bins | Bins with >0 counts | Bins with >2000 counts | High rate bins dominated by noise | Noise dominated (total time) | Noise dominated (detector-on time) | Marked lightcurve |
|---|---|---|---|---|---|---|---|
| A | 7040 | 4947 | 0 | 0 | 0.00% | 0.00% | 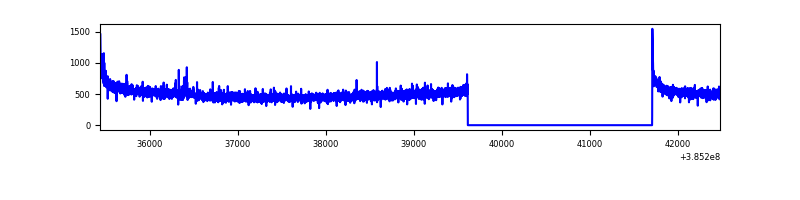 |
| B | 7040 | 4947 | 67 | 67 | 0.95% | 1.35% | 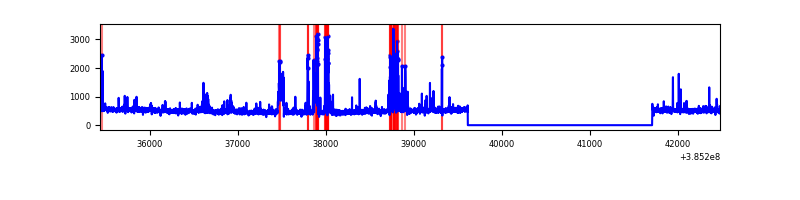 |
| C | 7040 | 4947 | 52 | 52 | 0.74% | 1.05% | 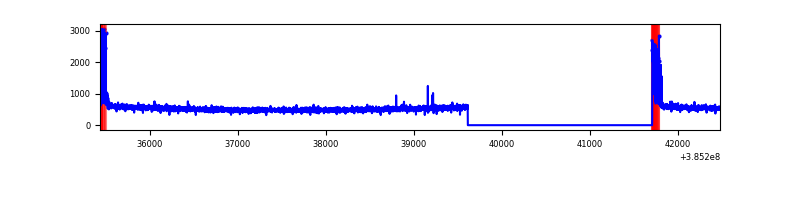 |
| D | 7040 | 4947 | 296 | 296 | 4.20% | 5.98% | 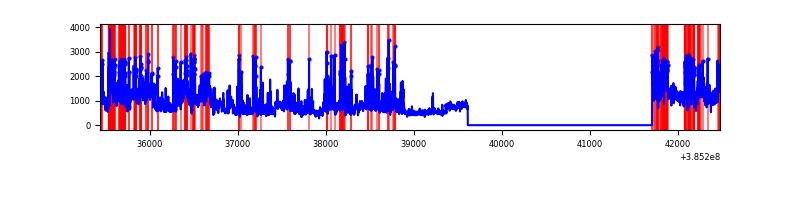 |
Top three noisy pixels from each quadrant. If the there are fewer than three noisy pixels in the level2.evt file, extra rows are filled as -1
| Pixel properties | Quadrant properties | ||||||
|---|---|---|---|---|---|---|---|
| Quadrant | DetID | PixID | Counts | Sigma | Mean | Median | Sigma |
| A | 10 | 83 | 70859 | 576.0 | 615 | 606 | 122.0 |
| A | 13 | 6 | 10785 | 83.46 | 615 | 606 | 122.0 |
| A | 15 | 169 | 9469 | 72.67 | 615 | 606 | 122.0 |
| B | 5 | 172 | 258567 | 2263.25 | 607 | 591 | 114.0 |
| B | 0 | 155 | 137002 | 1196.75 | 607 | 591 | 114.0 |
| B | 3 | 112 | 31615 | 272.18 | 607 | 591 | 114.0 |
| C | 15 | 214 | 208147 | 1489.86 | 597 | 602 | 139.3 |
| C | 0 | 10 | 180253 | 1289.62 | 597 | 602 | 139.3 |
| C | 14 | 67 | 11279 | 76.64 | 597 | 602 | 139.3 |
| D | 8 | 195 | 1148993 | 8128.51 | 582 | 567 | 141.3 |
| D | 1 | 47 | 508090 | 3592.22 | 582 | 567 | 141.3 |
| D | 1 | 52 | 289992 | 2048.54 | 582 | 567 | 141.3 |
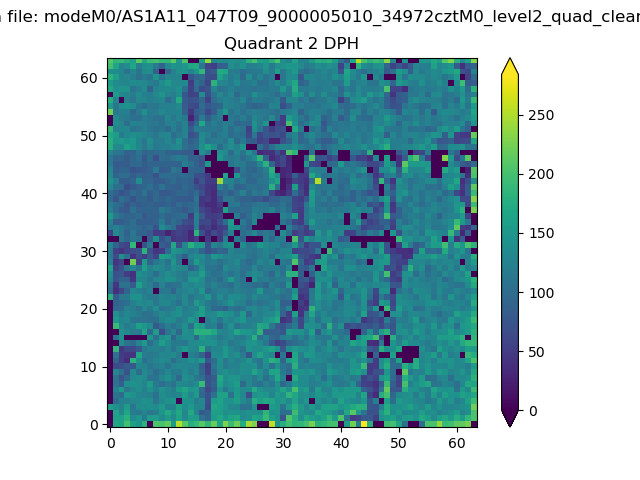
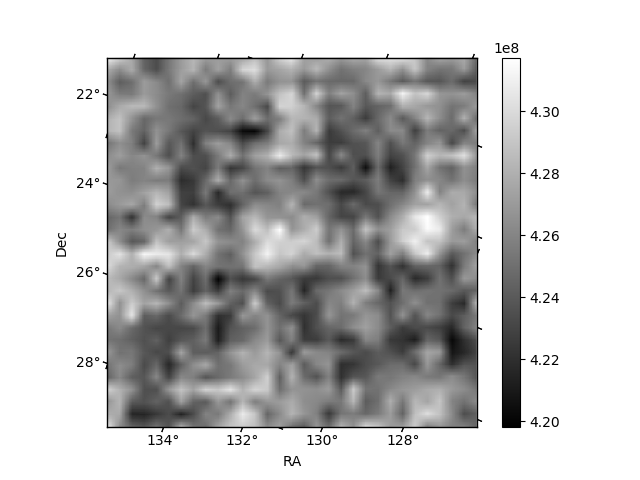
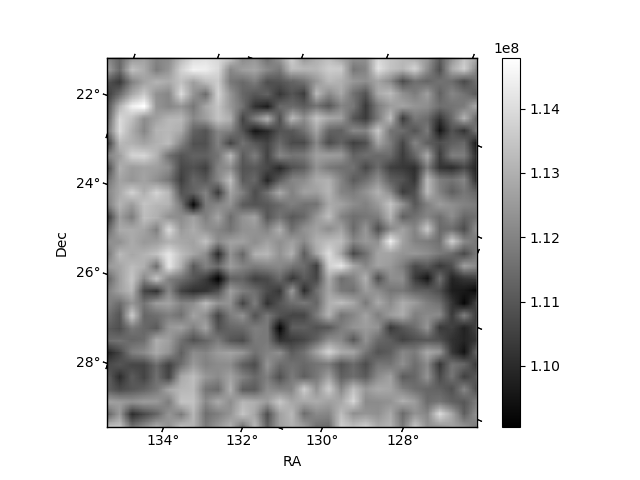
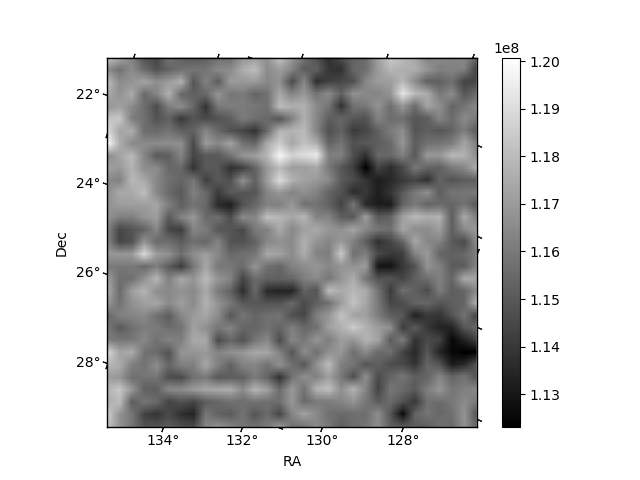
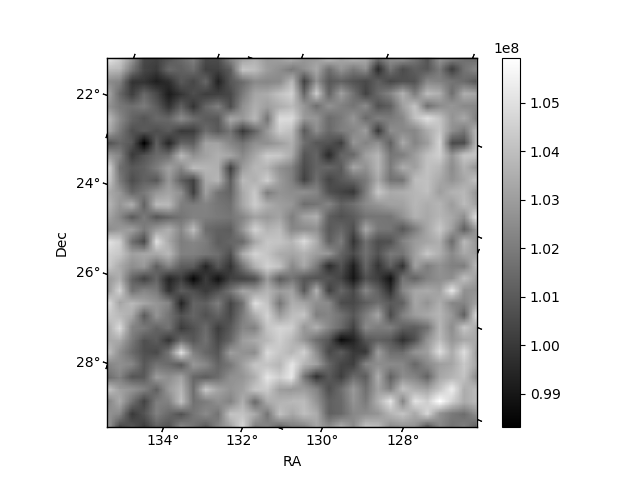
Histogram calculated using DETX and DETY for each event in the final _common_clean file
| Quadrant A | 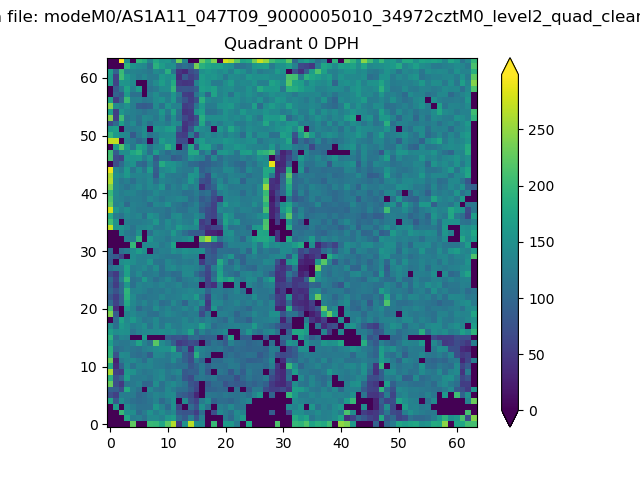 |
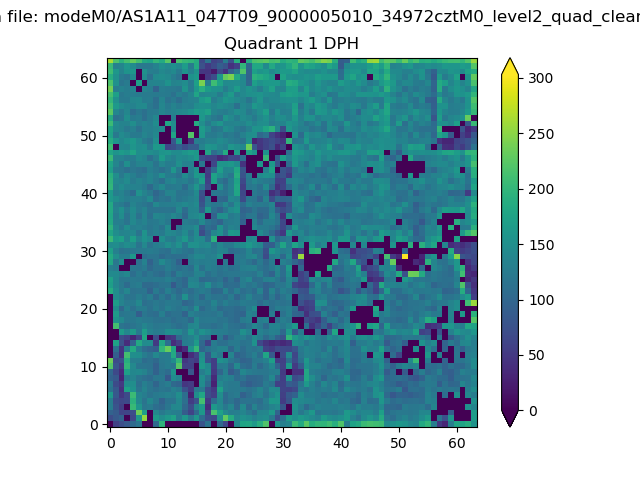 |
Quadrant B |
|---|---|---|---|
| Quadrant D | 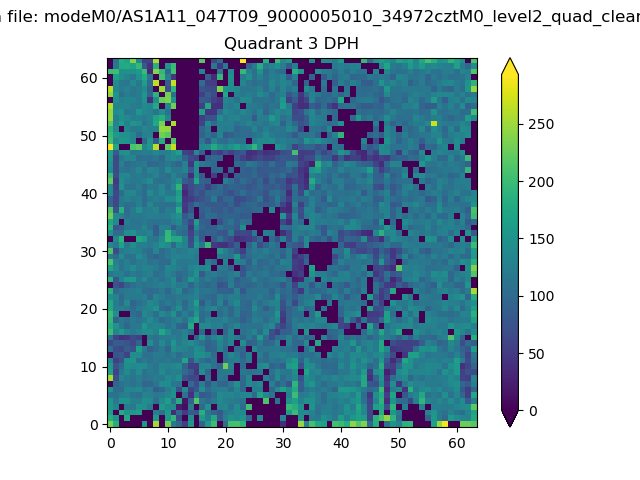 |
 |
Quadrant C |
| Plot type | Count rate plots | Images |
|---|---|---|
| Comparison with Poisson distribution Blue bars denote a histogram of data divided into 1 sec bins. Red curve is a Poisson curve with rate = median count rate of data. |
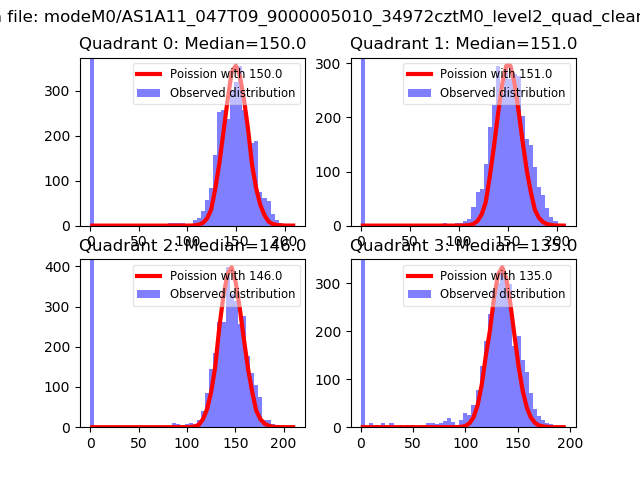 |
 |
| Quadrant-wise count rates Data is divided into 100 sec bins |
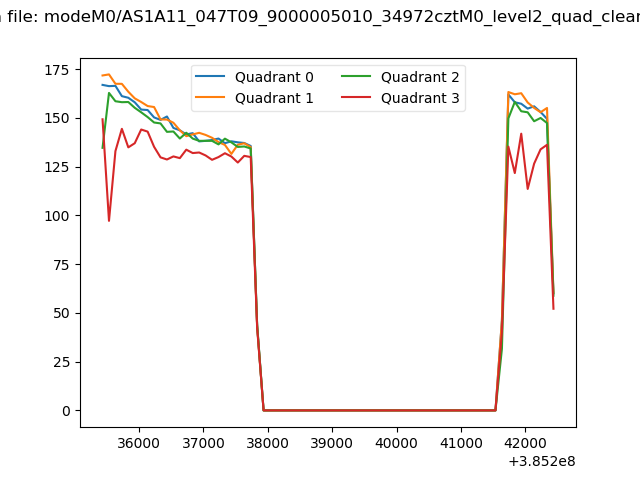 |
|
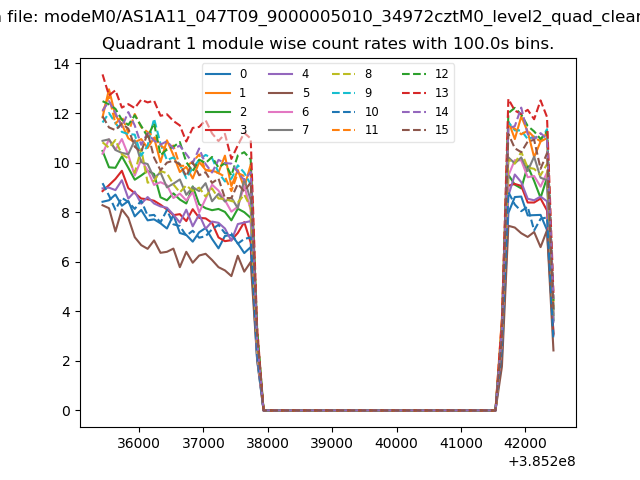
| Module-wise count rates for Quadrant A Data is divided into 100 sec bins |
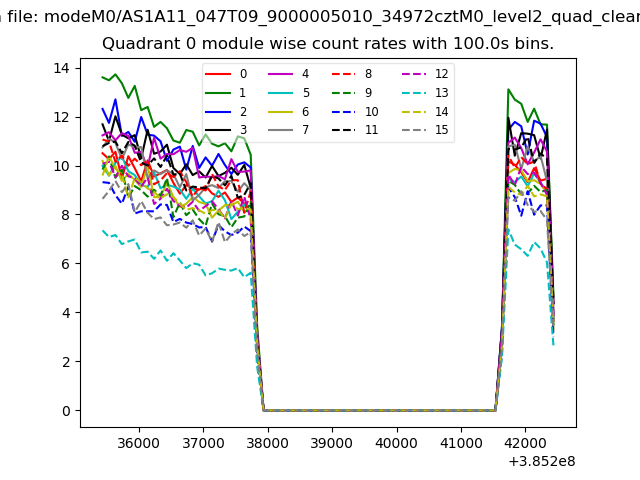 |
 |
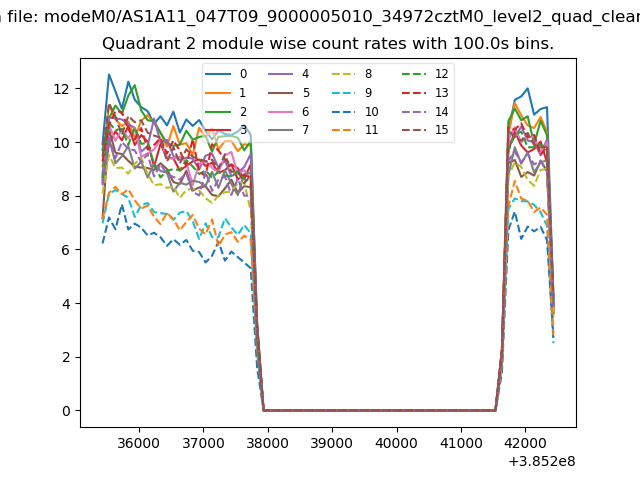
| Module-wise count rates for Quadrant B Data is divided into 100 sec bins |
 |
 |
| Module-wise count rates for Quadrant C Data is divided into 100 sec bins |
 |
 |
| Module-wise count rates for Quadrant D Data is divided into 100 sec bins |
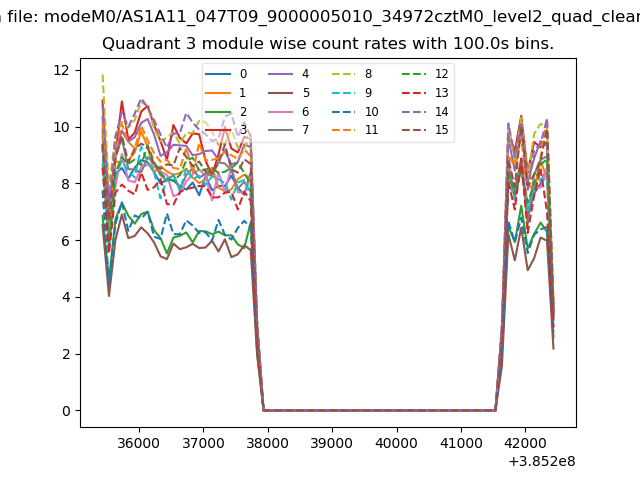 |
 |
| Parameter | Plot |
|---|---|
| CZT HV Monitor | 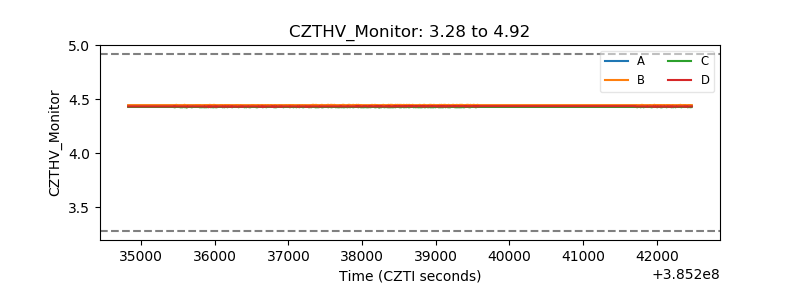 |
| D_VDD | 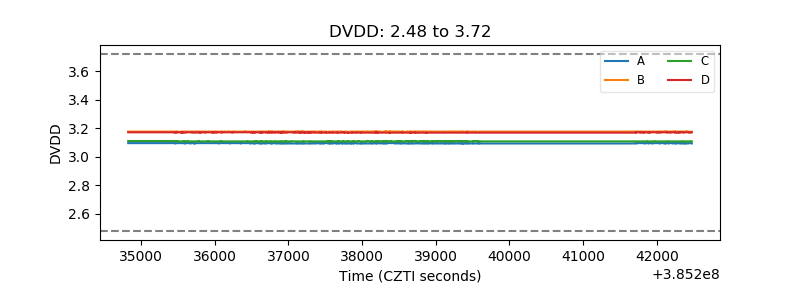 |
| Temperature 1 | 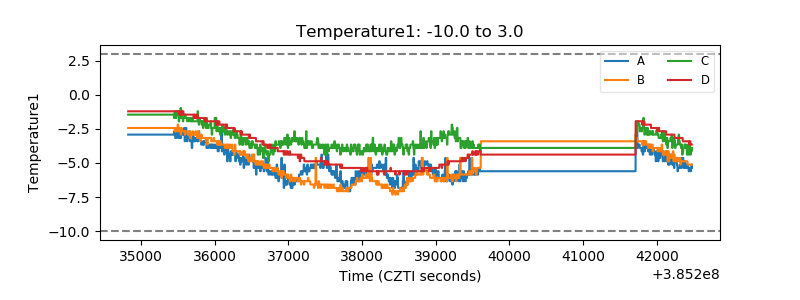 |
| Veto HV Monitor | 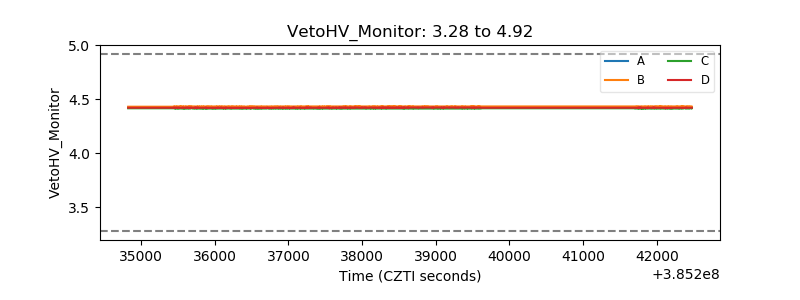 |
| Veto LLD | 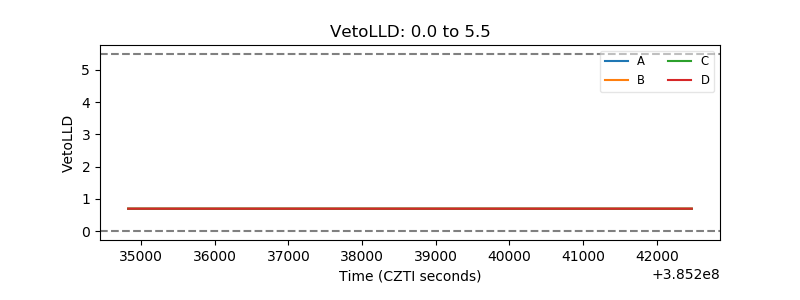 |
| Alpha Counter | 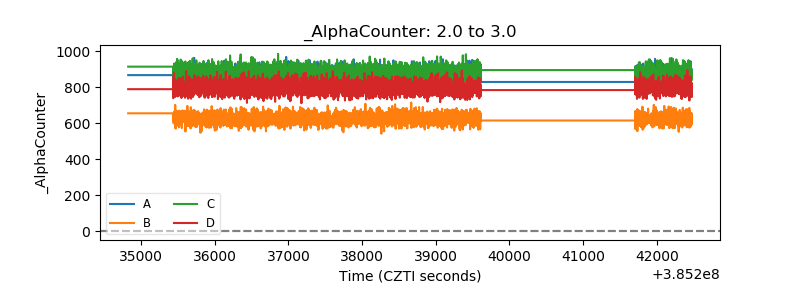 |
| _CPM_Rate | 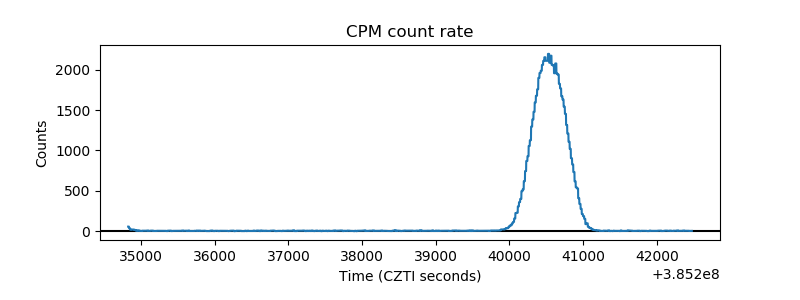 |
| CZT Counter | 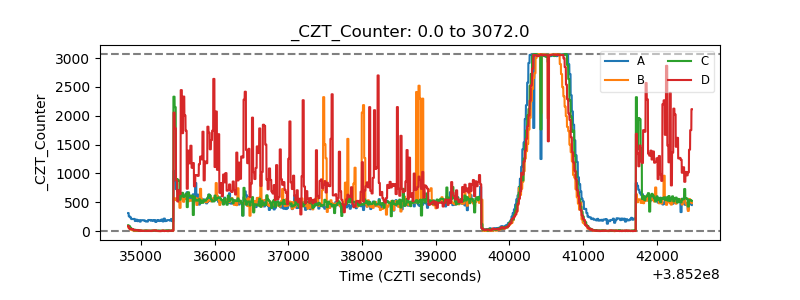 |
| +2.5 Volts monitor | 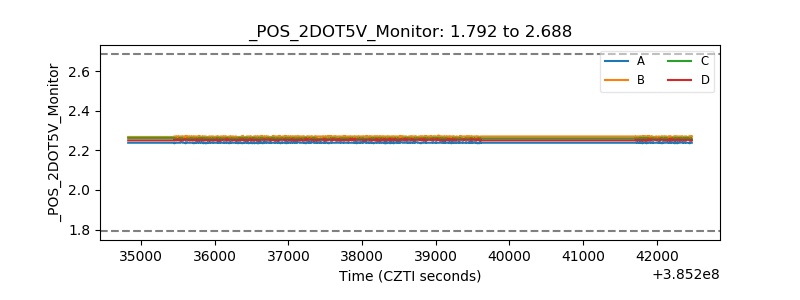 |
| +5 Volts monitor | 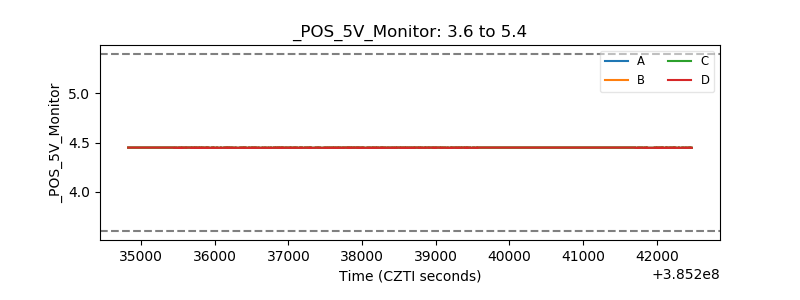 |
| _ROLL_ROT | 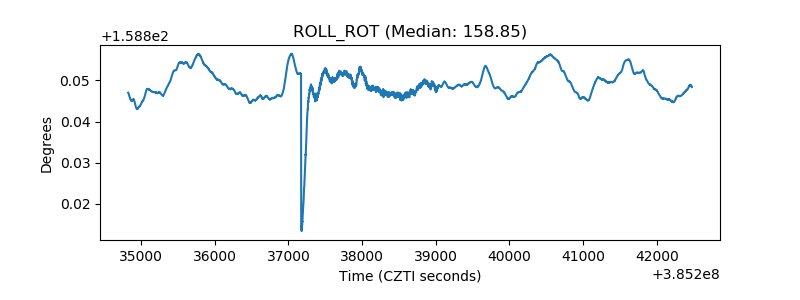 |
| _Roll_DEC | 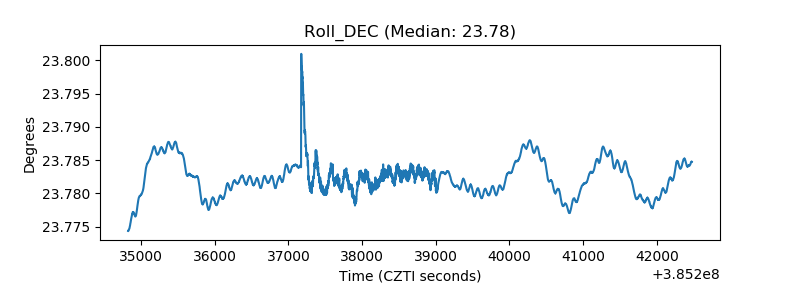 |
| _Roll_RA | 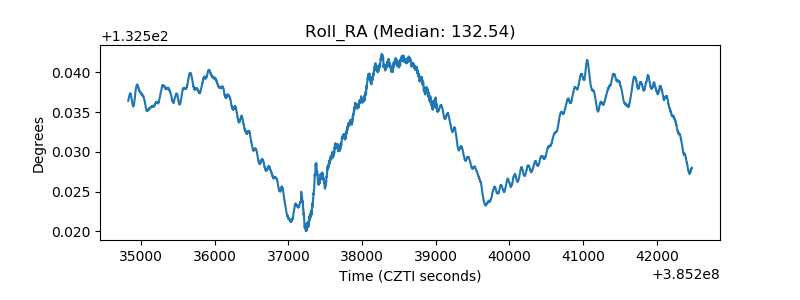 |
| Veto Counter | 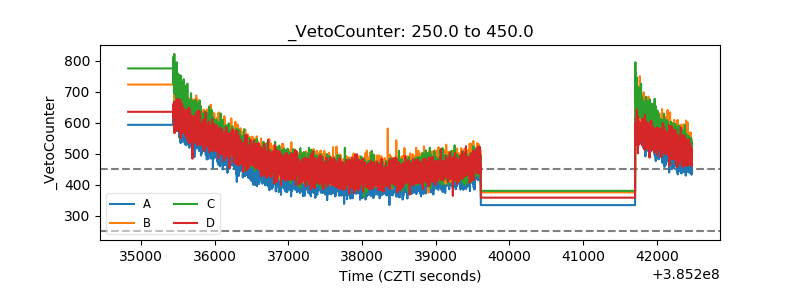 |