| Param | Original file | Final file |
|---|---|---|
| Filename | modeM0/AS1A11_047T09_9000005010_34957cztM0_level2.evt | modeM0/AS1A11_047T09_9000005010_34957cztM0_level2_quad_clean.evt |
| Size (bytes) | 476,841,600 | 77,031,360 |
| Size | 454.8 MB | 73.5 MB |
| Events in quadrant A | 2,579,165 | 515,707 |
| Events in quadrant B | 3,773,499 | 495,294 |
| Events in quadrant C | 2,933,337 | 501,624 |
| Events in quadrant D | 4,805,822 | 458,708 |
| Mode SS | |||
|---|---|---|---|
| Quadrant | BADHDUFLAG | Total packets | Discarded packets |
| A | 0 | 104 | 0 |
| B | 0 | 104 | 0 |
| C | 0 | 104 | 0 |
| D | 0 | 104 | 0 |
| Mode M0 | |||
|---|---|---|---|
| Quadrant | BADHDUFLAG | Total packets | Discarded packets |
| A | 0 | 10832 | 2 |
| B | 0 | 14426 | 1 |
| C | 0 | 11691 | 1 |
| D | 0 | 17731 | 1 |
| Mode M9 | |||
|---|---|---|---|
| Quadrant | BADHDUFLAG | Total packets | Discarded packets |
| A | 0 | 27 | 0 |
| B | 0 | 27 | 0 |
| C | 0 | 27 | 0 |
| D | 0 | 28 | 0 |
| Quadrant | Total seconds | Saturated seconds | Saturation percentage |
|---|---|---|---|
| A | 5155 | 11 | 0.213385% |
| B | 5155 | 403 | 7.817653% |
| C | 5155 | 74 | 1.435500% |
| D | 5155 | 358 | 6.944714% |
Noise dominated data is calculated using 1-second bins in cleaned event files. If a bin has >2000 counts, and if more than 50% of those come from <1% of pixels, then it is considered to be noise-dominated and hence unusable.
| Quadrant | # 1 sec bins | Bins with >0 counts | Bins with >2000 counts | High rate bins dominated by noise | Noise dominated (total time) | Noise dominated (detector-on time) | Marked lightcurve |
|---|---|---|---|---|---|---|---|
| A | 7187 | 5156 | 5 | 5 | 0.07% | 0.10% | 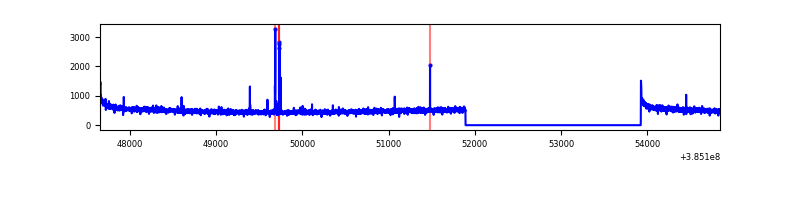 |
| B | 7187 | 5156 | 325 | 325 | 4.52% | 6.30% | 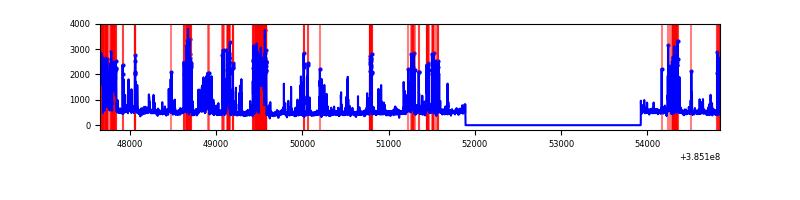 |
| C | 7187 | 5156 | 54 | 54 | 0.75% | 1.05% | 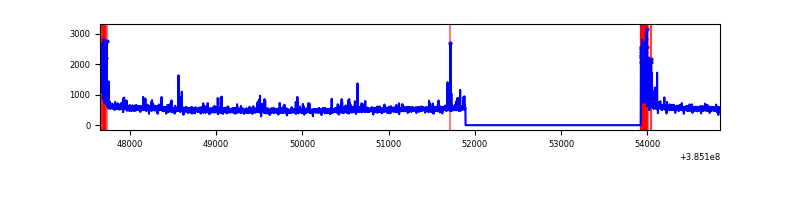 |
| D | 7187 | 5156 | 339 | 339 | 4.72% | 6.57% | 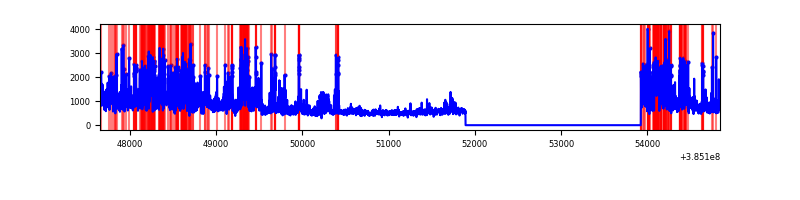 |
Top three noisy pixels from each quadrant. If the there are fewer than three noisy pixels in the level2.evt file, extra rows are filled as -1
| Pixel properties | Quadrant properties | ||||||
|---|---|---|---|---|---|---|---|
| Quadrant | DetID | PixID | Counts | Sigma | Mean | Median | Sigma |
| A | 10 | 83 | 72191 | 558.78 | 638 | 627 | 128.1 |
| A | 7 | 16 | 26994 | 205.88 | 638 | 627 | 128.1 |
| A | 13 | 6 | 10413 | 76.41 | 638 | 627 | 128.1 |
| B | 5 | 172 | 1141236 | 9803.4 | 614 | 598 | 116.4 |
| B | 0 | 190 | 156402 | 1339.08 | 614 | 598 | 116.4 |
| B | 15 | 85 | 37726 | 319.1 | 614 | 598 | 116.4 |
| C | 0 | 10 | 278210 | 1952.93 | 620 | 626 | 142.1 |
| C | 15 | 214 | 215986 | 1515.15 | 620 | 626 | 142.1 |
| C | 14 | 67 | 8824 | 57.68 | 620 | 626 | 142.1 |
| D | 8 | 195 | 916846 | 6242.09 | 607 | 591 | 146.8 |
| D | 1 | 52 | 620209 | 4221.22 | 607 | 591 | 146.8 |
| D | 10 | 118 | 425464 | 2894.5 | 607 | 591 | 146.8 |
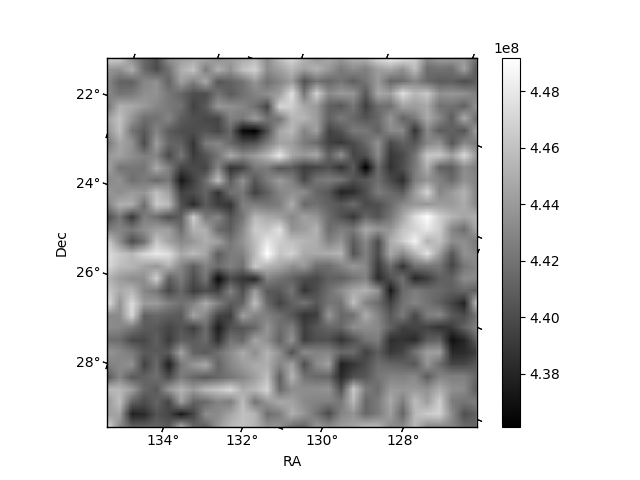
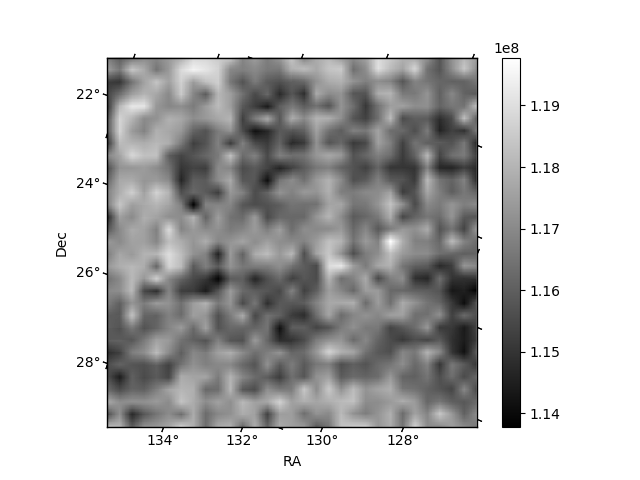
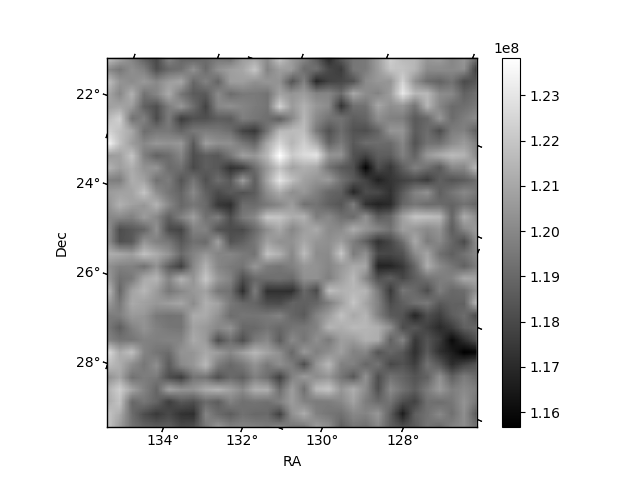
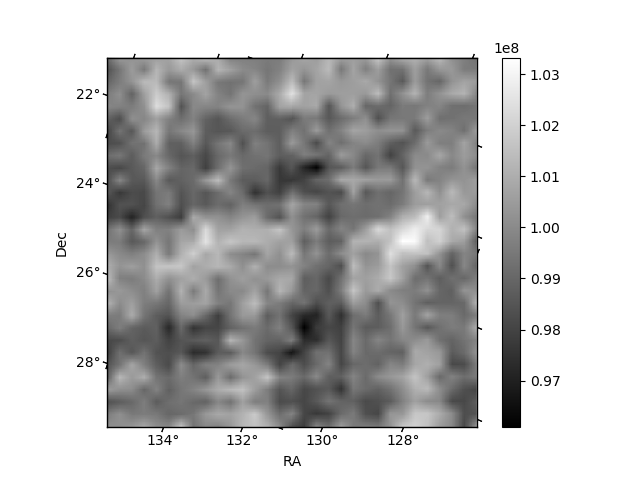
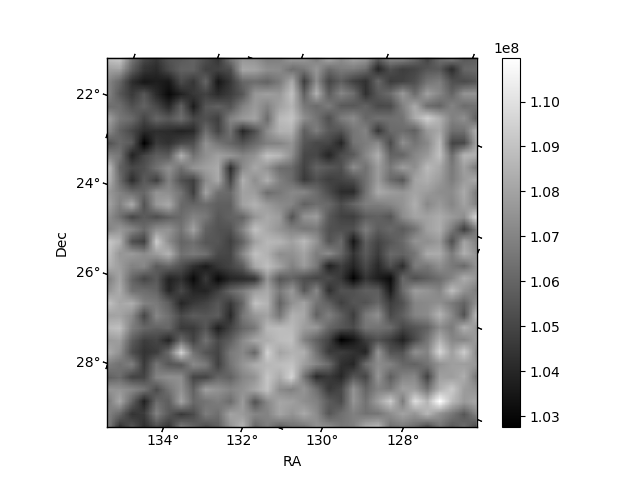
Histogram calculated using DETX and DETY for each event in the final _common_clean file
| Quadrant A | 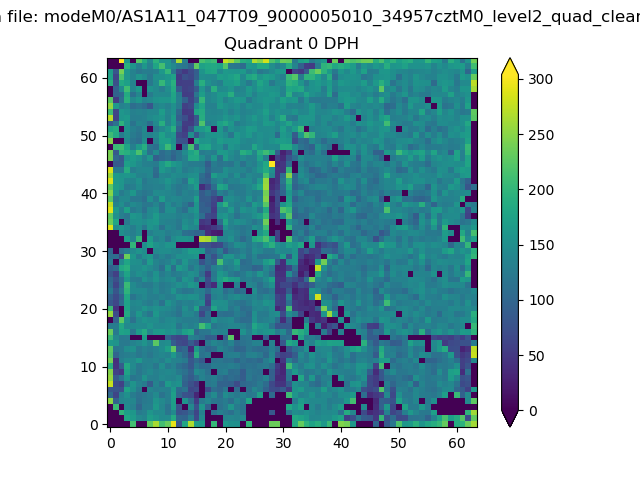 |
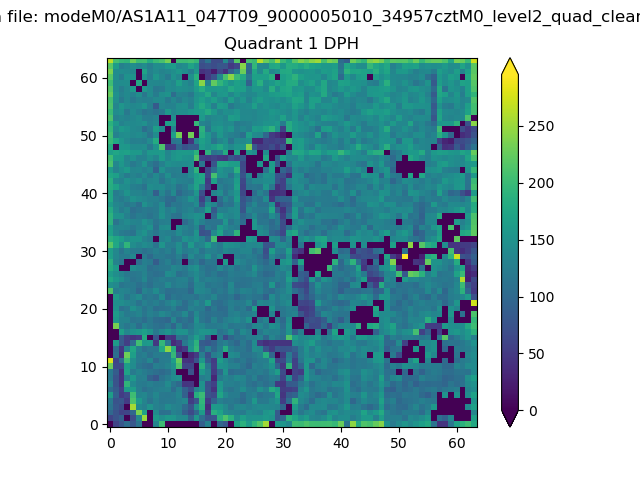 |
Quadrant B |
|---|---|---|---|
| Quadrant D | 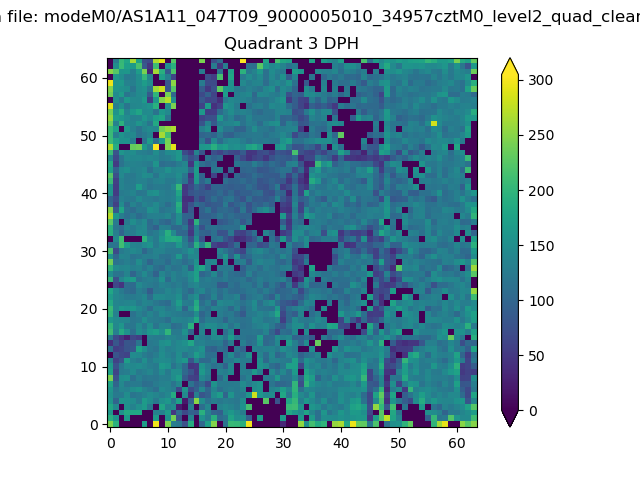 |
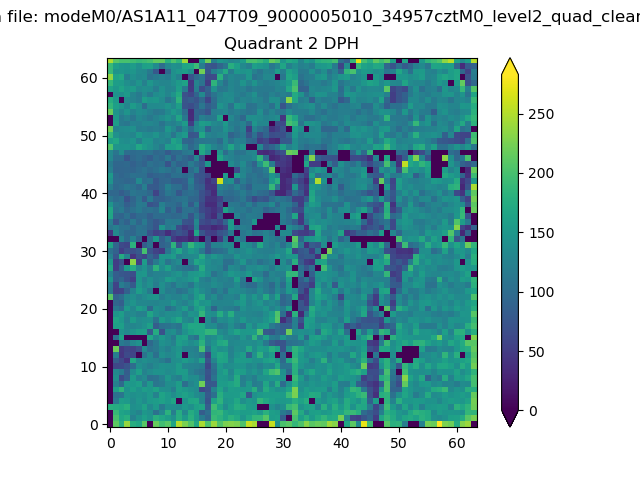 |
Quadrant C |
| Plot type | Count rate plots | Images |
|---|---|---|
| Comparison with Poisson distribution Blue bars denote a histogram of data divided into 1 sec bins. Red curve is a Poisson curve with rate = median count rate of data. |
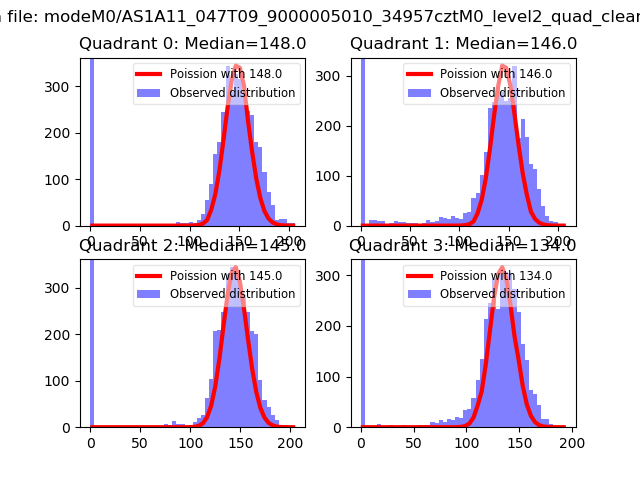 |
 |
| Quadrant-wise count rates Data is divided into 100 sec bins |
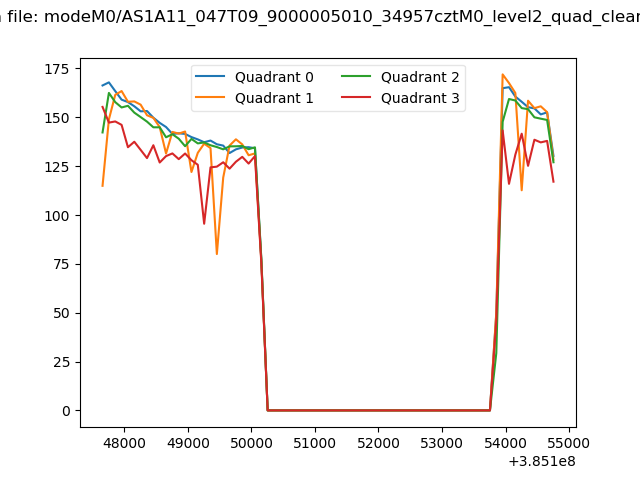 |
|
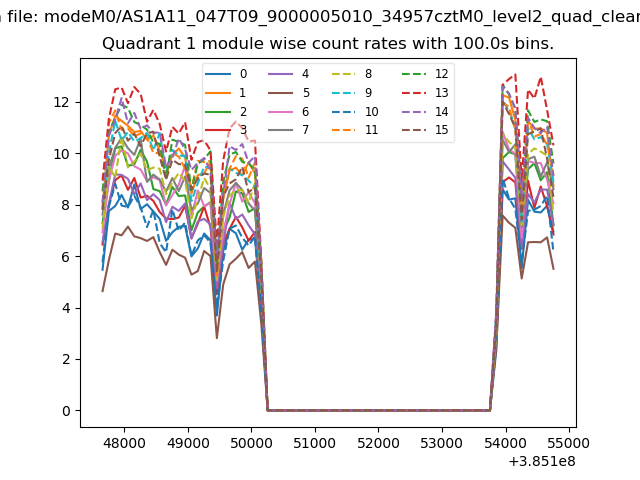
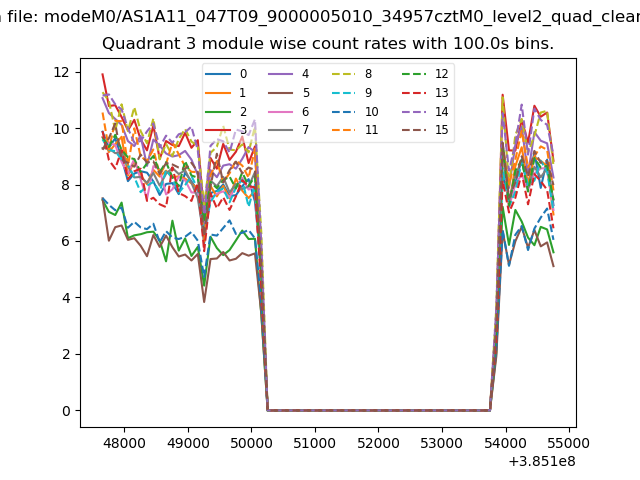
| Module-wise count rates for Quadrant A Data is divided into 100 sec bins |
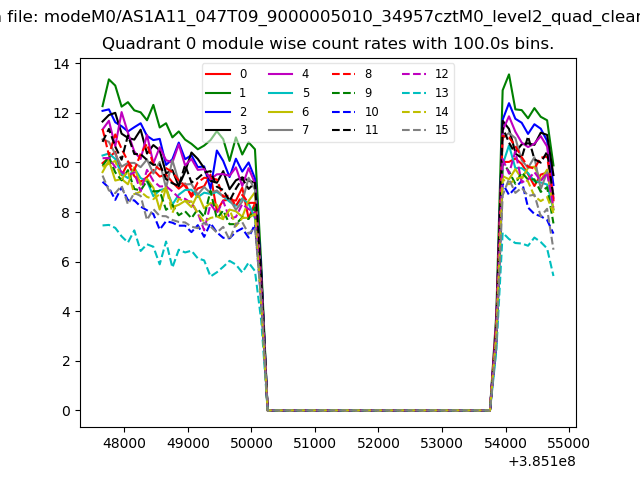 |
 |
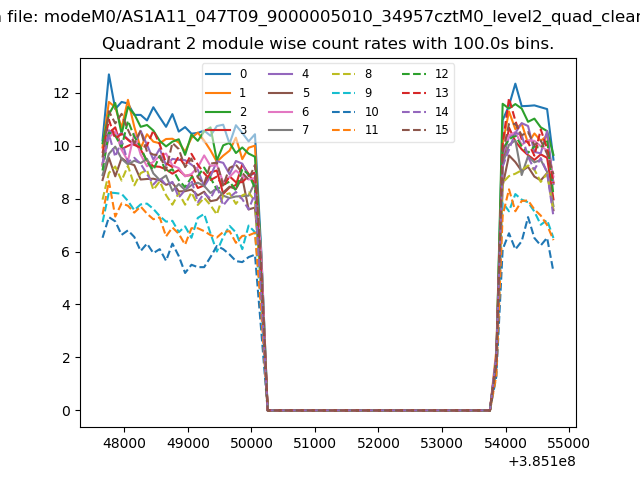
| Module-wise count rates for Quadrant B Data is divided into 100 sec bins |
 |
 |
| Module-wise count rates for Quadrant C Data is divided into 100 sec bins |
 |
 |
| Module-wise count rates for Quadrant D Data is divided into 100 sec bins |
 |
 |
| Parameter | Plot |
|---|---|
| CZT HV Monitor | 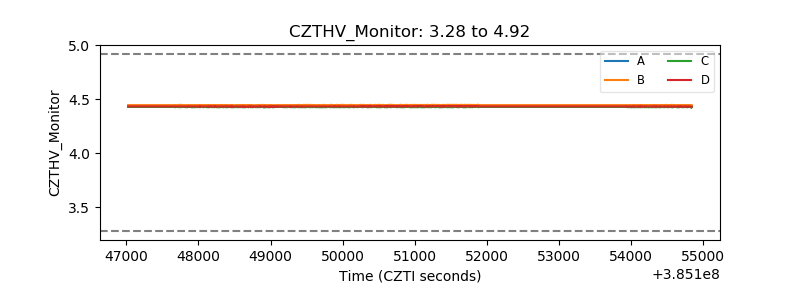 |
| D_VDD | 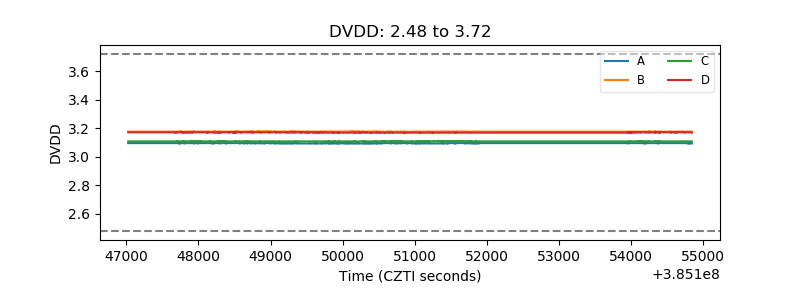 |
| Temperature 1 | 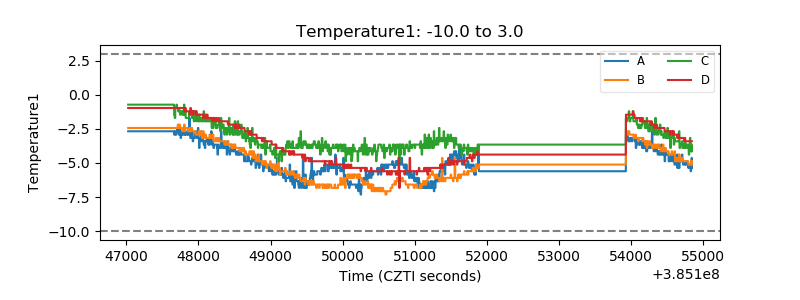 |
| Veto HV Monitor | 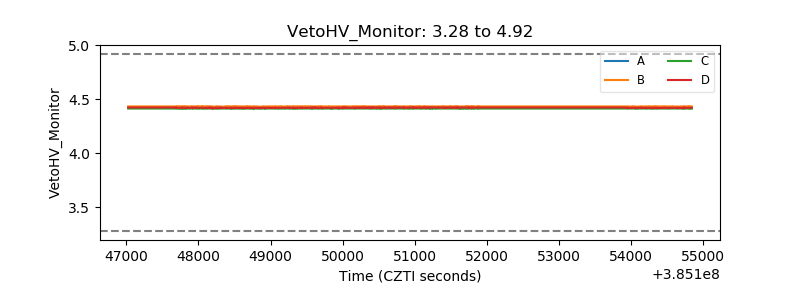 |
| Veto LLD | 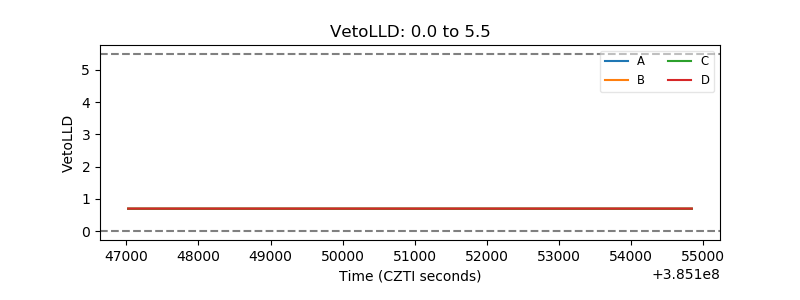 |
| Alpha Counter | 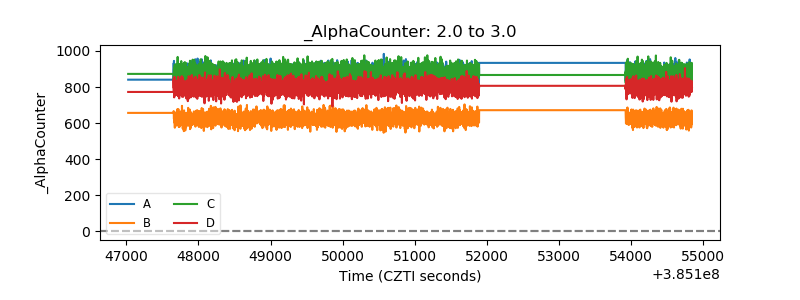 |
| _CPM_Rate | 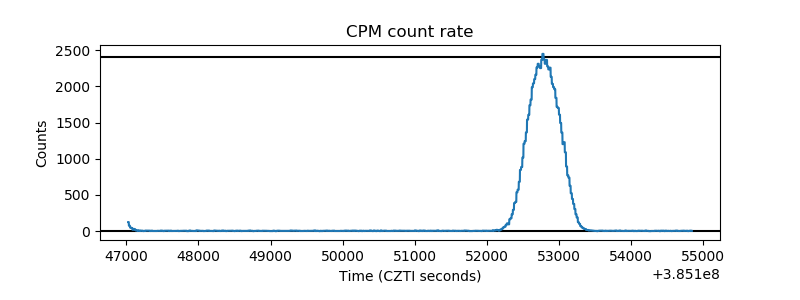 |
| CZT Counter | 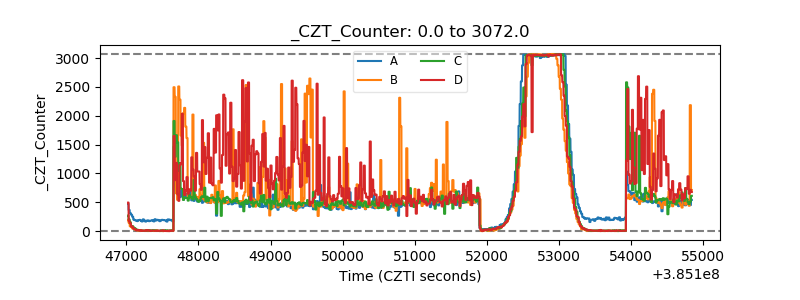 |
| +2.5 Volts monitor | 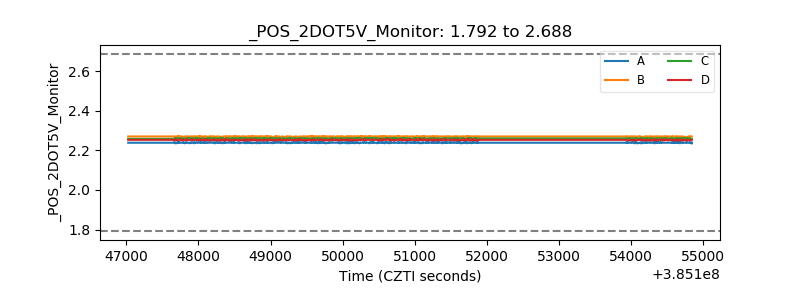 |
| +5 Volts monitor | 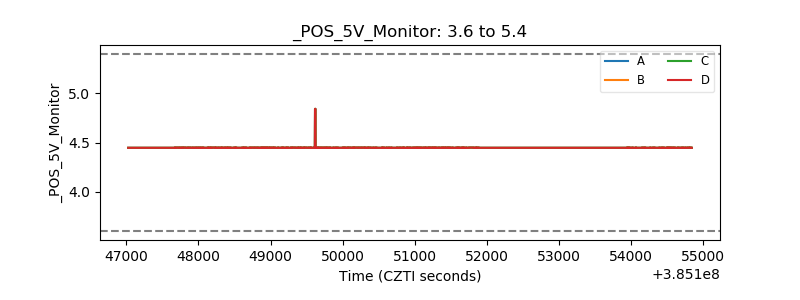 |
| _ROLL_ROT | 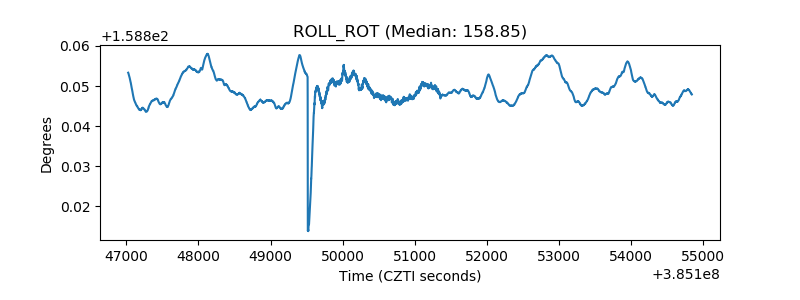 |
| _Roll_DEC | 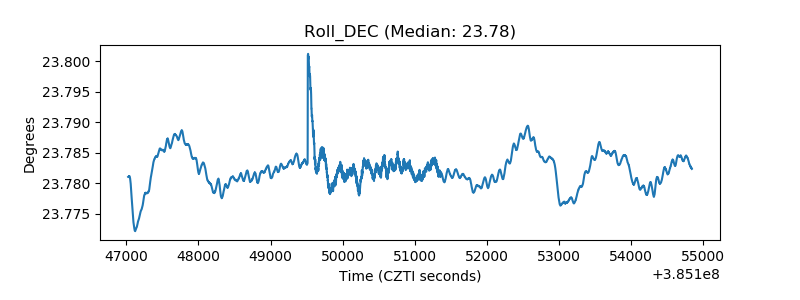 |
| _Roll_RA | 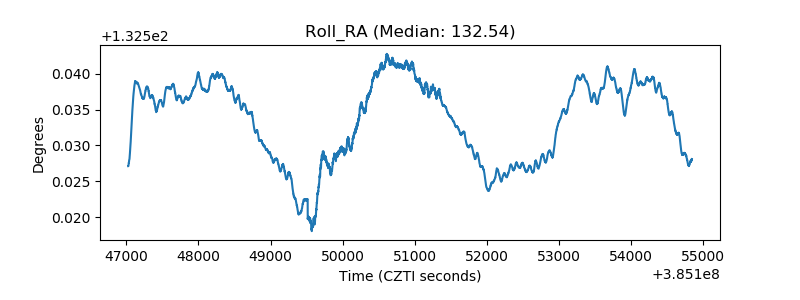 |
| Veto Counter | 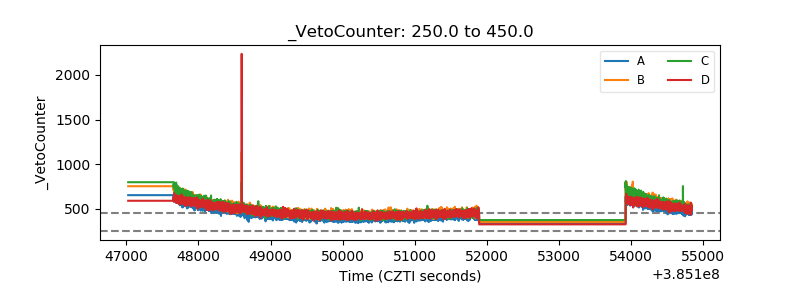 |