| Param | Original file | Final file |
|---|---|---|
| Filename | modeM0/AS1A11_047T09_9000005010_34955cztM0_level2.evt | modeM0/AS1A11_047T09_9000005010_34955cztM0_level2_quad_clean.evt |
| Size (bytes) | 509,987,520 | 87,528,960 |
| Size | 486.4 MB | 83.5 MB |
| Events in quadrant A | 2,623,757 | 596,791 |
| Events in quadrant B | 4,370,644 | 564,608 |
| Events in quadrant C | 2,838,465 | 583,382 |
| Events in quadrant D | 5,241,264 | 522,702 |
| Mode SS | |||
|---|---|---|---|
| Quadrant | BADHDUFLAG | Total packets | Discarded packets |
| A | 0 | 110 | 0 |
| B | 0 | 110 | 0 |
| C | 0 | 110 | 0 |
| D | 0 | 110 | 0 |
| Mode M0 | |||
|---|---|---|---|
| Quadrant | BADHDUFLAG | Total packets | Discarded packets |
| A | 0 | 11372 | 2 |
| B | 0 | 16573 | 1 |
| C | 0 | 11656 | 1 |
| D | 0 | 19412 | 1 |
| Mode M9 | |||
|---|---|---|---|
| Quadrant | BADHDUFLAG | Total packets | Discarded packets |
| A | 0 | 18 | 0 |
| B | 0 | 18 | 0 |
| C | 0 | 18 | 0 |
| D | 0 | 18 | 0 |
| Quadrant | Total seconds | Saturated seconds | Saturation percentage |
|---|---|---|---|
| A | 5472 | 7 | 0.127924% |
| B | 5472 | 550 | 10.051170% |
| C | 5472 | 24 | 0.438596% |
| D | 5472 | 521 | 9.521199% |
Noise dominated data is calculated using 1-second bins in cleaned event files. If a bin has >2000 counts, and if more than 50% of those come from <1% of pixels, then it is considered to be noise-dominated and hence unusable.
| Quadrant | # 1 sec bins | Bins with >0 counts | Bins with >2000 counts | High rate bins dominated by noise | Noise dominated (total time) | Noise dominated (detector-on time) | Marked lightcurve |
|---|---|---|---|---|---|---|---|
| A | 7265 | 5473 | 2 | 2 | 0.03% | 0.04% | 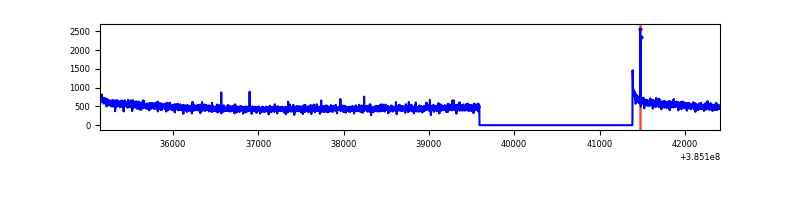 |
| B | 7265 | 5473 | 450 | 450 | 6.19% | 8.22% | 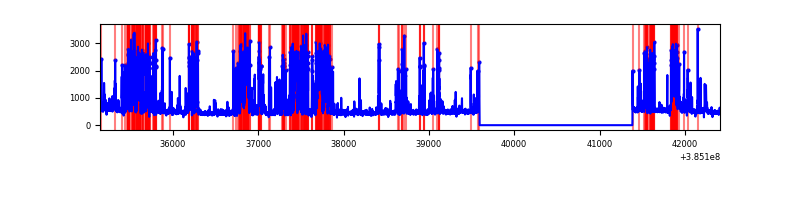 |
| C | 7265 | 5473 | 11 | 11 | 0.15% | 0.20% | 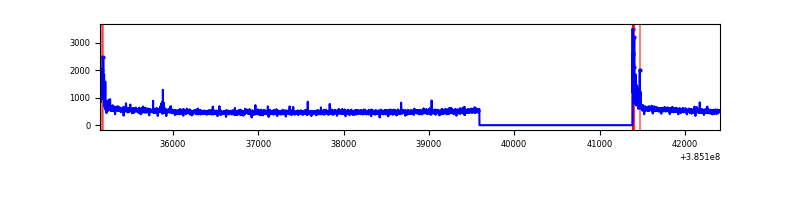 |
| D | 7264 | 5472 | 472 | 472 | 6.50% | 8.63% | 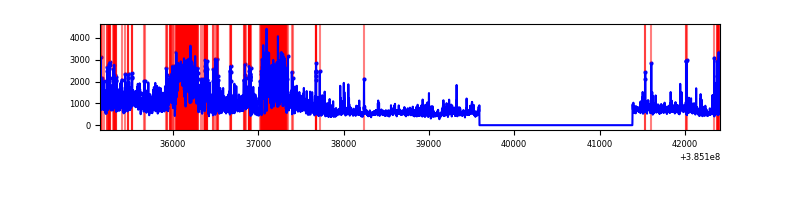 |
Top three noisy pixels from each quadrant. If the there are fewer than three noisy pixels in the level2.evt file, extra rows are filled as -1
| Pixel properties | Quadrant properties | ||||||
|---|---|---|---|---|---|---|---|
| Quadrant | DetID | PixID | Counts | Sigma | Mean | Median | Sigma |
| A | 10 | 83 | 62136 | 467.54 | 658 | 646 | 131.5 |
| A | 13 | 254 | 9763 | 69.32 | 658 | 646 | 131.5 |
| A | 13 | 6 | 7920 | 55.31 | 658 | 646 | 131.5 |
| B | 5 | 172 | 1589427 | 13325.15 | 622 | 607 | 119.2 |
| B | 0 | 190 | 243569 | 2037.68 | 622 | 607 | 119.2 |
| B | 4 | 81 | 53720 | 445.45 | 622 | 607 | 119.2 |
| C | 15 | 214 | 230376 | 1561.38 | 635 | 639 | 147.1 |
| C | 0 | 10 | 115560 | 781.04 | 635 | 639 | 147.1 |
| C | 14 | 67 | 6137 | 37.36 | 635 | 639 | 147.1 |
| D | 8 | 195 | 1134913 | 7582.52 | 616 | 600 | 149.6 |
| D | 12 | 233 | 549922 | 3672.04 | 616 | 600 | 149.6 |
| D | 10 | 118 | 469087 | 3131.68 | 616 | 600 | 149.6 |
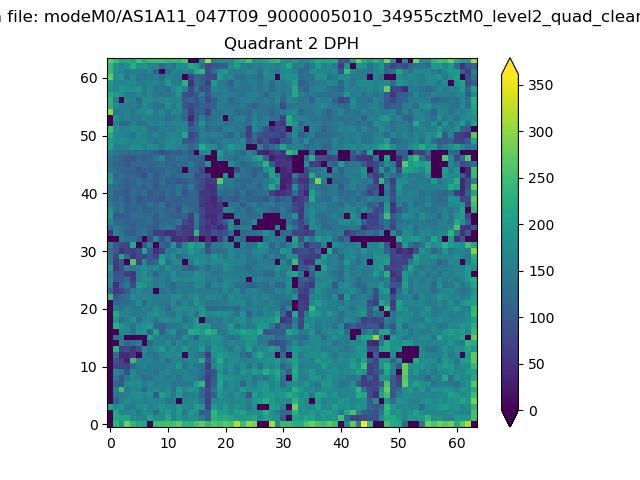
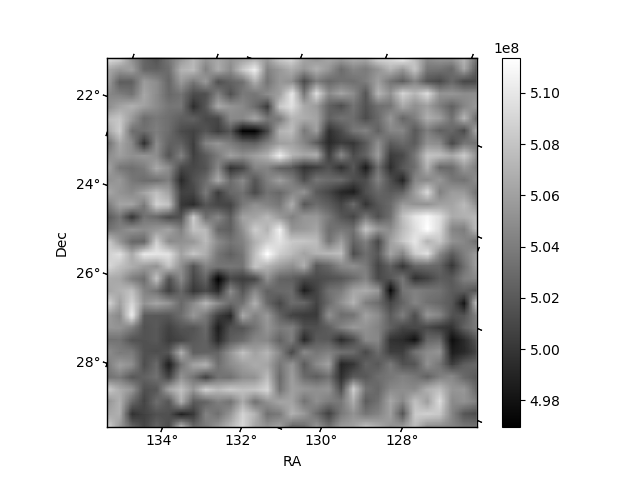
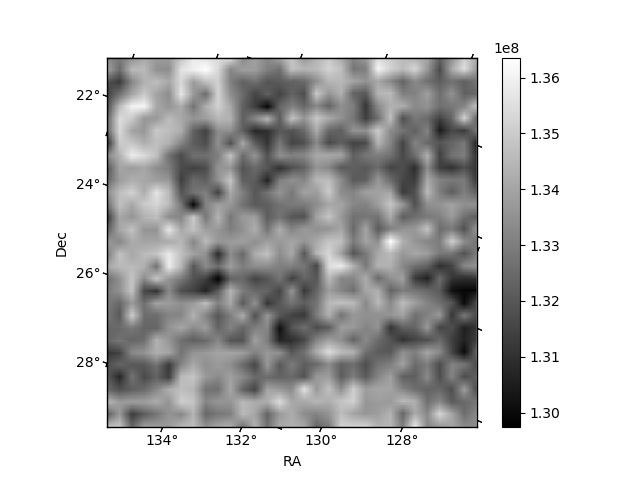
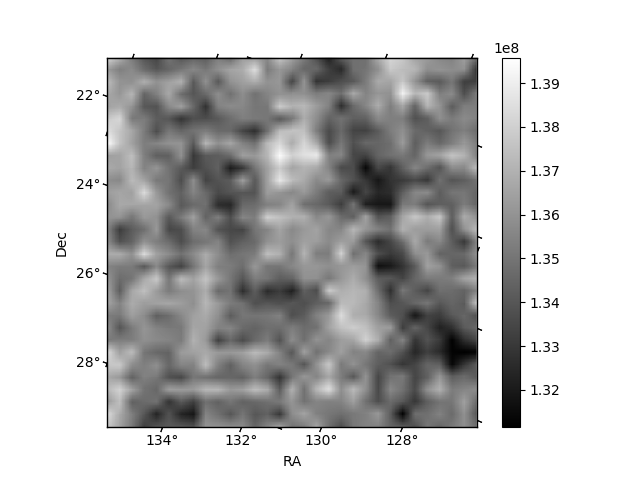
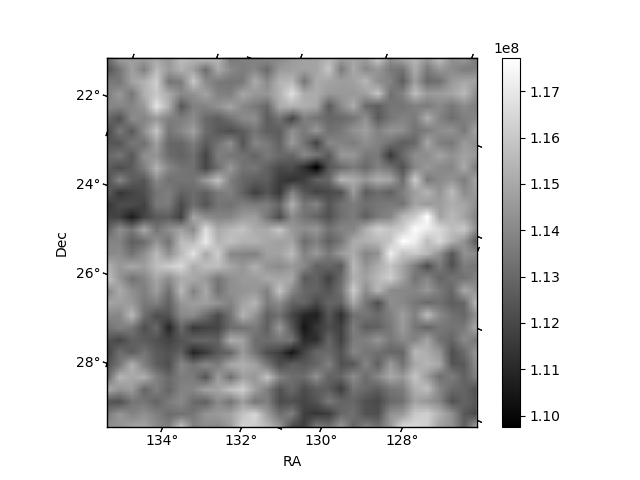
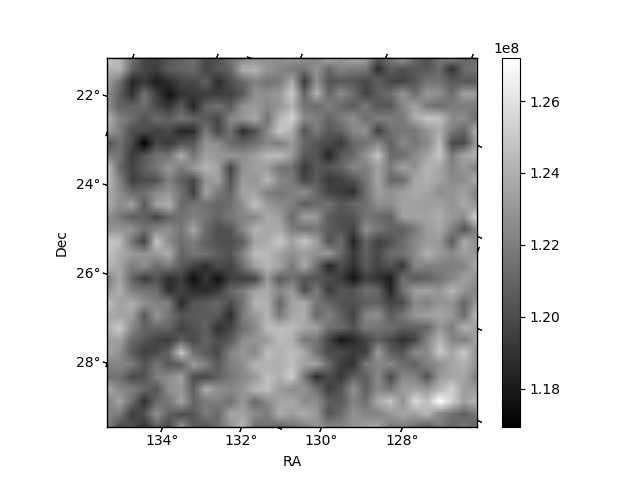
Histogram calculated using DETX and DETY for each event in the final _common_clean file
| Quadrant A | 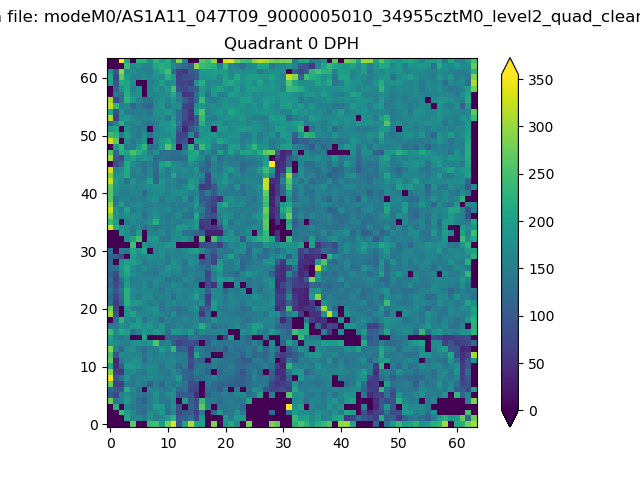 |
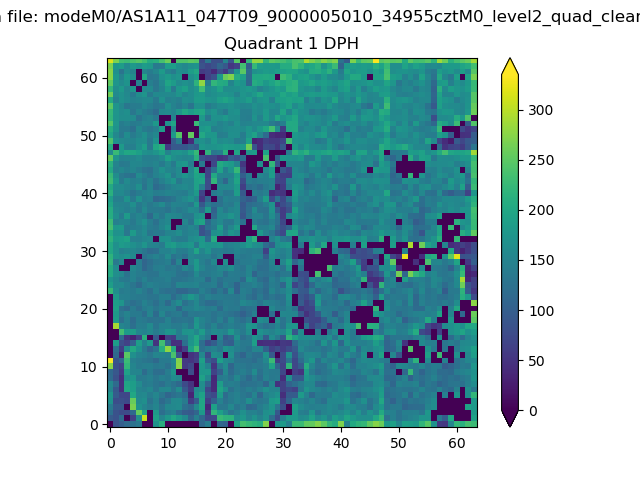 |
Quadrant B |
|---|---|---|---|
| Quadrant D | 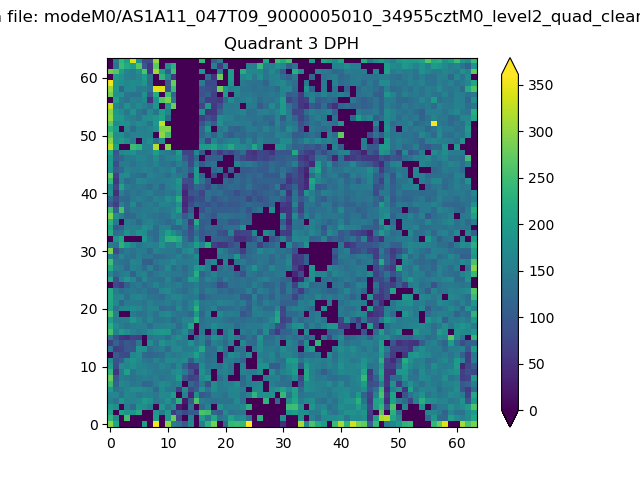 |
 |
Quadrant C |
| Plot type | Count rate plots | Images |
|---|---|---|
| Comparison with Poisson distribution Blue bars denote a histogram of data divided into 1 sec bins. Red curve is a Poisson curve with rate = median count rate of data. |
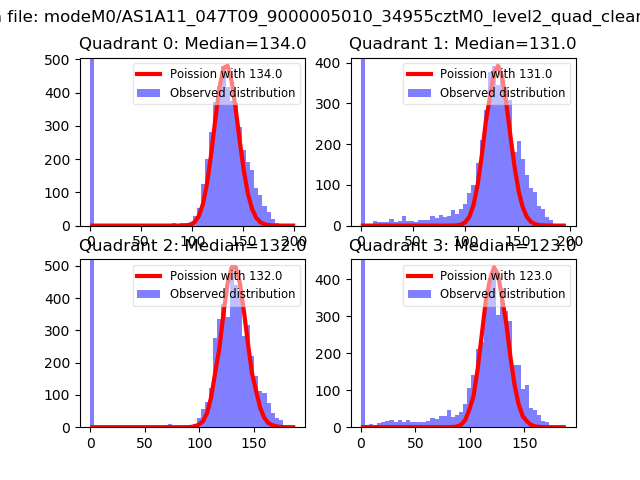 |
 |
| Quadrant-wise count rates Data is divided into 100 sec bins |
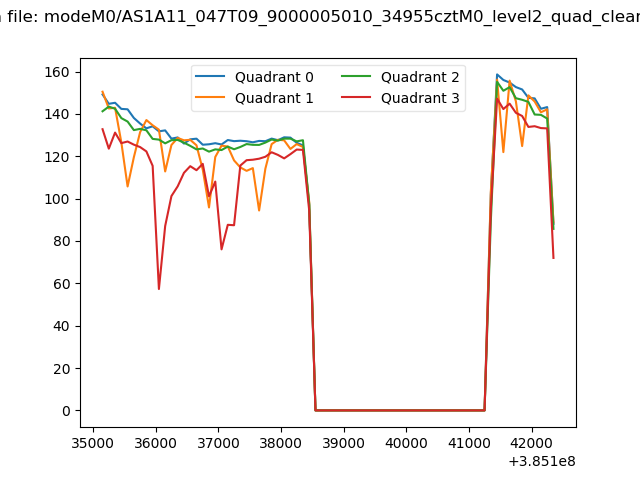 |
|
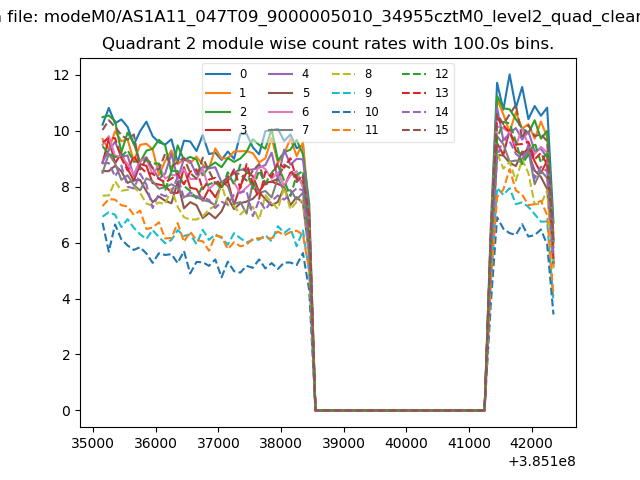
| Module-wise count rates for Quadrant A Data is divided into 100 sec bins |
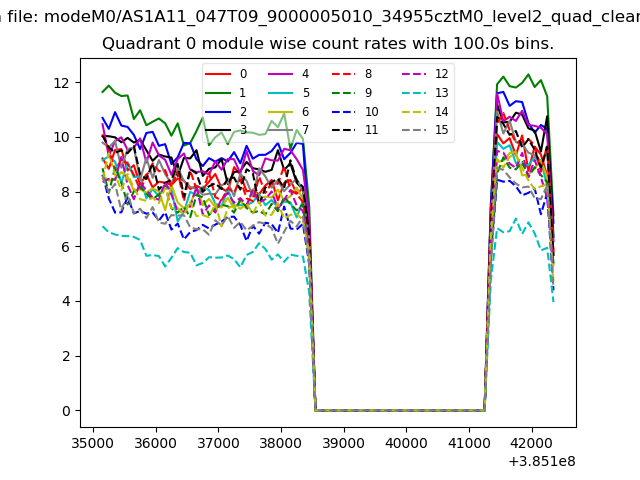 |
 |
| Module-wise count rates for Quadrant B Data is divided into 100 sec bins |
 |
 |
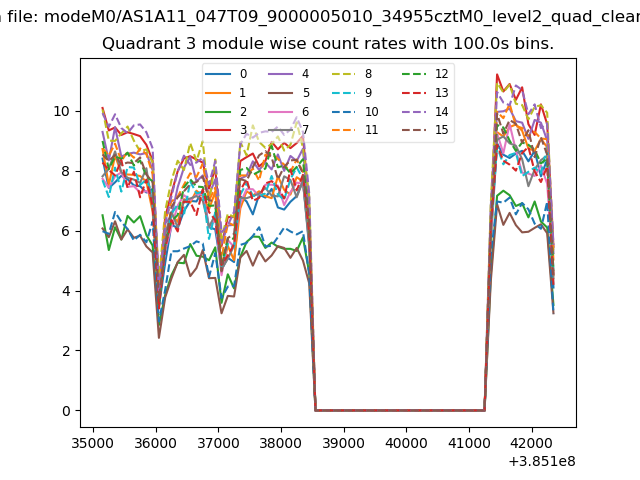
| Module-wise count rates for Quadrant C Data is divided into 100 sec bins |
 |
 |
| Module-wise count rates for Quadrant D Data is divided into 100 sec bins |
 |
 |
| Parameter | Plot |
|---|---|
| CZT HV Monitor | 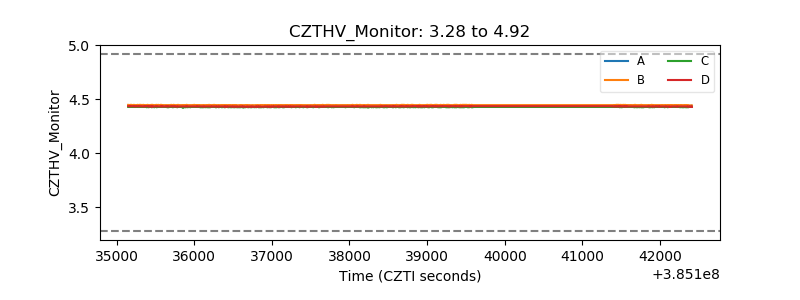 |
| D_VDD | 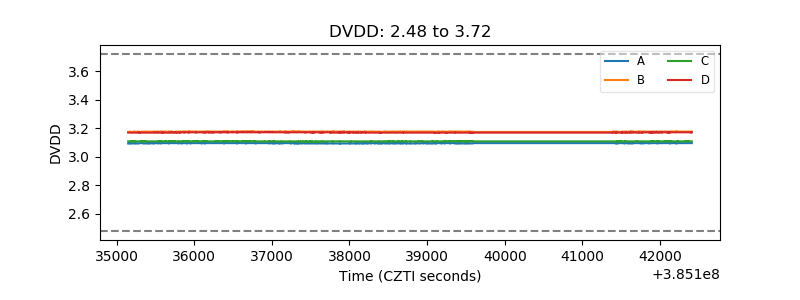 |
| Temperature 1 | 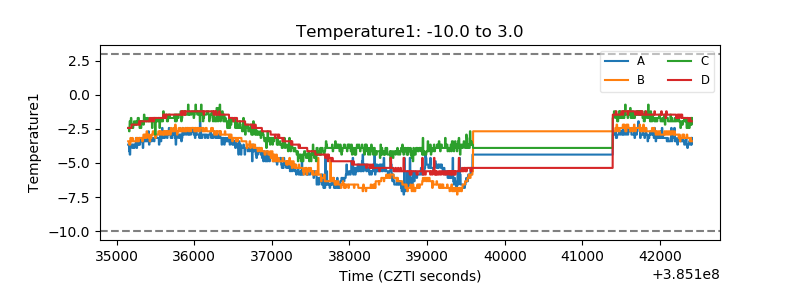 |
| Veto HV Monitor | 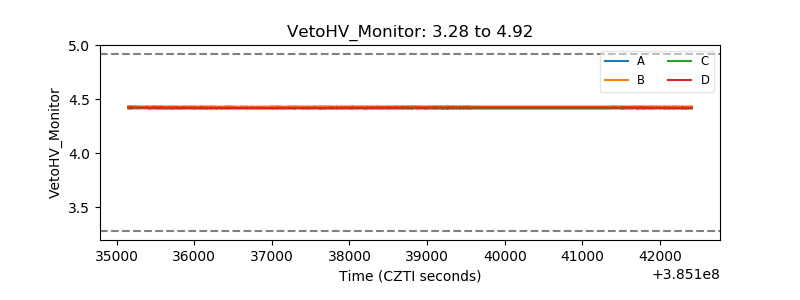 |
| Veto LLD | 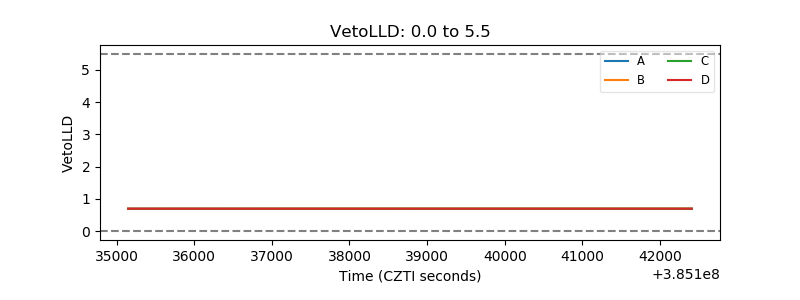 |
| Alpha Counter | 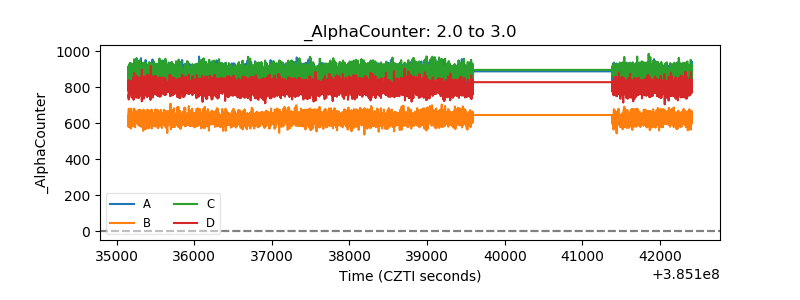 |
| _CPM_Rate | 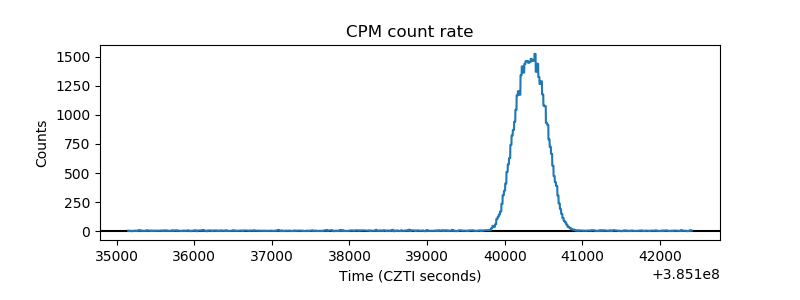 |
| CZT Counter | 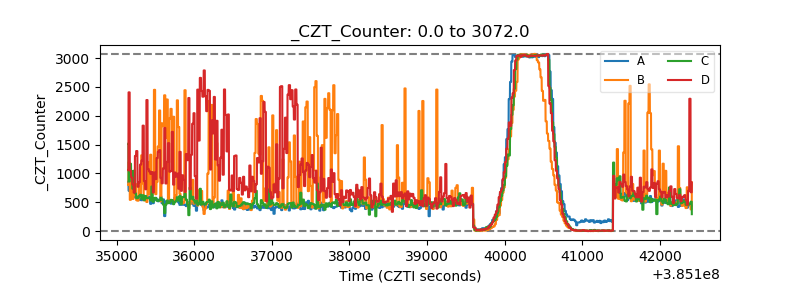 |
| +2.5 Volts monitor | 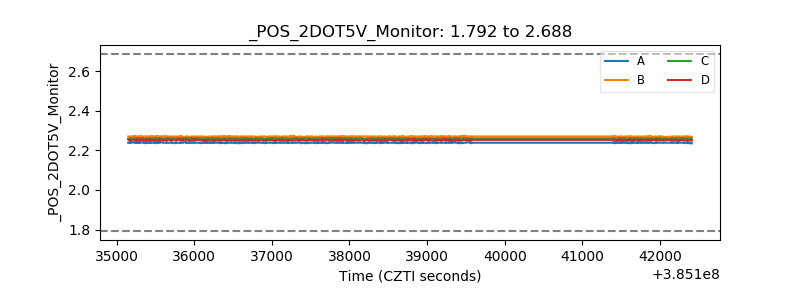 |
| +5 Volts monitor | 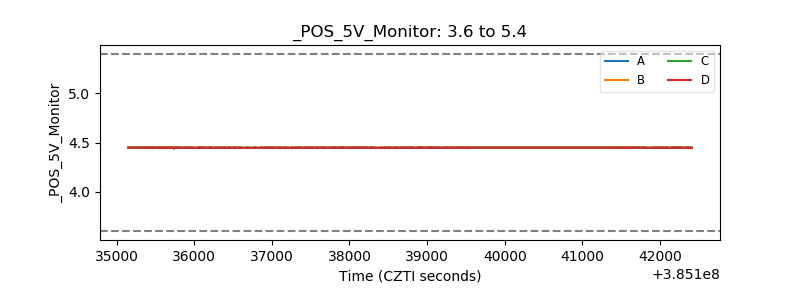 |
| _ROLL_ROT | 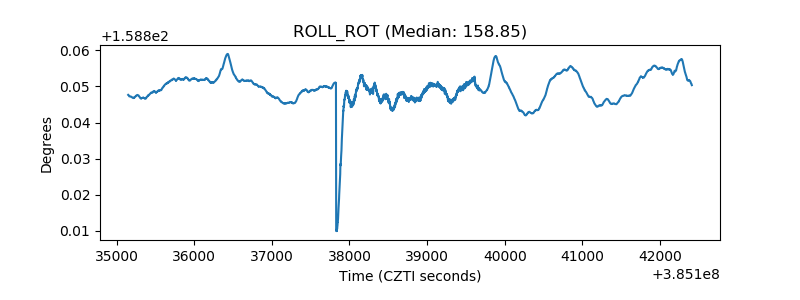 |
| _Roll_DEC | 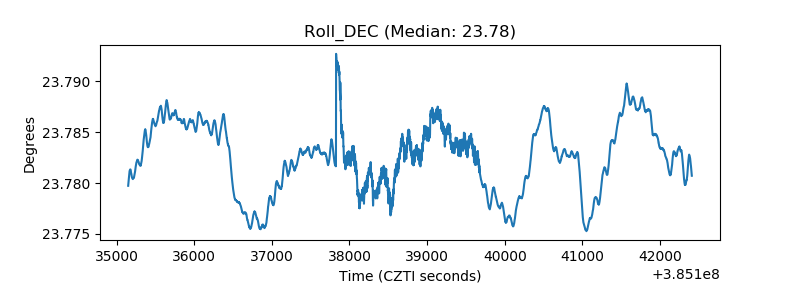 |
| _Roll_RA | 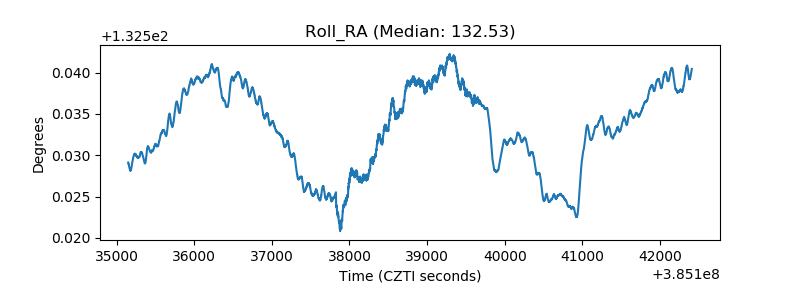 |
| Veto Counter | 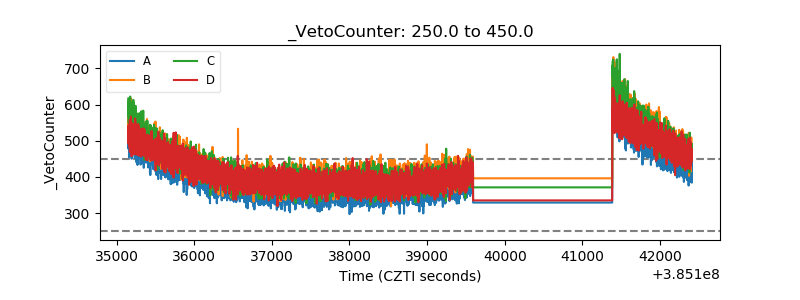 |