| Param | Original file | Final file |
|---|---|---|
| Filename | modeM0/AS1A11_047T09_9000005010cztM0_level2_bc.evt | modeM0/AS1A11_047T09_9000005010cztM0_level2_quad_clean.evt |
| Size (bytes) | 5,831,380,800 | 1,551,689,280 |
| Size | 5.4 GB | 1.4 GB |
| Events in quadrant A | 31,818,713 | 9,694,165 |
| Events in quadrant B | 43,337,034 | 9,804,518 |
| Events in quadrant C | 32,104,805 | 9,962,129 |
| Events in quadrant D | 60,987,598 | 9,113,995 |
| Mode SS | |||
|---|---|---|---|
| Quadrant | BADHDUFLAG | Total packets | Discarded packets |
| A | 0 | 2506 | 0 |
| B | 0 | 2506 | 0 |
| C | 0 | 2506 | 0 |
| D | 0 | 2506 | 0 |
| Mode M0 | |||
|---|---|---|---|
| Quadrant | BADHDUFLAG | Total packets | Discarded packets |
| A | 0 | 303670 | 0 |
| B | 0 | 326709 | 0 |
| C | 0 | 260156 | 0 |
| D | 0 | 373240 | 0 |
| Mode M9 | |||
|---|---|---|---|
| Quadrant | BADHDUFLAG | Total packets | Discarded packets |
| A | 0 | 467 | 0 |
| B | 0 | 467 | 0 |
| C | 0 | 467 | 0 |
| D | 0 | 467 | 0 |
| Quadrant | Total seconds | Saturated seconds | Saturation percentage |
|---|---|---|---|
| A | 122904 | 8378 | 6.816702% |
| B | 122904 | 7522 | 6.120224% |
| C | 122904 | 791 | 0.643592% |
| D | 122904 | 5901 | 4.801308% |
Noise dominated data is calculated using 1-second bins in cleaned event files. If a bin has >2000 counts, and if more than 50% of those come from <1% of pixels, then it is considered to be noise-dominated and hence unusable.
| Quadrant | # 1 sec bins | Bins with >0 counts | Bins with >2000 counts | High rate bins dominated by noise | Noise dominated (total time) | Noise dominated (detector-on time) | Marked lightcurve |
|---|---|---|---|---|---|---|---|
| A | 169303 | 122926 | 12 | 12 | 0.01% | 0.01% | 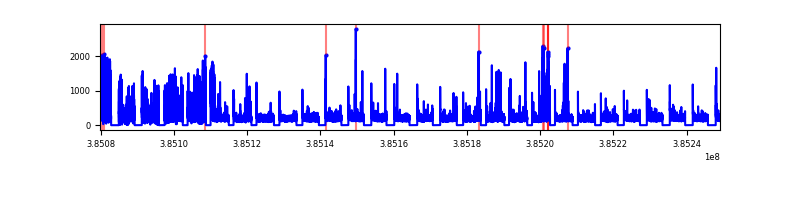 |
| B | 169303 | 122905 | 292 | 292 | 0.17% | 0.24% | 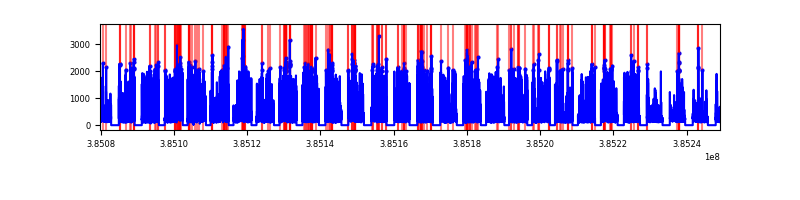 |
| C | 169303 | 122908 | 58 | 58 | 0.03% | 0.05% | 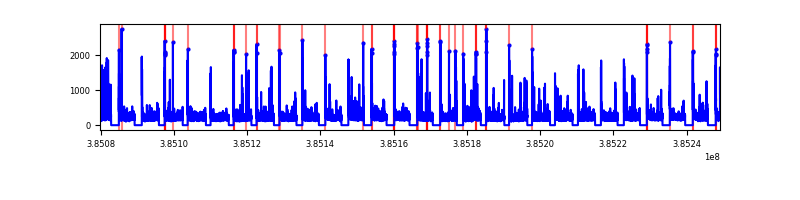 |
| D | 169303 | 122904 | 835 | 835 | 0.49% | 0.68% |  |
Top three noisy pixels from each quadrant. If the there are fewer than three noisy pixels in the level2.evt file, extra rows are filled as -1
| Pixel properties | Quadrant properties | ||||||
|---|---|---|---|---|---|---|---|
| Quadrant | DetID | PixID | Counts | Sigma | Mean | Median | Sigma |
| A | 15 | 169 | 6010095 | 4545.39 | 6050 | 5953 | 1320.9 |
| A | 10 | 83 | 1049296 | 789.85 | 6050 | 5953 | 1320.9 |
| A | 15 | 223 | 708556 | 531.9 | 6050 | 5953 | 1320.9 |
| B | 5 | 172 | 13581509 | 11159.09 | 6204 | 6068 | 1216.5 |
| B | 5 | 31 | 1640534 | 1343.54 | 6204 | 6068 | 1216.5 |
| B | 0 | 190 | 1223022 | 1000.34 | 6204 | 6068 | 1216.5 |
| C | 15 | 214 | 4852169 | 3410.08 | 6211 | 6157 | 1421.1 |
| C | 0 | 10 | 1784670 | 1251.52 | 6211 | 6157 | 1421.1 |
| C | 12 | 250 | 423341 | 293.57 | 6211 | 6157 | 1421.1 |
| D | 8 | 195 | 18682593 | 12846.81 | 6117 | 5930 | 1453.8 |
| D | 13 | 249 | 3301664 | 2266.98 | 6117 | 5930 | 1453.8 |
| D | 1 | 52 | 2742015 | 1882.03 | 6117 | 5930 | 1453.8 |
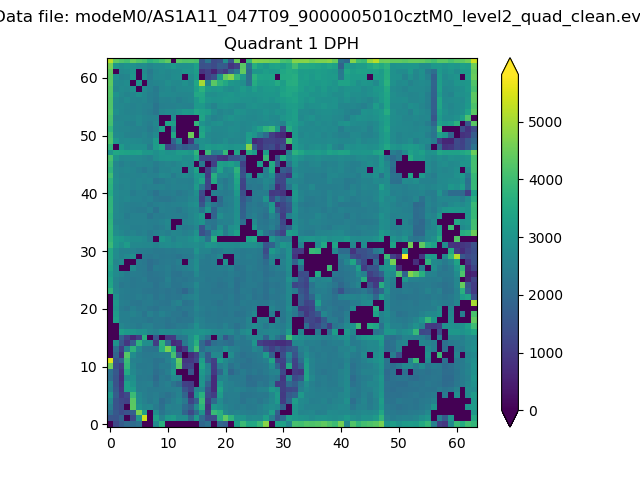
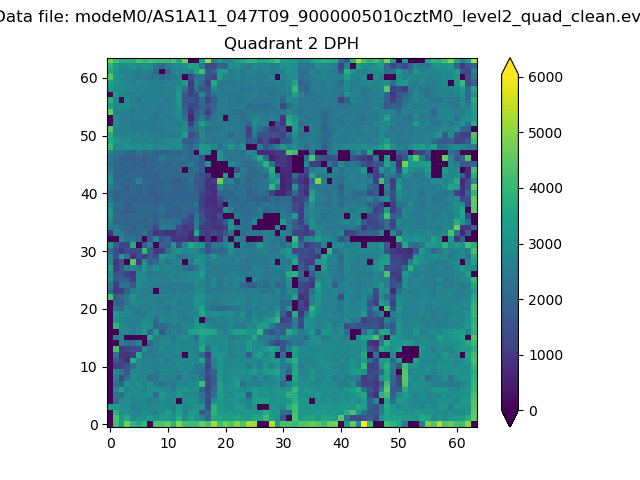
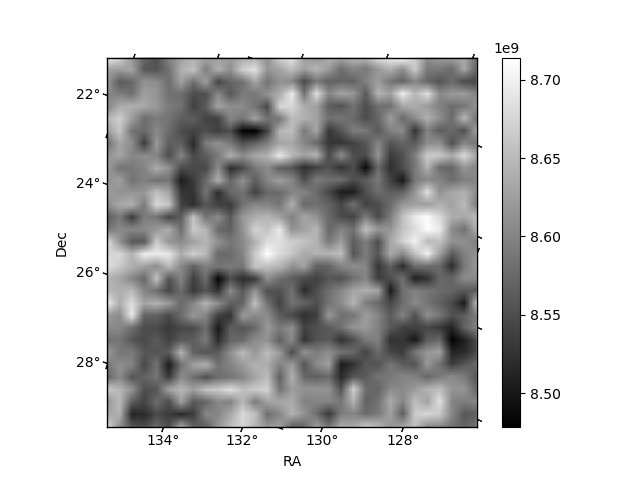
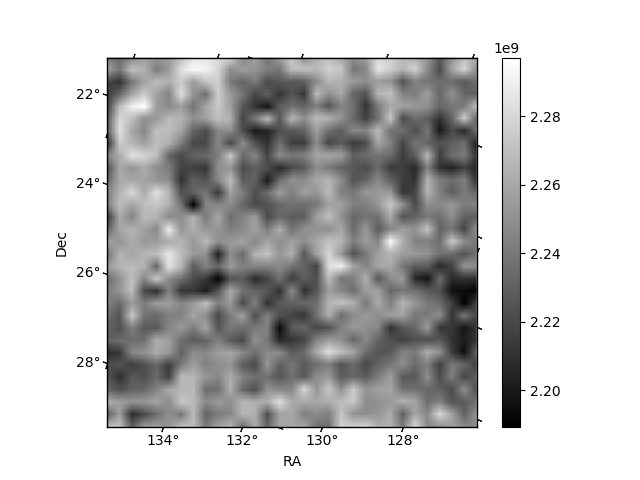
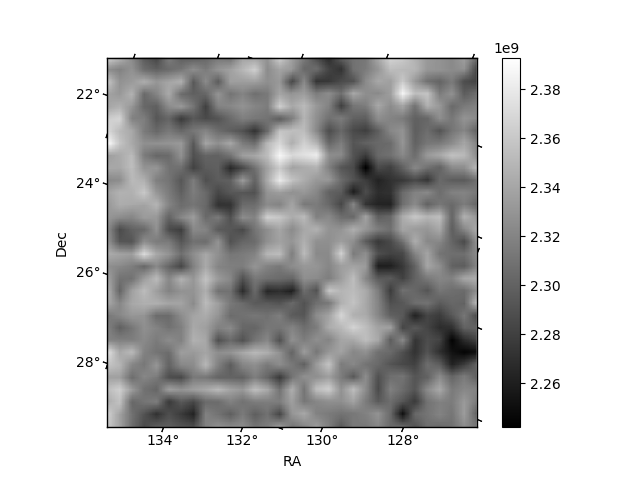
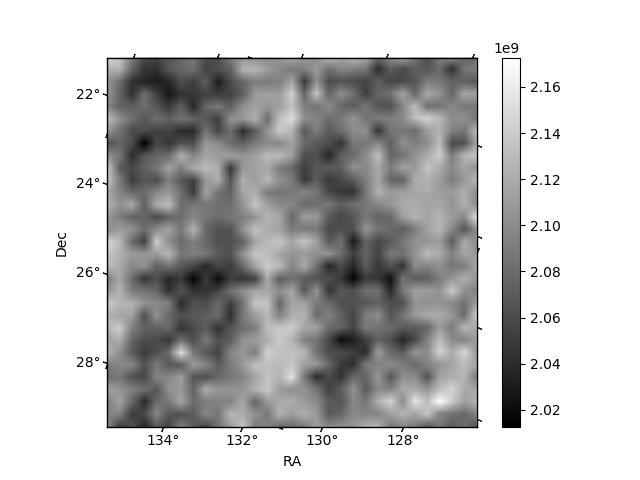
Histogram calculated using DETX and DETY for each event in the final _common_clean file
| Quadrant A | 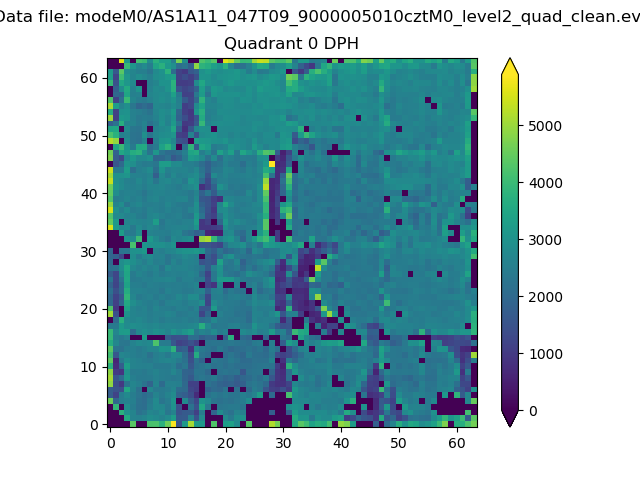 |
 |
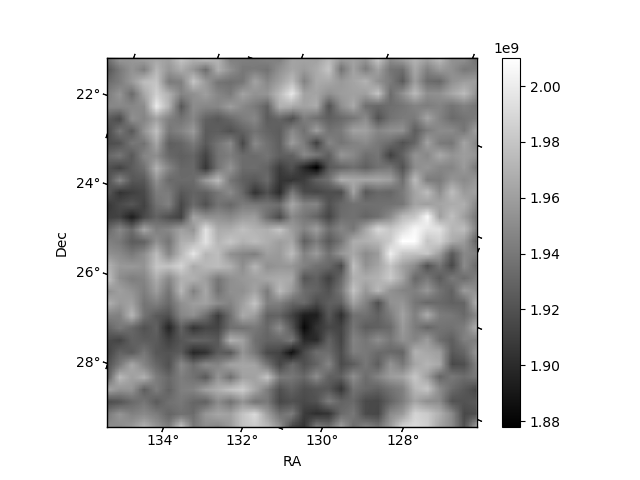
Quadrant B |
|---|---|---|---|
| Quadrant D | 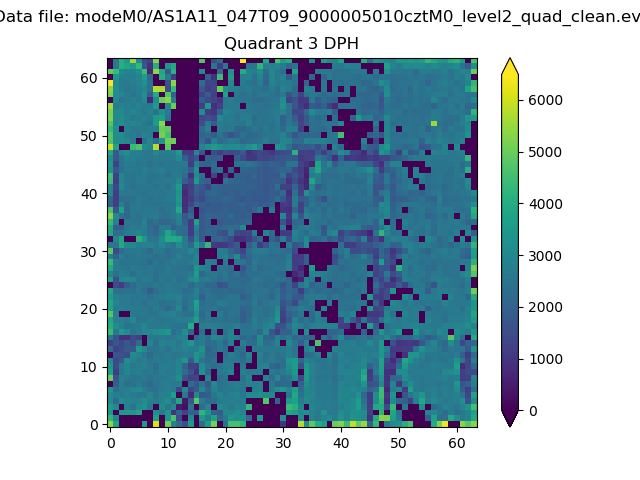 |
 |
Quadrant C |
| Plot type | Count rate plots | Images |
|---|---|---|
| Comparison with Poisson distribution Blue bars denote a histogram of data divided into 1 sec bins. Red curve is a Poisson curve with rate = median count rate of data. |
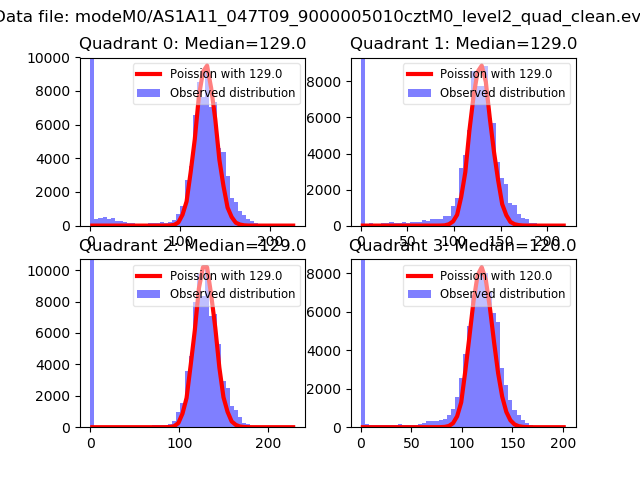 |
 |
| Quadrant-wise count rates Data is divided into 100 sec bins |
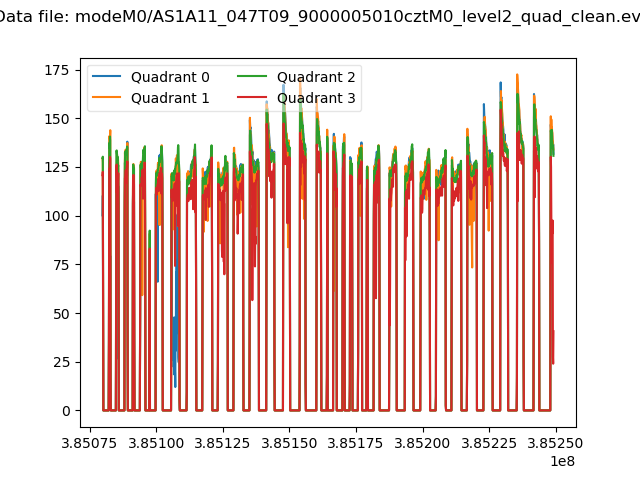 |
|
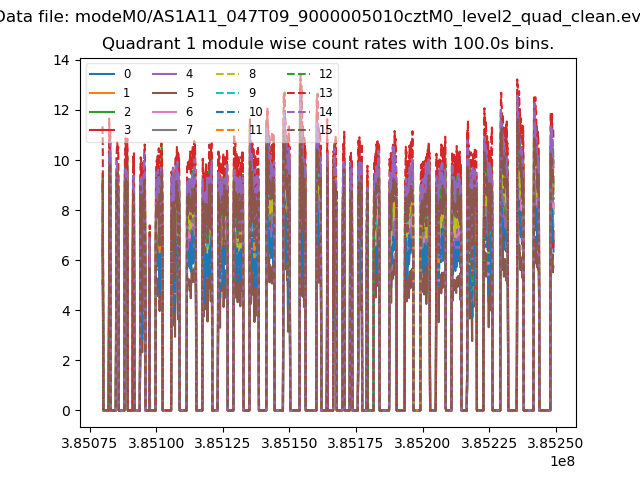
| Module-wise count rates for Quadrant A Data is divided into 100 sec bins |
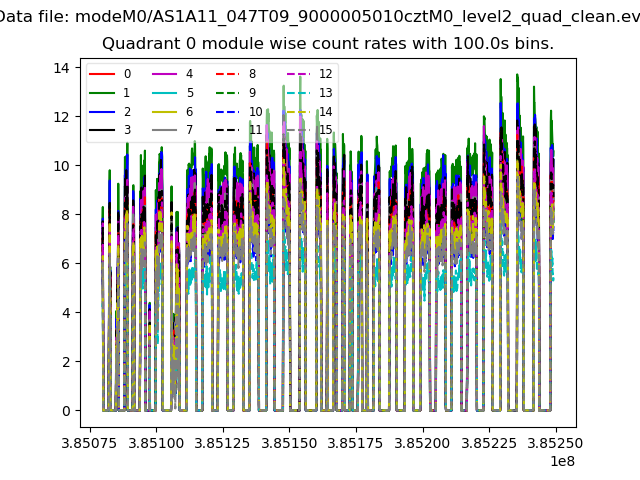 |
 |
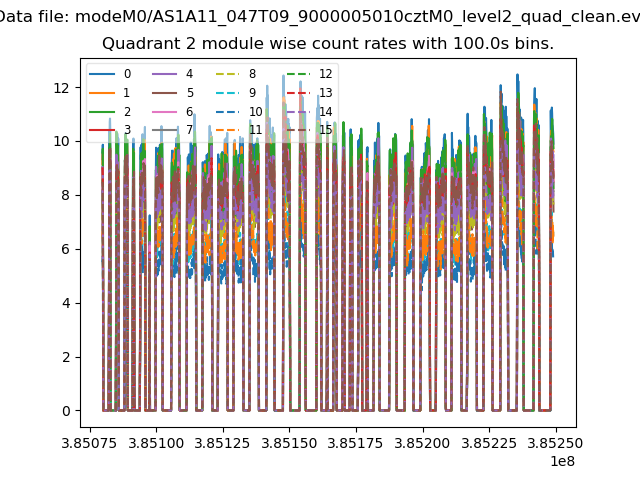
| Module-wise count rates for Quadrant B Data is divided into 100 sec bins |
 |
 |
| Module-wise count rates for Quadrant C Data is divided into 100 sec bins |
 |
 |
| Module-wise count rates for Quadrant D Data is divided into 100 sec bins |
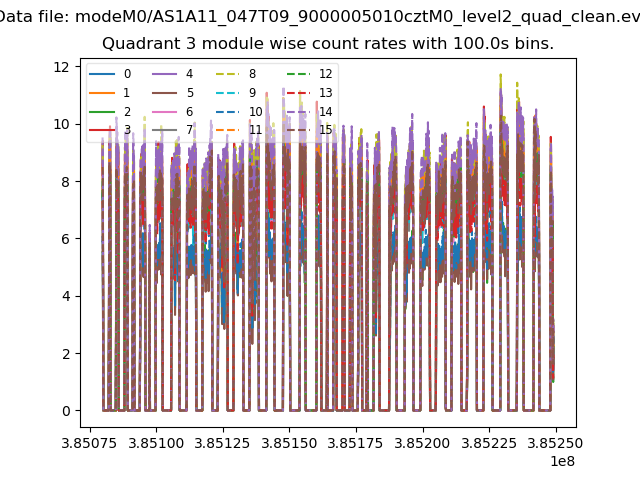 |
 |
| Parameter | Plot |
|---|---|
| CZT HV Monitor | 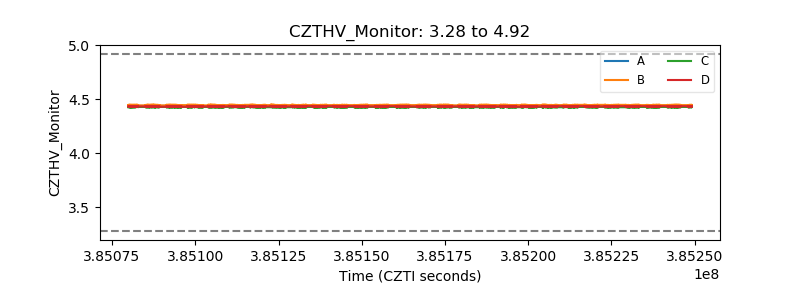 |
| D_VDD | 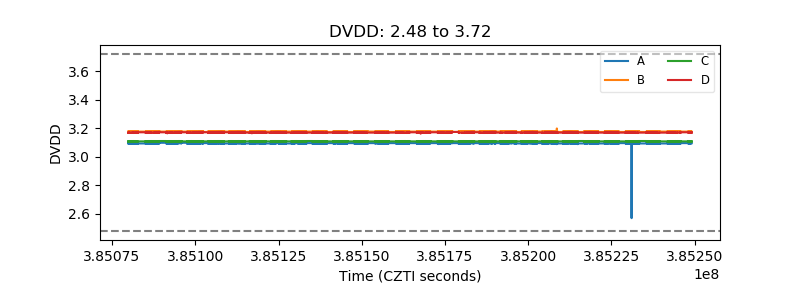 |
| Temperature 1 | 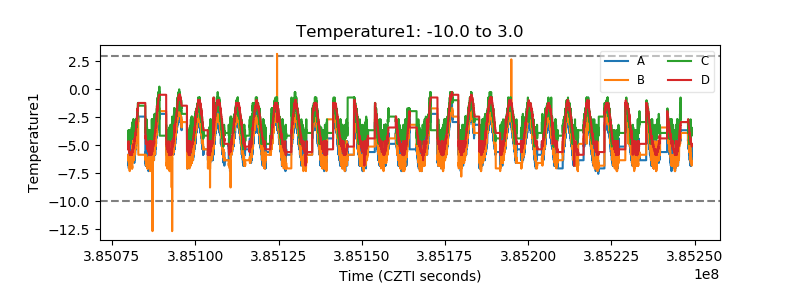 |
| Veto HV Monitor | 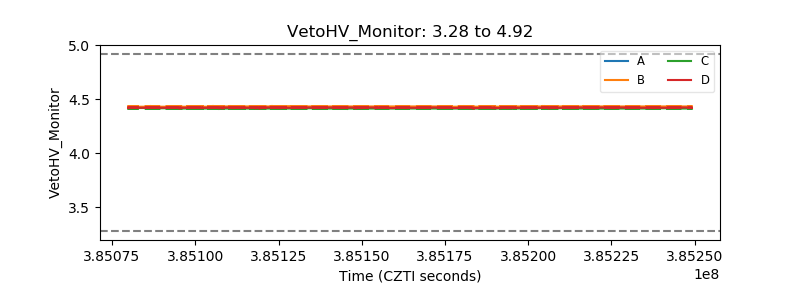 |
| Veto LLD | 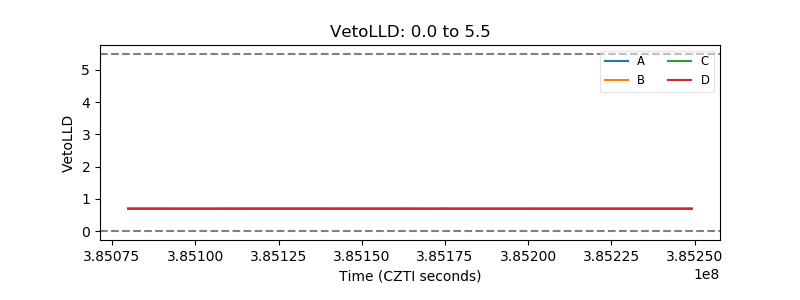 |
| Alpha Counter | 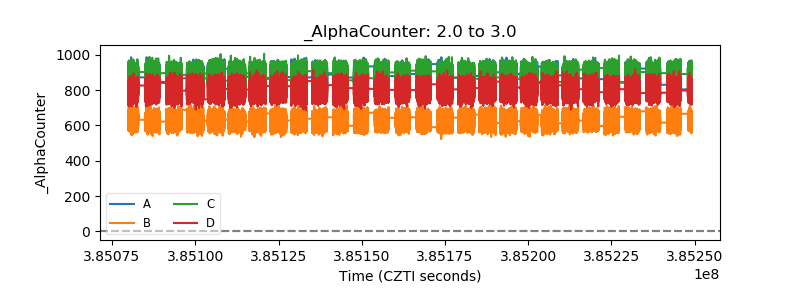 |
| _CPM_Rate | 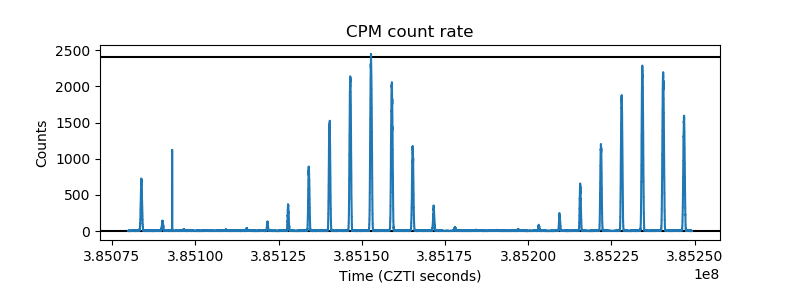 |
| CZT Counter | 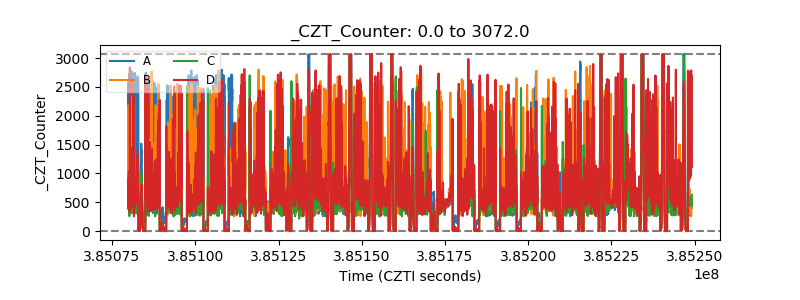 |
| +2.5 Volts monitor | 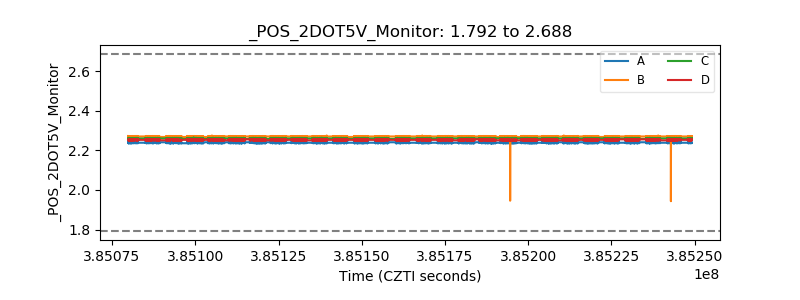 |
| +5 Volts monitor | 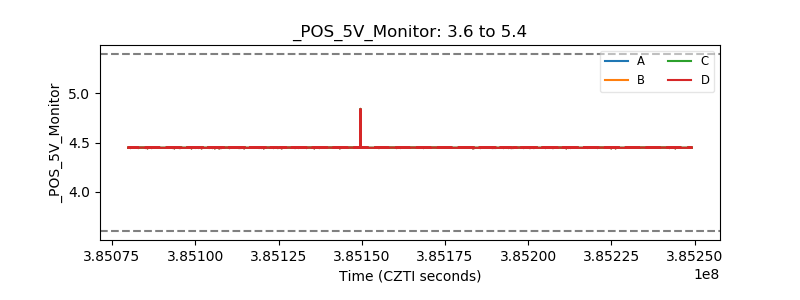 |
| _ROLL_ROT | 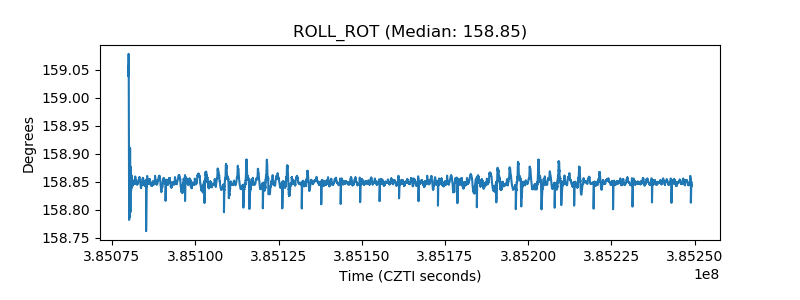 |
| _Roll_DEC | 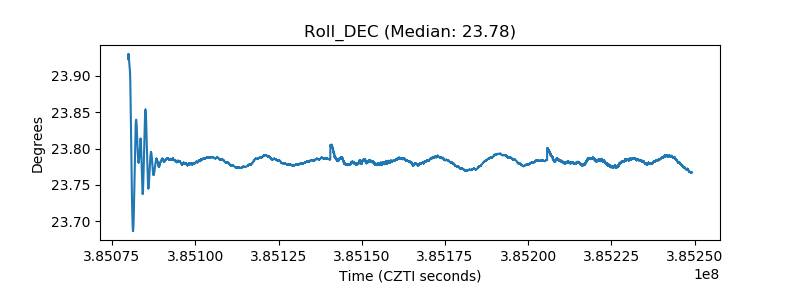 |
| _Roll_RA | 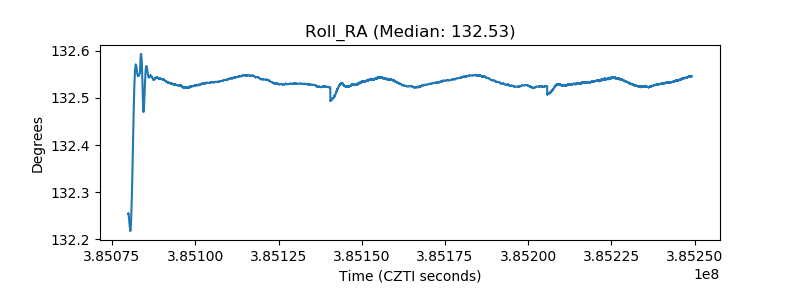 |
| Veto Counter | 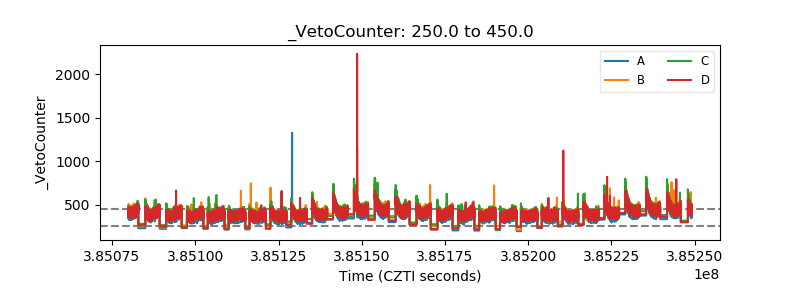 |