| Param | Original file | Final file |
|---|---|---|
| Filename | modeM0/AS1A11_065T12_9000005004_34937cztM0_level2.evt | modeM0/AS1A11_065T12_9000005004_34937cztM0_level2_quad_clean.evt |
| Size (bytes) | 945,014,400 | 133,283,520 |
| Size | 901.2 MB | 127.1 MB |
| Events in quadrant A | 11,233,982 | 791,004 |
| Events in quadrant B | 5,214,608 | 901,329 |
| Events in quadrant C | 4,622,511 | 893,272 |
| Events in quadrant D | 6,934,482 | 818,418 |
| Mode M9 | |||
|---|---|---|---|
| Quadrant | BADHDUFLAG | Total packets | Discarded packets |
| A | 0 | 21 | 0 |
| B | 0 | 21 | 0 |
| C | 0 | 21 | 0 |
| D | 0 | 22 | 0 |
| Mode SS | |||
|---|---|---|---|
| Quadrant | BADHDUFLAG | Total packets | Discarded packets |
| A | 0 | 184 | 0 |
| B | 0 | 184 | 0 |
| C | 0 | 184 | 0 |
| D | 0 | 184 | 0 |
| Mode M0 | |||
|---|---|---|---|
| Quadrant | BADHDUFLAG | Total packets | Discarded packets |
| A | 0 | 39504 | 2 |
| B | 0 | 21495 | 2 |
| C | 0 | 19075 | 2 |
| D | 0 | 26876 | 2 |
| Quadrant | Total seconds | Saturated seconds | Saturation percentage |
|---|---|---|---|
| A | 9104 | 2624 | 28.822496% |
| B | 9104 | 197 | 2.163884% |
| C | 9104 | 67 | 0.735940% |
| D | 9104 | 411 | 4.514499% |
Noise dominated data is calculated using 1-second bins in cleaned event files. If a bin has >2000 counts, and if more than 50% of those come from <1% of pixels, then it is considered to be noise-dominated and hence unusable.
| Quadrant | # 1 sec bins | Bins with >0 counts | Bins with >2000 counts | High rate bins dominated by noise | Noise dominated (total time) | Noise dominated (detector-on time) | Marked lightcurve |
|---|---|---|---|---|---|---|---|
| A | 10416 | 9104 | 2325 | 2325 | 22.32% | 25.54% | 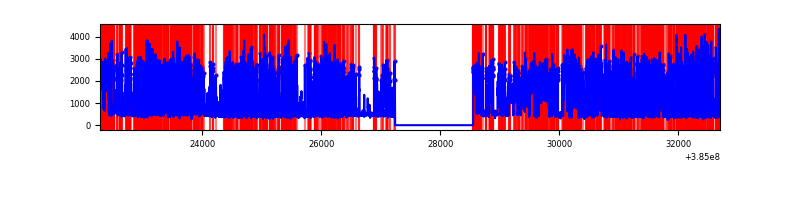 |
| B | 10417 | 9105 | 135 | 135 | 1.30% | 1.48% | 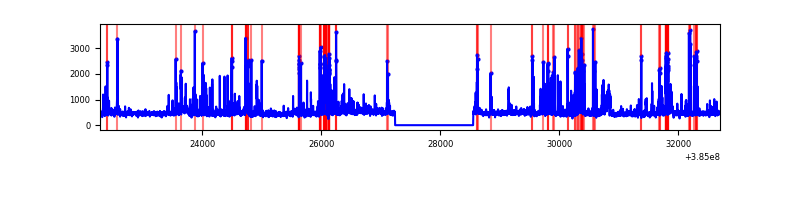 |
| C | 10417 | 9105 | 58 | 58 | 0.56% | 0.64% | 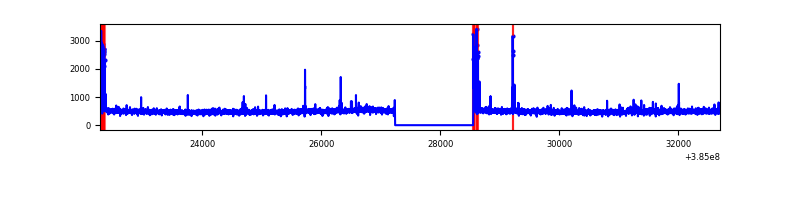 |
| D | 10417 | 9105 | 338 | 338 | 3.24% | 3.71% | 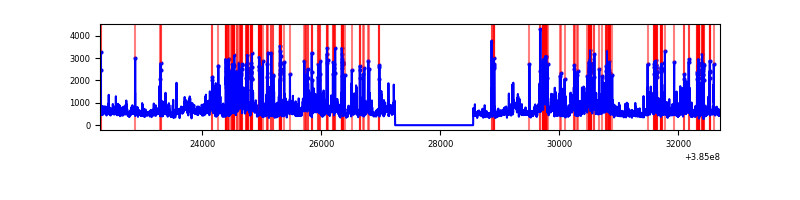 |
Top three noisy pixels from each quadrant. If the there are fewer than three noisy pixels in the level2.evt file, extra rows are filled as -1
| Pixel properties | Quadrant properties | ||||||
|---|---|---|---|---|---|---|---|
| Quadrant | DetID | PixID | Counts | Sigma | Mean | Median | Sigma |
| A | 15 | 169 | 7535487 | 39999.81 | 930 | 913 | 188.4 |
| A | 10 | 83 | 64214 | 336.05 | 930 | 913 | 188.4 |
| A | 13 | 6 | 17919 | 90.28 | 930 | 913 | 188.4 |
| B | 5 | 172 | 836157 | 4230.53 | 1022 | 992 | 197.4 |
| B | 0 | 190 | 194894 | 982.21 | 1022 | 992 | 197.4 |
| B | 4 | 232 | 130044 | 653.71 | 1022 | 992 | 197.4 |
| C | 15 | 214 | 378575 | 1621.15 | 1007 | 1013 | 232.9 |
| C | 0 | 10 | 192001 | 820.05 | 1007 | 1013 | 232.9 |
| C | 14 | 67 | 41238 | 172.72 | 1007 | 1013 | 232.9 |
| D | 8 | 195 | 1184888 | 4917.03 | 987 | 959 | 240.8 |
| D | 7 | 38 | 394793 | 1635.65 | 987 | 959 | 240.8 |
| D | 10 | 118 | 348023 | 1441.41 | 987 | 959 | 240.8 |
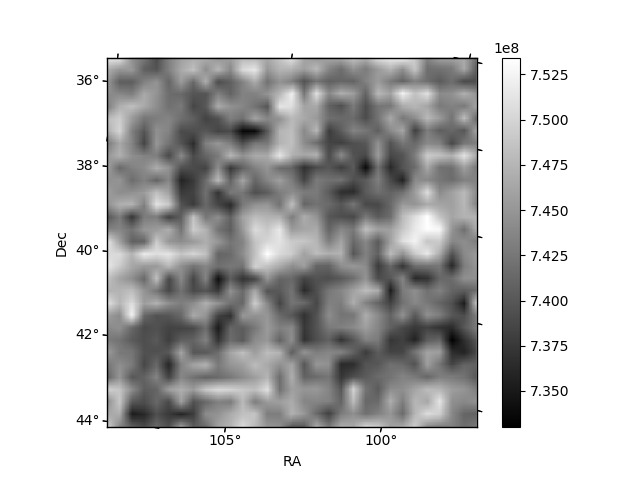
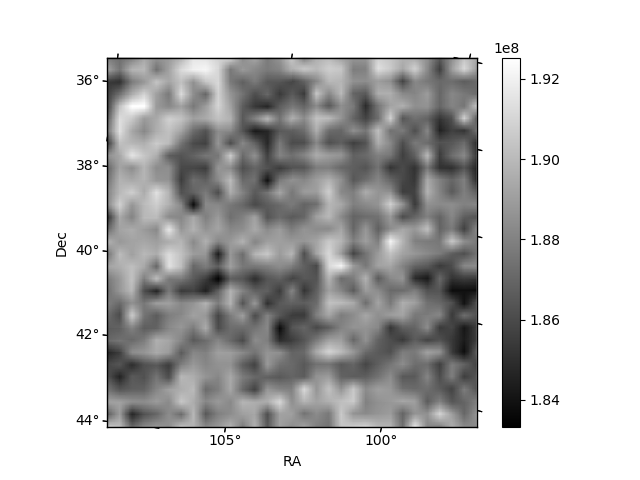
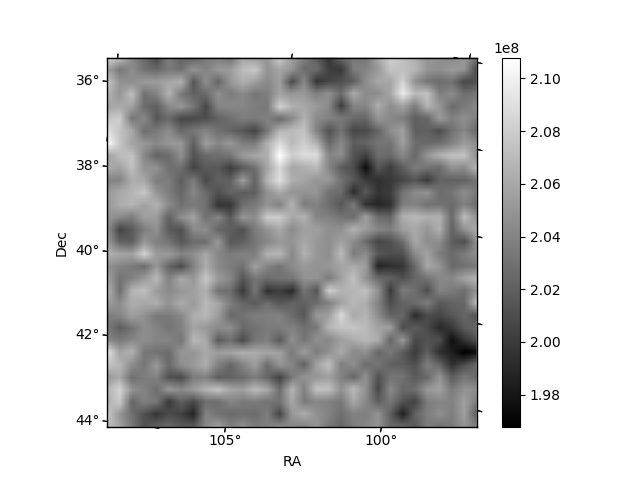
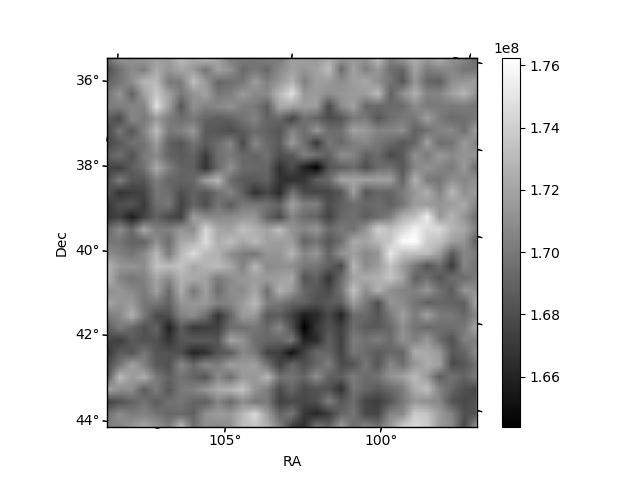
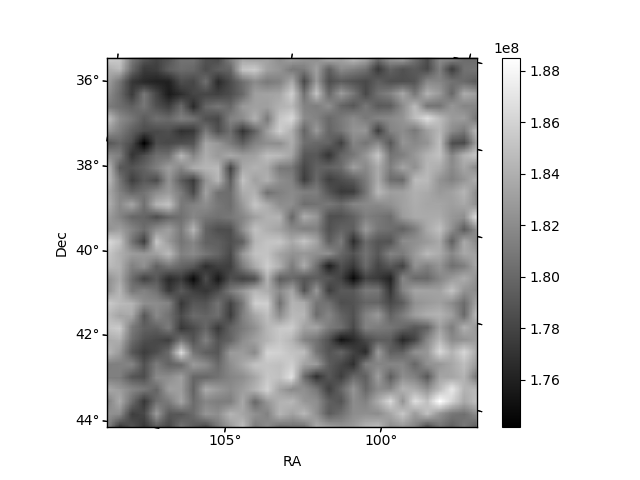
Histogram calculated using DETX and DETY for each event in the final _common_clean file
| Quadrant A | 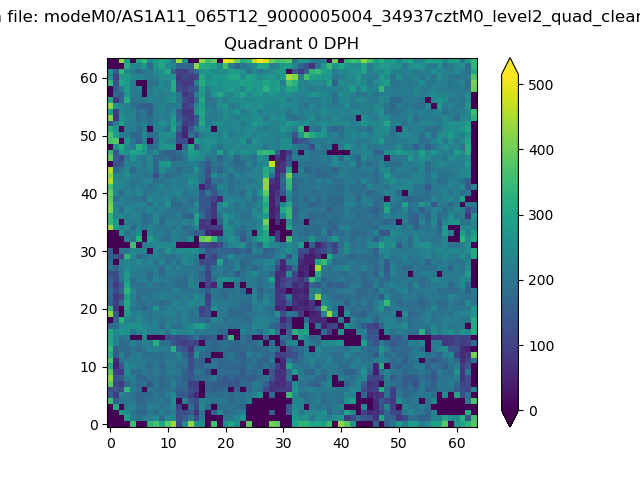 |
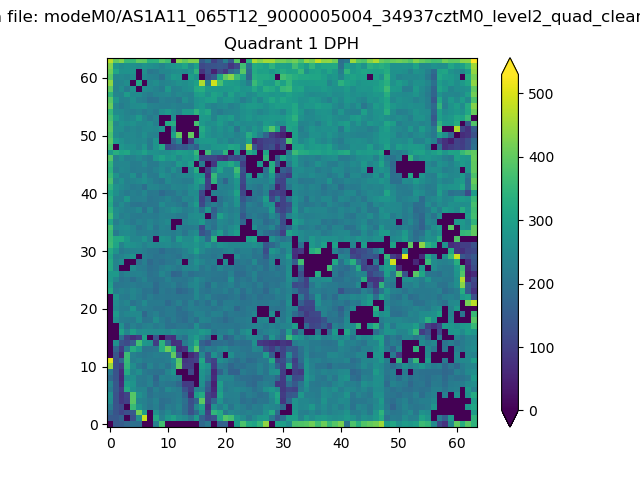 |
Quadrant B |
|---|---|---|---|
| Quadrant D | 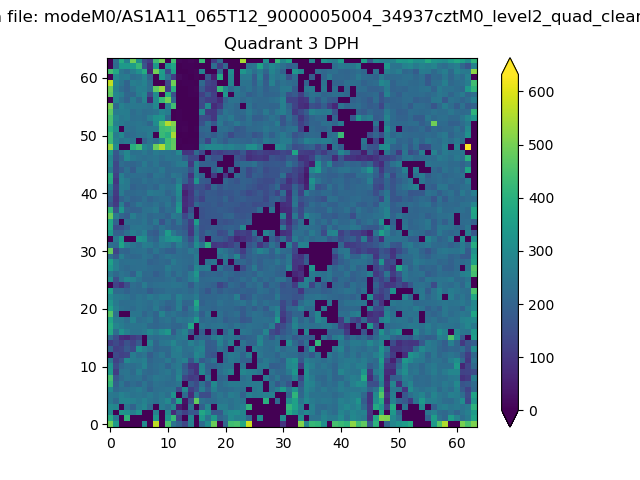 |
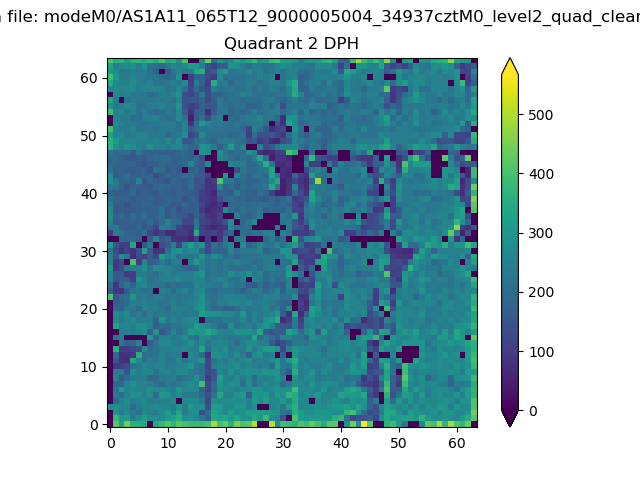 |
Quadrant C |
| Plot type | Count rate plots | Images |
|---|---|---|
| Comparison with Poisson distribution Blue bars denote a histogram of data divided into 1 sec bins. Red curve is a Poisson curve with rate = median count rate of data. |
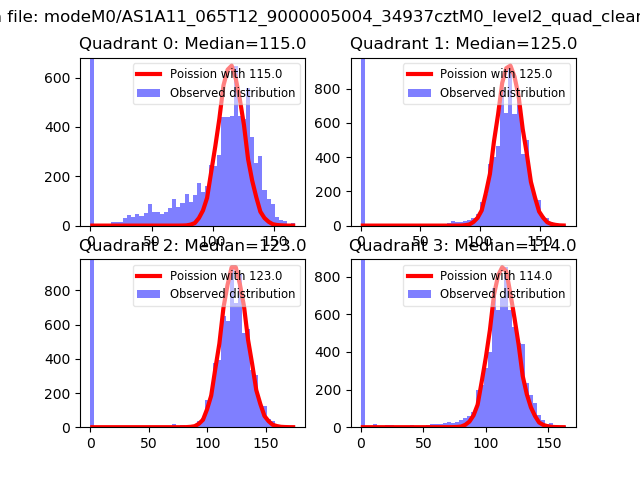 |
 |
| Quadrant-wise count rates Data is divided into 100 sec bins |
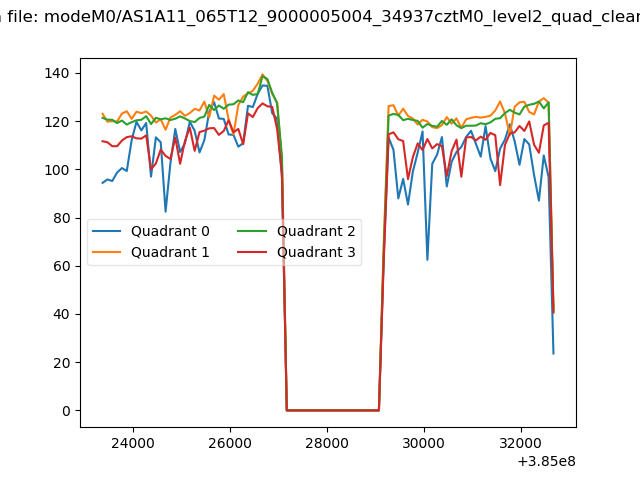 |
|
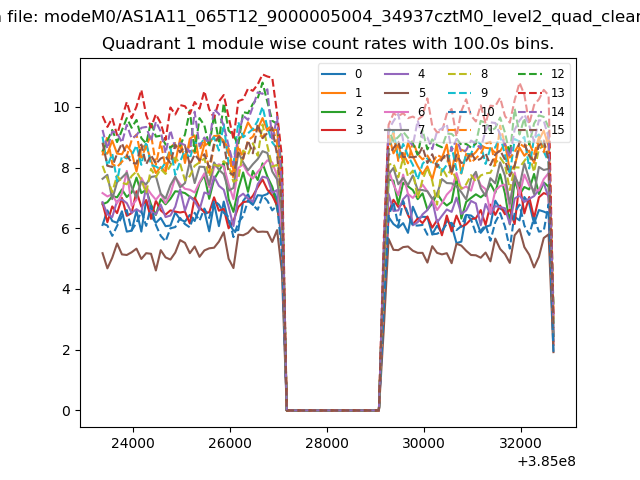
| Module-wise count rates for Quadrant A Data is divided into 100 sec bins |
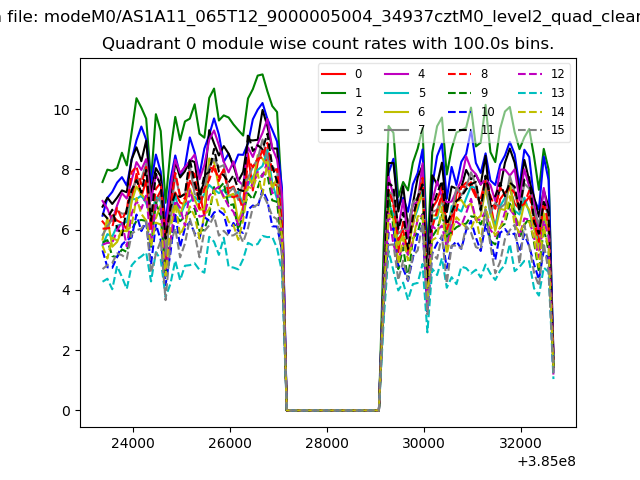 |
 |
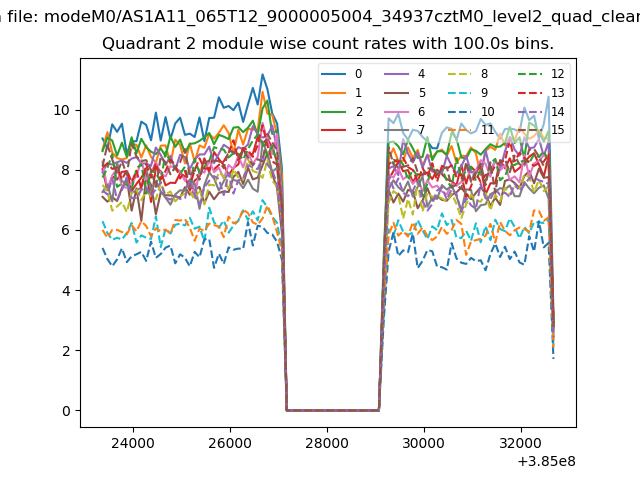
| Module-wise count rates for Quadrant B Data is divided into 100 sec bins |
 |
 |
| Module-wise count rates for Quadrant C Data is divided into 100 sec bins |
 |
 |
| Module-wise count rates for Quadrant D Data is divided into 100 sec bins |
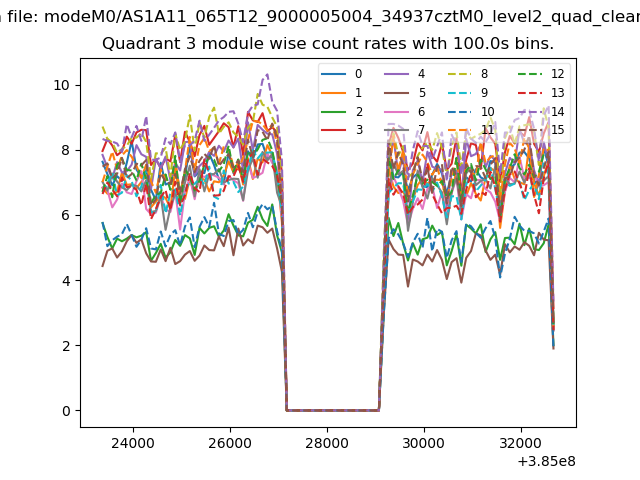 |
 |
| Parameter | Plot |
|---|---|
| CZT HV Monitor | 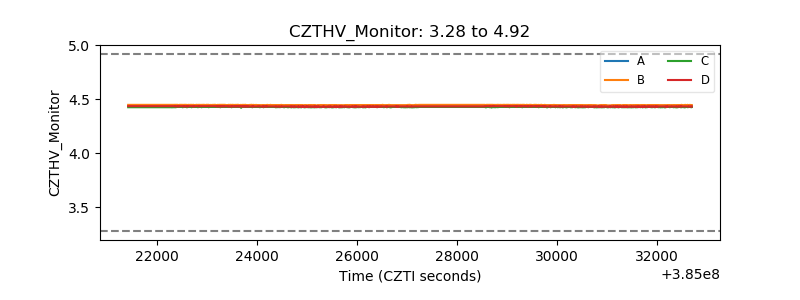 |
| D_VDD | 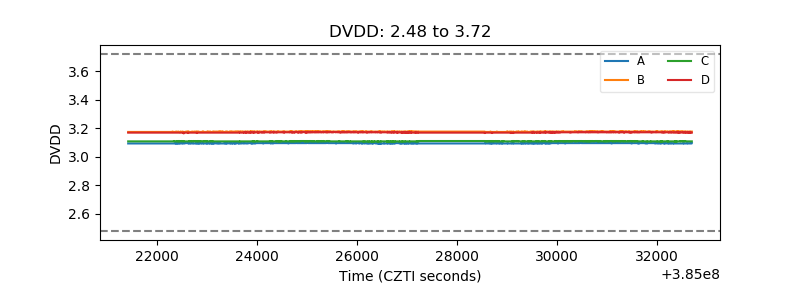 |
| Temperature 1 | 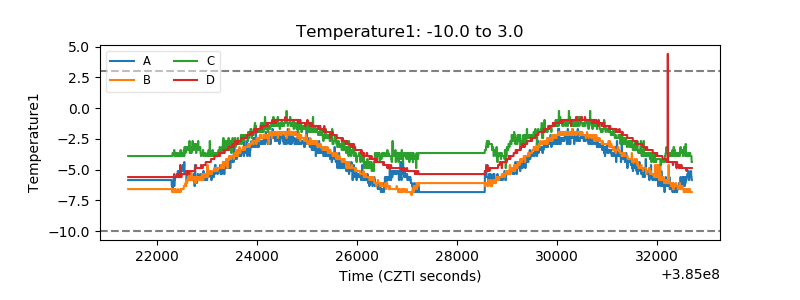 |
| Veto HV Monitor |  |
| Veto LLD | 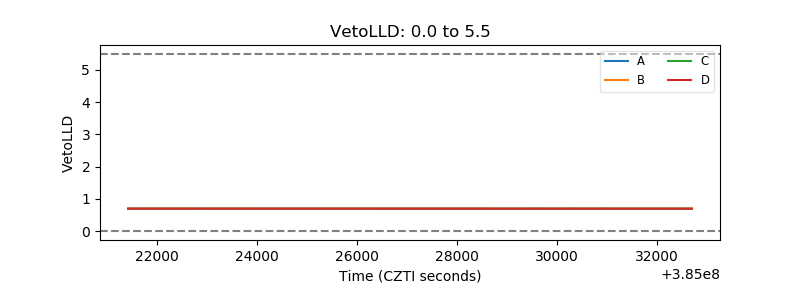 |
| Alpha Counter | 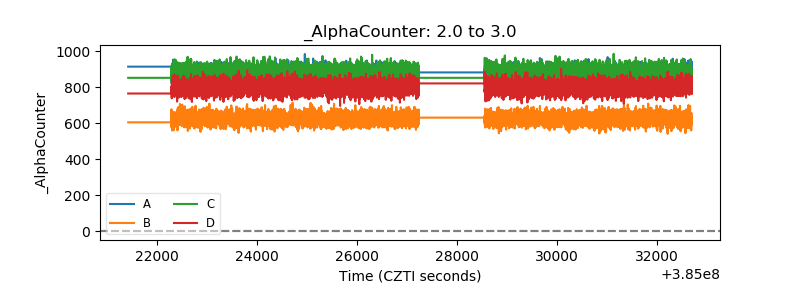 |
| _CPM_Rate | 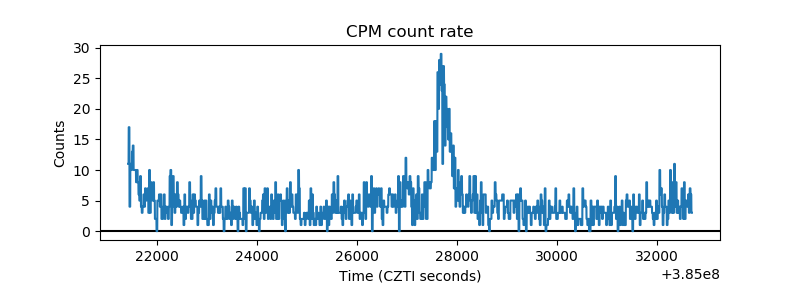 |
| CZT Counter | 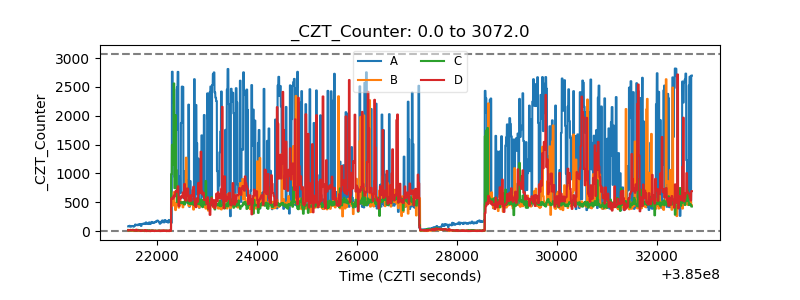 |
| +2.5 Volts monitor | 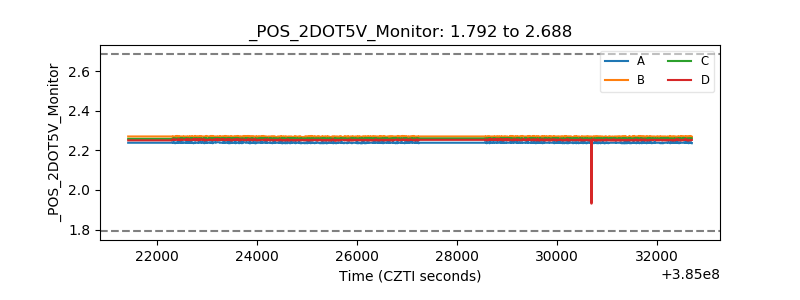 |
| +5 Volts monitor | 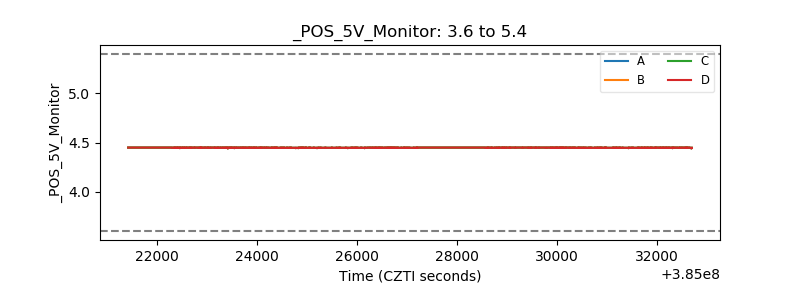 |
| _ROLL_ROT | 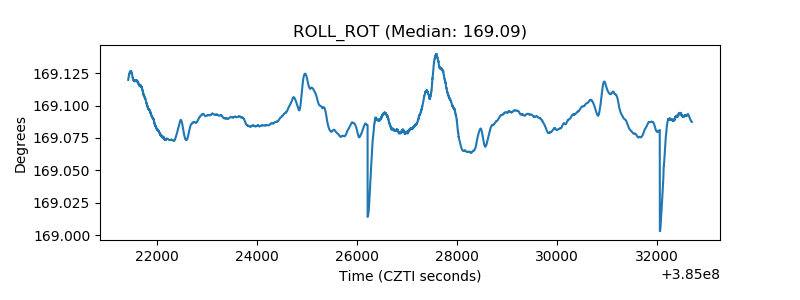 |
| _Roll_DEC | 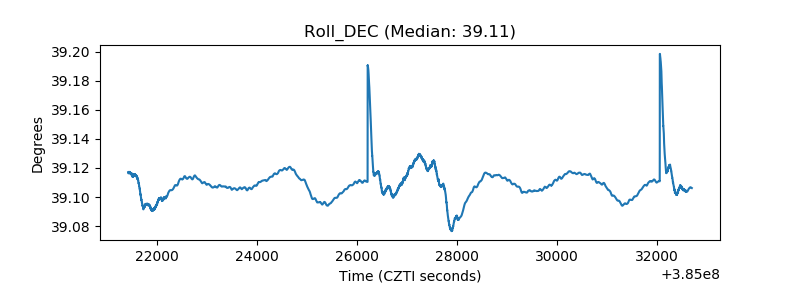 |
| _Roll_RA | 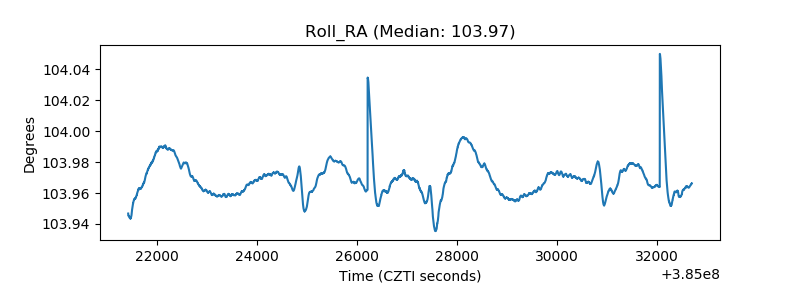 |
| Veto Counter | 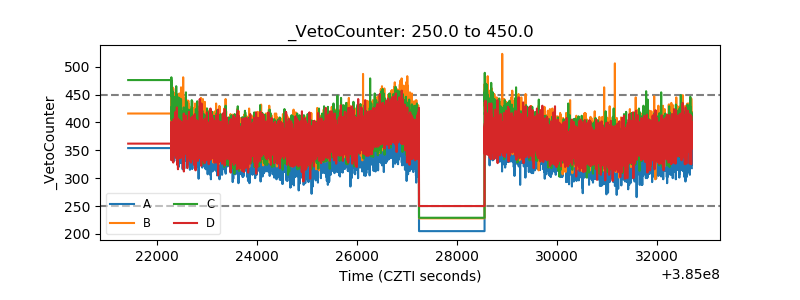 |