| Param | Original file | Final file |
|---|---|---|
| Filename | modeM0/AS1A11_086T01_9000005002_34929cztM0_level2.evt | modeM0/AS1A11_086T01_9000005002_34929cztM0_level2_quad_clean.evt |
| Size (bytes) | 346,164,480 | 42,471,360 |
| Size | 330.1 MB | 40.5 MB |
| Events in quadrant A | 5,522,105 | 56,534 |
| Events in quadrant B | 1,471,970 | 353,391 |
| Events in quadrant C | 1,411,196 | 355,096 |
| Events in quadrant D | 1,897,845 | 331,191 |
| Mode M9 | |||
|---|---|---|---|
| Quadrant | BADHDUFLAG | Total packets | Discarded packets |
| A | 0 | 11 | 0 |
| B | 0 | 11 | 0 |
| C | 0 | 11 | 0 |
| D | 0 | 12 | 0 |
| Mode SS | |||
|---|---|---|---|
| Quadrant | BADHDUFLAG | Total packets | Discarded packets |
| A | 0 | 52 | 0 |
| B | 0 | 52 | 0 |
| C | 0 | 52 | 0 |
| D | 0 | 52 | 0 |
| Mode M0 | |||
|---|---|---|---|
| Quadrant | BADHDUFLAG | Total packets | Discarded packets |
| A | 0 | 18239 | 1 |
| B | 0 | 6073 | 1 |
| C | 0 | 5737 | 1 |
| D | 0 | 7519 | 1 |
| Quadrant | Total seconds | Saturated seconds | Saturation percentage |
|---|---|---|---|
| A | 2634 | 2414 | 91.647684% |
| B | 2634 | 49 | 1.860289% |
| C | 2634 | 14 | 0.531511% |
| D | 2634 | 37 | 1.404708% |
Noise dominated data is calculated using 1-second bins in cleaned event files. If a bin has >2000 counts, and if more than 50% of those come from <1% of pixels, then it is considered to be noise-dominated and hence unusable.
| Quadrant | # 1 sec bins | Bins with >0 counts | Bins with >2000 counts | High rate bins dominated by noise | Noise dominated (total time) | Noise dominated (detector-on time) | Marked lightcurve |
|---|---|---|---|---|---|---|---|
| A | 2633 | 2633 | 1670 | 1670 | 63.43% | 63.43% | 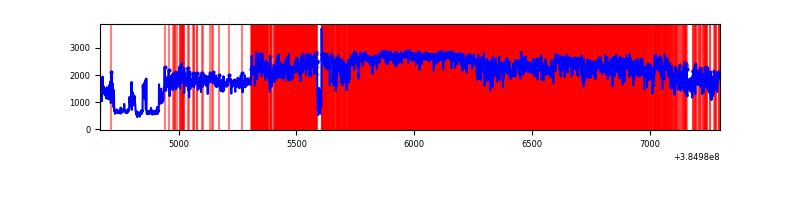 |
| B | 2634 | 2634 | 35 | 35 | 1.33% | 1.33% | 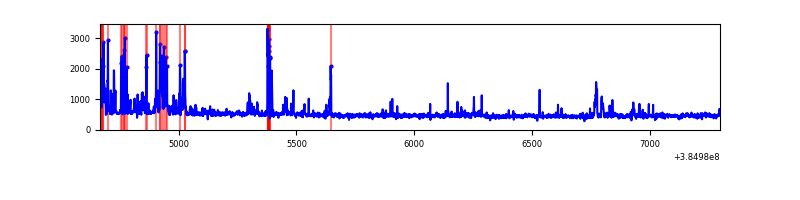 |
| C | 2634 | 2634 | 12 | 12 | 0.46% | 0.46% | 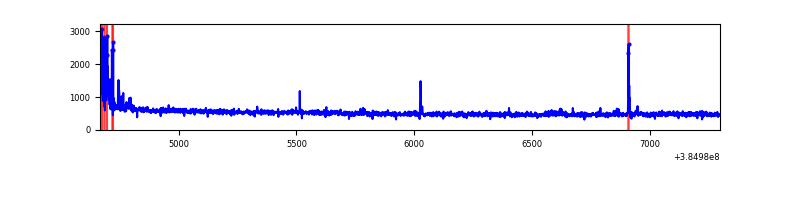 |
| D | 2634 | 2634 | 40 | 40 | 1.52% | 1.52% | 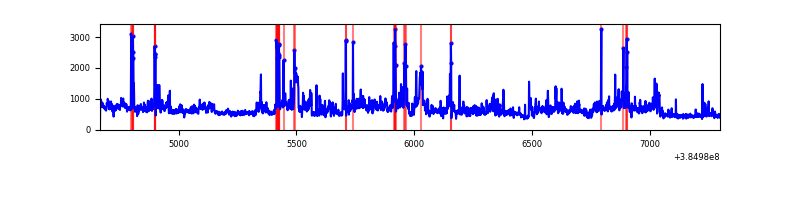 |
Top three noisy pixels from each quadrant. If the there are fewer than three noisy pixels in the level2.evt file, extra rows are filled as -1
| Pixel properties | Quadrant properties | ||||||
|---|---|---|---|---|---|---|---|
| Quadrant | DetID | PixID | Counts | Sigma | Mean | Median | Sigma |
| A | 15 | 169 | 5267936 | 373843.74 | 61 | 60 | 14.1 |
| A | 10 | 83 | 12898 | 911.07 | 61 | 60 | 14.1 |
| A | 13 | 254 | 952 | 63.3 | 61 | 60 | 14.1 |
| B | 5 | 172 | 123857 | 2095.68 | 307 | 300 | 59.0 |
| B | 5 | 255 | 104078 | 1760.2 | 307 | 300 | 59.0 |
| B | 0 | 245 | 22818 | 381.93 | 307 | 300 | 59.0 |
| C | 15 | 214 | 111420 | 1523.17 | 309 | 312 | 72.9 |
| C | 0 | 10 | 62230 | 848.83 | 309 | 312 | 72.9 |
| C | 0 | 207 | 12220 | 163.25 | 309 | 312 | 72.9 |
| D | 8 | 195 | 251301 | 3382.87 | 303 | 295 | 74.2 |
| D | 1 | 52 | 192372 | 2588.67 | 303 | 295 | 74.2 |
| D | 13 | 249 | 62662 | 840.54 | 303 | 295 | 74.2 |
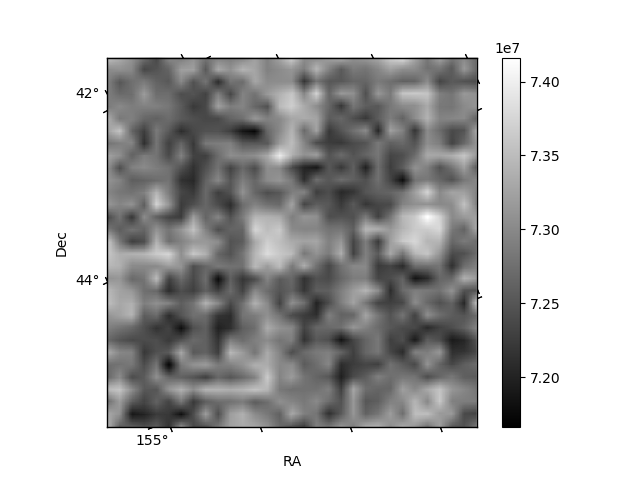
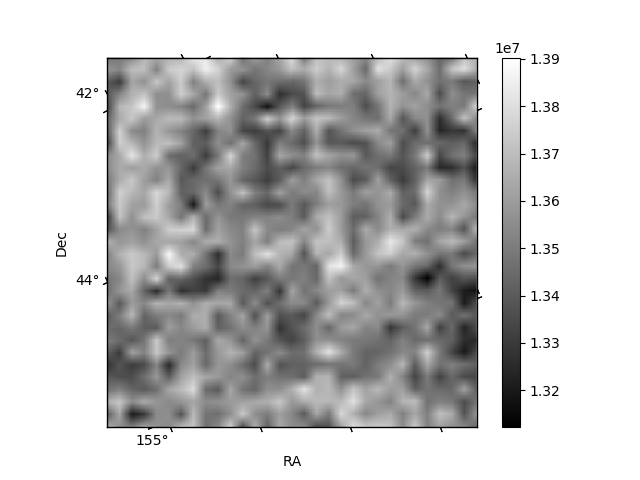
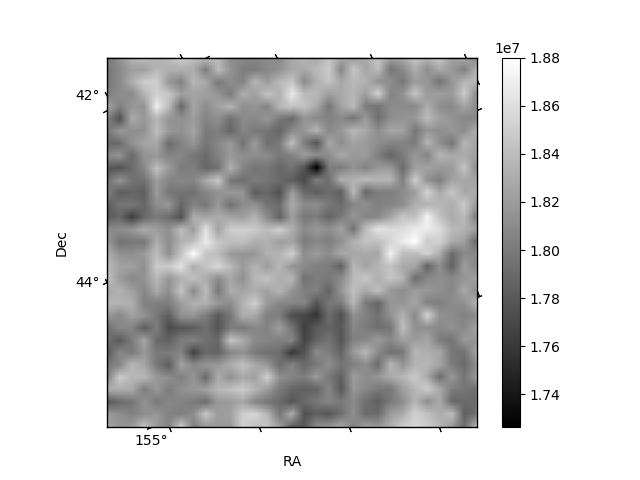
Histogram calculated using DETX and DETY for each event in the final _common_clean file
| Quadrant A | 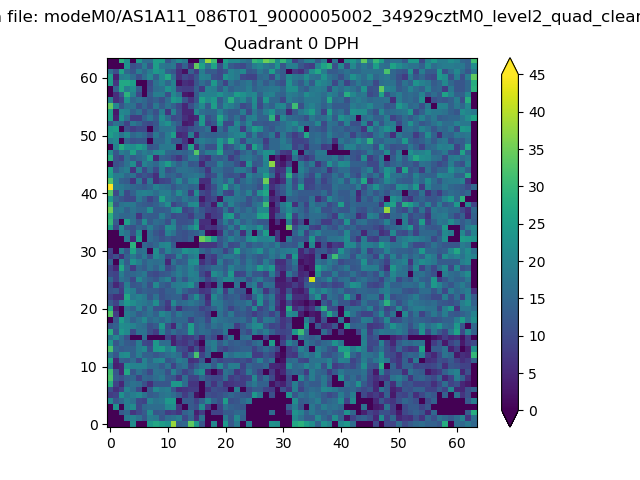 |
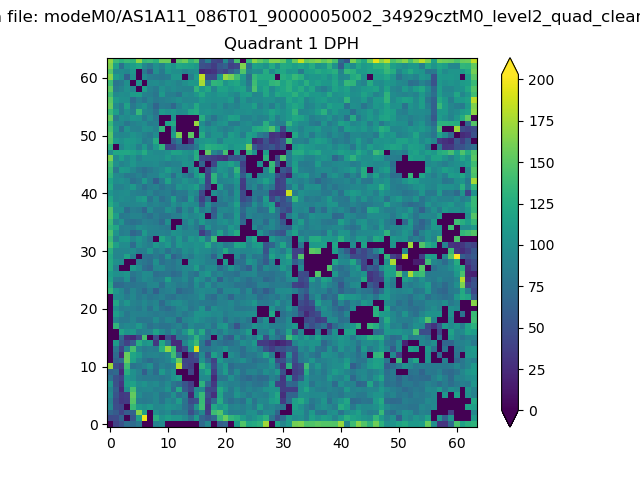 |
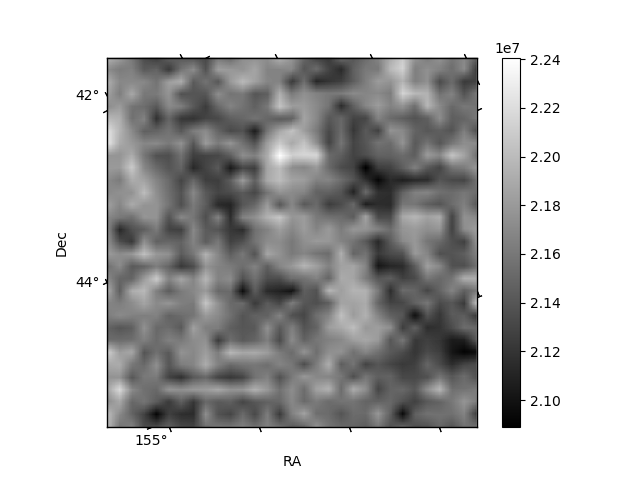
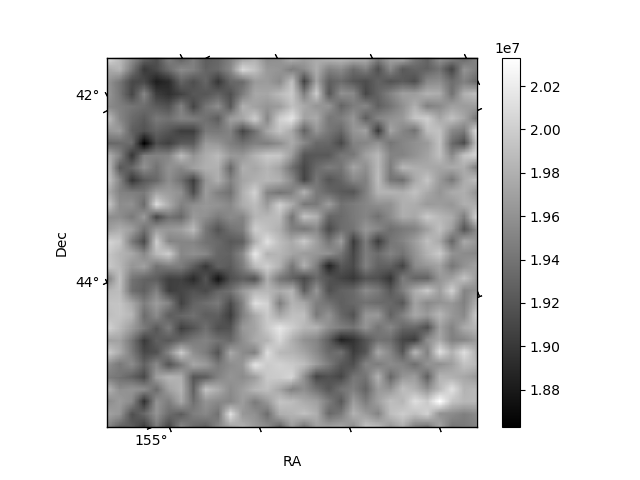
Quadrant B |
|---|---|---|---|
| Quadrant D | 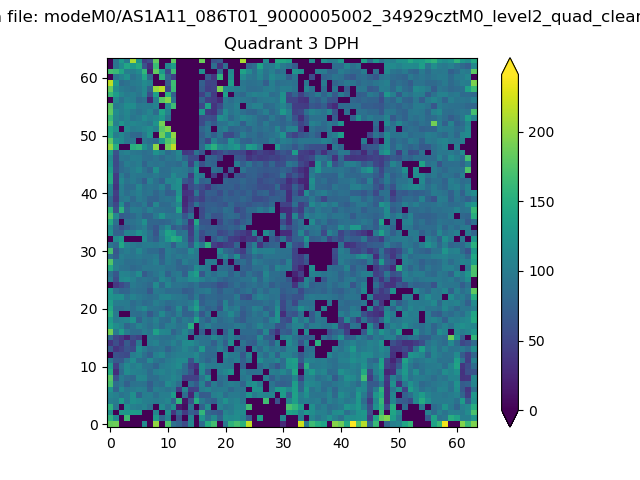 |
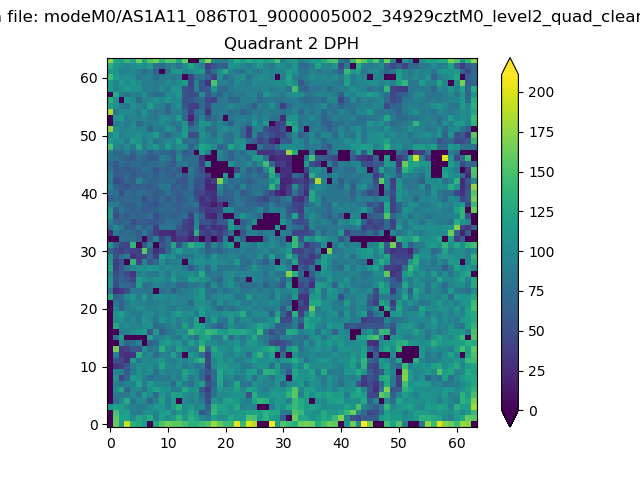 |
Quadrant C |
| Plot type | Count rate plots | Images |
|---|---|---|
| Comparison with Poisson distribution Blue bars denote a histogram of data divided into 1 sec bins. Red curve is a Poisson curve with rate = median count rate of data. |
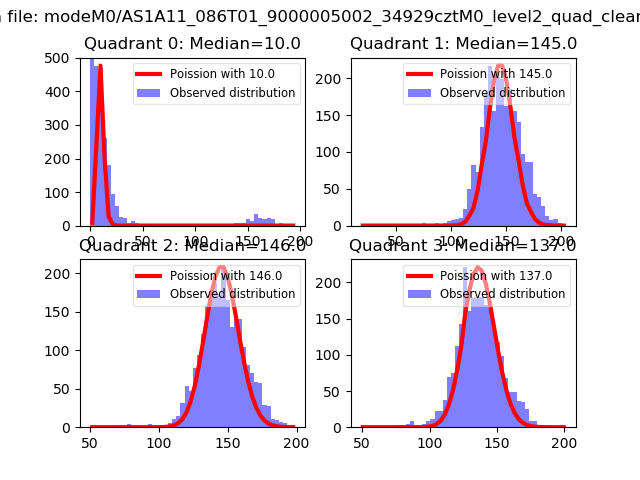 |
 |
| Quadrant-wise count rates Data is divided into 100 sec bins |
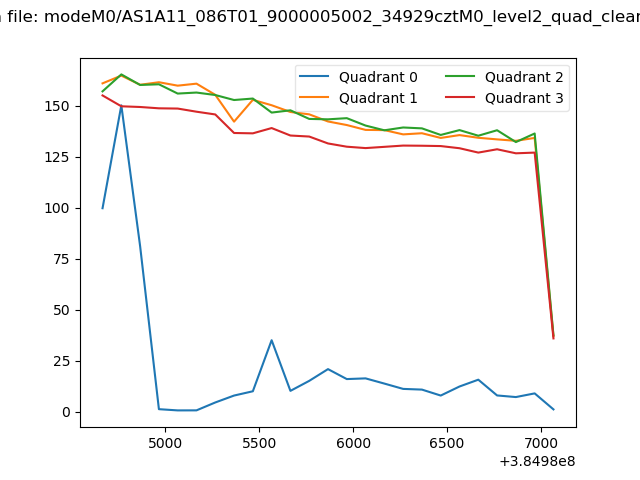 |
|
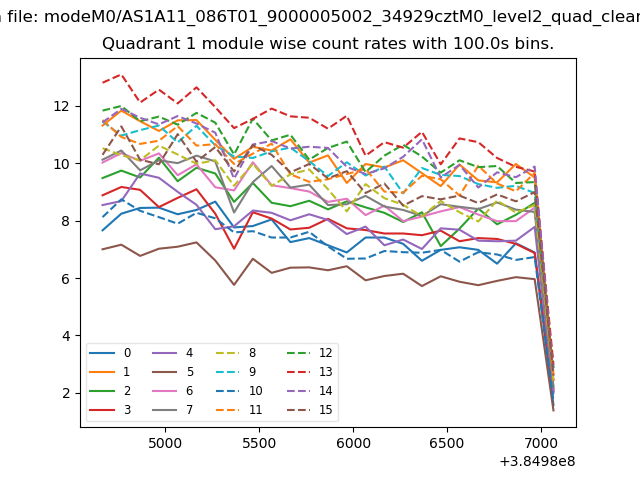
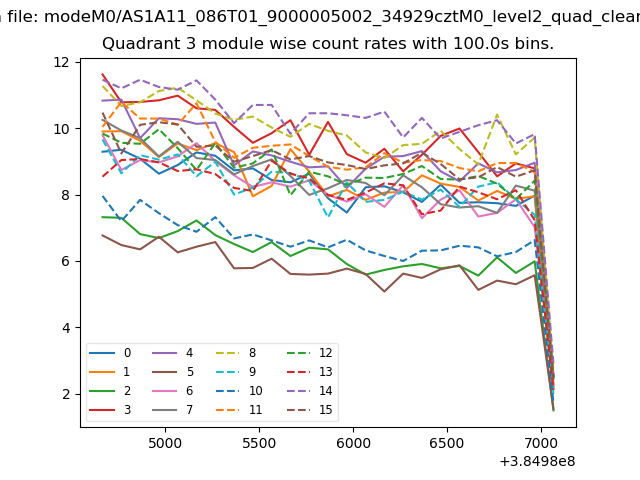
| Module-wise count rates for Quadrant A Data is divided into 100 sec bins |
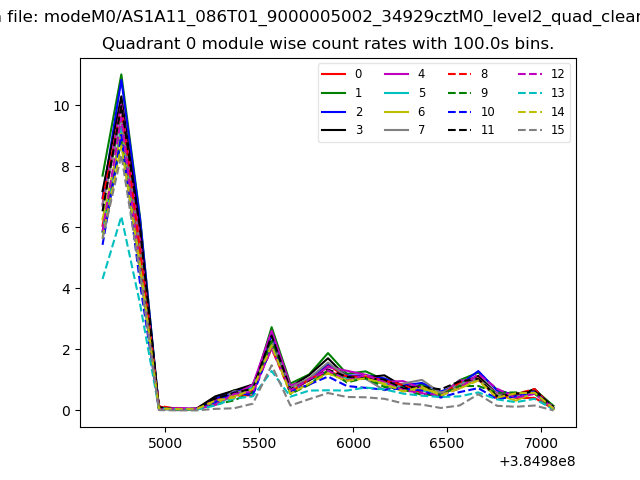 |
 |
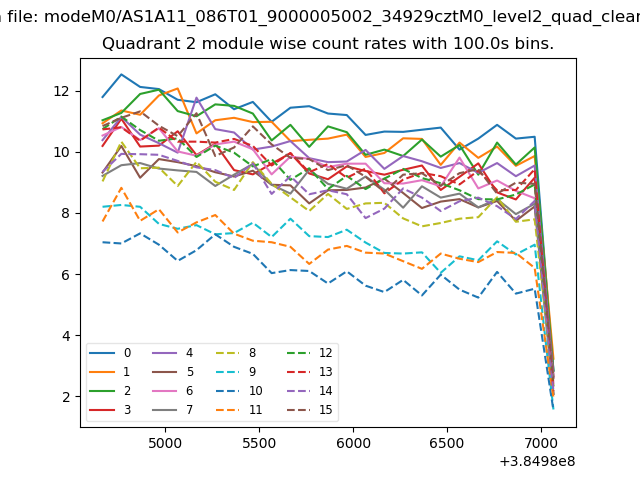
| Module-wise count rates for Quadrant B Data is divided into 100 sec bins |
 |
 |
| Module-wise count rates for Quadrant C Data is divided into 100 sec bins |
 |
 |
| Module-wise count rates for Quadrant D Data is divided into 100 sec bins |
 |
 |
| Parameter | Plot |
|---|---|
| CZT HV Monitor | 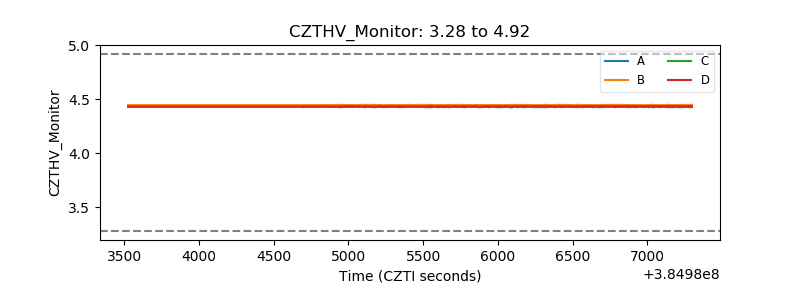 |
| D_VDD | 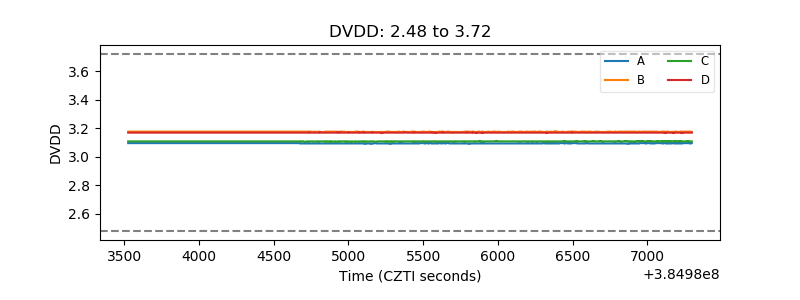 |
| Temperature 1 | 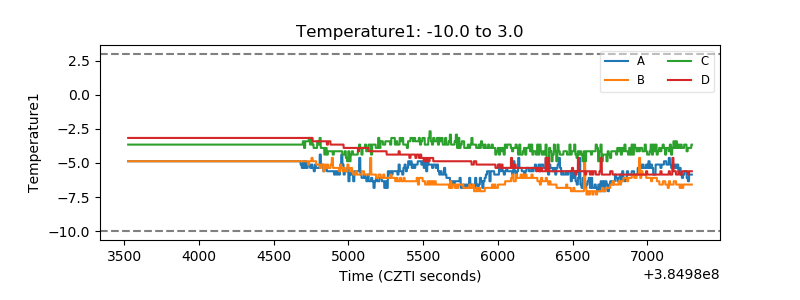 |
| Veto HV Monitor | 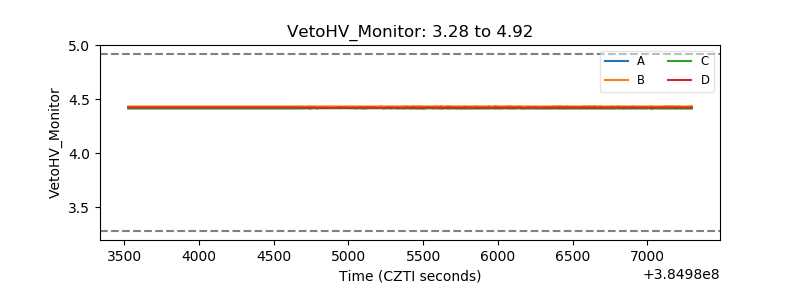 |
| Veto LLD | 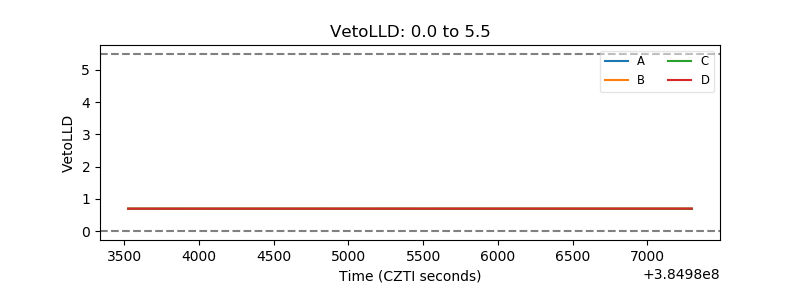 |
| Alpha Counter | 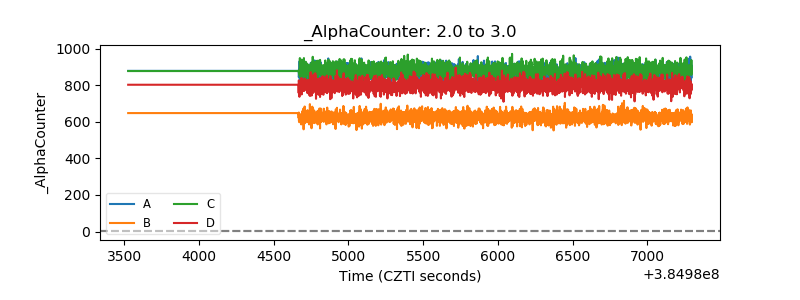 |
| _CPM_Rate | 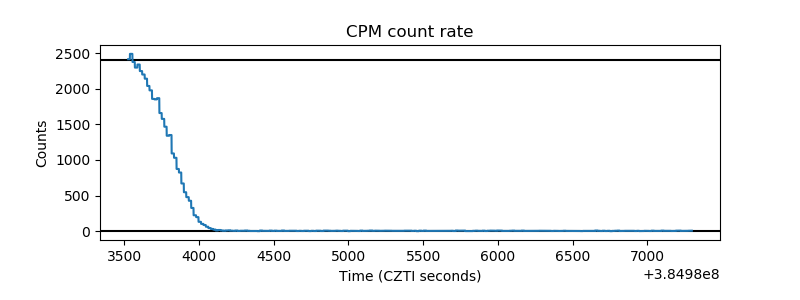 |
| CZT Counter | 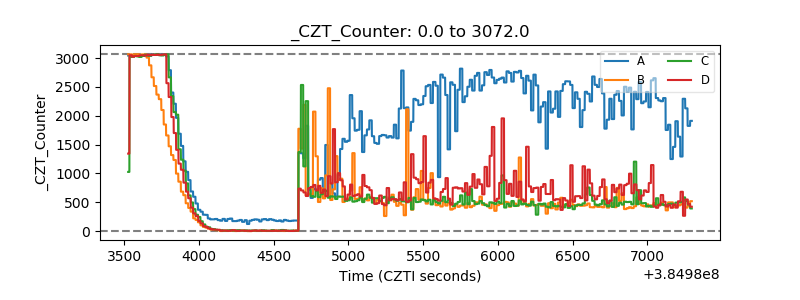 |
| +2.5 Volts monitor | 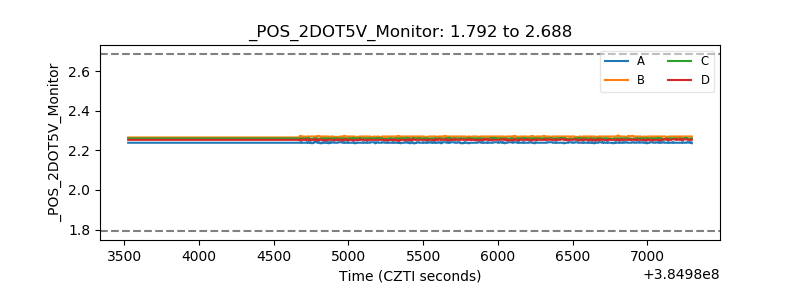 |
| +5 Volts monitor | 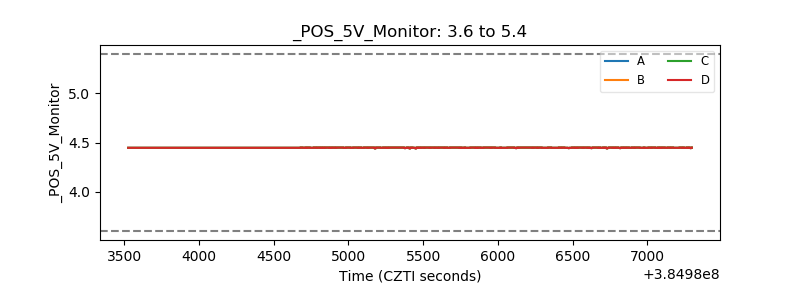 |
| _ROLL_ROT | 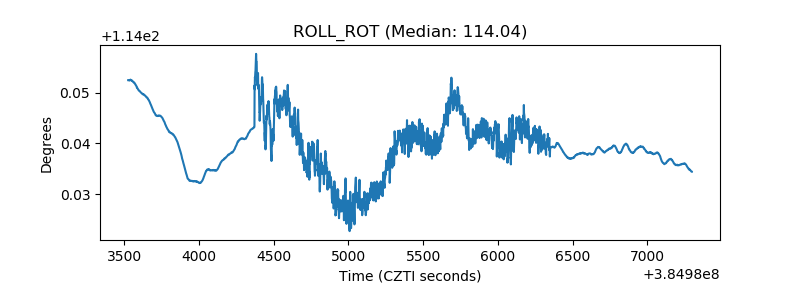 |
| _Roll_DEC | 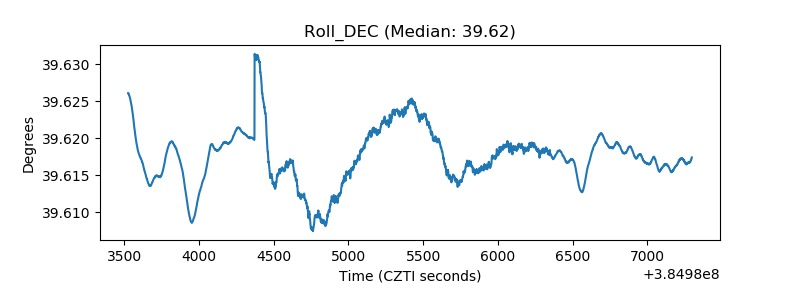 |
| _Roll_RA | 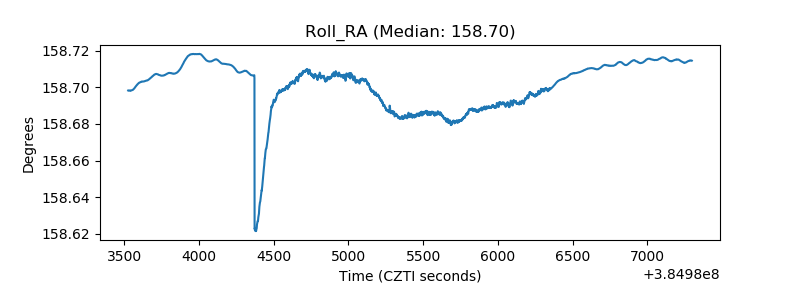 |
| Veto Counter | 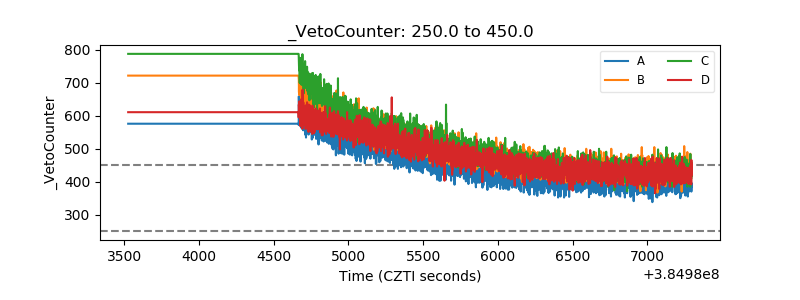 |