| Param | Original file | Final file |
|---|---|---|
| Filename | modeM0/AS1A11_086T01_9000005002_34928cztM0_level2.evt | modeM0/AS1A11_086T01_9000005002_34928cztM0_level2_quad_clean.evt |
| Size (bytes) | 414,789,120 | 77,814,720 |
| Size | 395.6 MB | 74.2 MB |
| Events in quadrant A | 3,272,651 | 439,332 |
| Events in quadrant B | 2,936,590 | 531,799 |
| Events in quadrant C | 2,826,522 | 534,308 |
| Events in quadrant D | 3,186,494 | 500,391 |
| Mode M9 | |||
|---|---|---|---|
| Quadrant | BADHDUFLAG | Total packets | Discarded packets |
| A | 0 | 27 | 0 |
| B | 0 | 27 | 0 |
| C | 0 | 27 | 0 |
| D | 0 | 28 | 0 |
| Mode SS | |||
|---|---|---|---|
| Quadrant | BADHDUFLAG | Total packets | Discarded packets |
| A | 0 | 102 | 0 |
| B | 0 | 102 | 0 |
| C | 0 | 102 | 0 |
| D | 0 | 102 | 0 |
| Mode M0 | |||
|---|---|---|---|
| Quadrant | BADHDUFLAG | Total packets | Discarded packets |
| A | 0 | 13124 | 3 |
| B | 0 | 11767 | 2 |
| C | 0 | 11428 | 2 |
| D | 0 | 12872 | 2 |
| Quadrant | Total seconds | Saturated seconds | Saturation percentage |
|---|---|---|---|
| A | 4994 | 572 | 11.453744% |
| B | 4994 | 103 | 2.062475% |
| C | 4994 | 34 | 0.680817% |
| D | 4994 | 44 | 0.881057% |
Noise dominated data is calculated using 1-second bins in cleaned event files. If a bin has >2000 counts, and if more than 50% of those come from <1% of pixels, then it is considered to be noise-dominated and hence unusable.
| Quadrant | # 1 sec bins | Bins with >0 counts | Bins with >2000 counts | High rate bins dominated by noise | Noise dominated (total time) | Noise dominated (detector-on time) | Marked lightcurve |
|---|---|---|---|---|---|---|---|
| A | 7027 | 4994 | 121 | 121 | 1.72% | 2.42% | 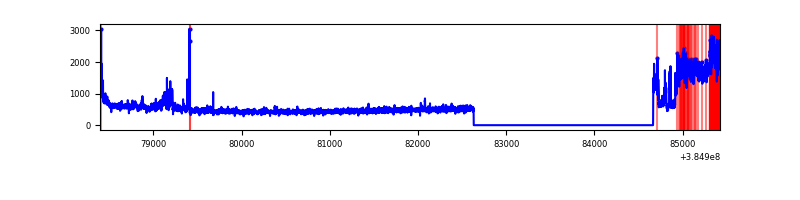 |
| B | 7028 | 4995 | 73 | 73 | 1.04% | 1.46% | 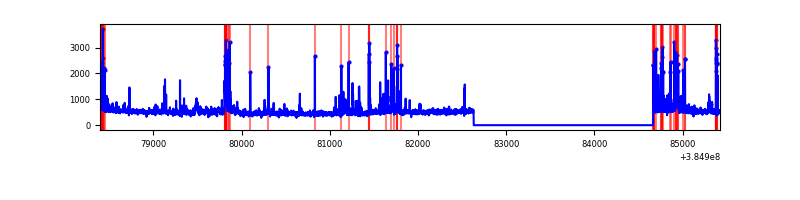 |
| C | 7028 | 4995 | 25 | 25 | 0.36% | 0.50% | 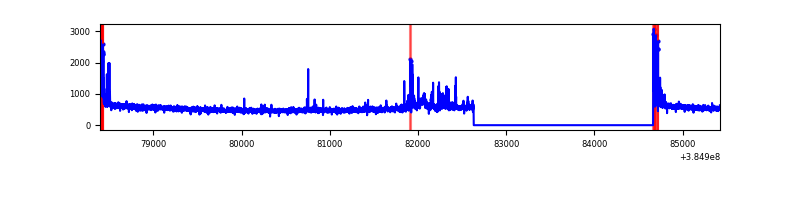 |
| D | 7028 | 4995 | 36 | 36 | 0.51% | 0.72% | 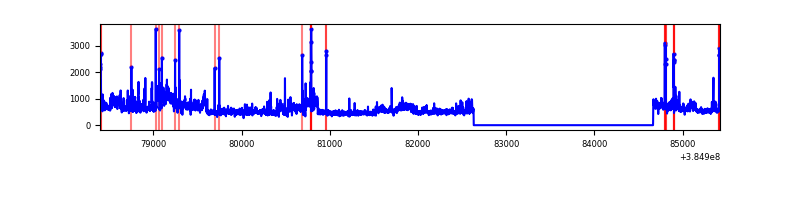 |
Top three noisy pixels from each quadrant. If the there are fewer than three noisy pixels in the level2.evt file, extra rows are filled as -1
| Pixel properties | Quadrant properties | ||||||
|---|---|---|---|---|---|---|---|
| Quadrant | DetID | PixID | Counts | Sigma | Mean | Median | Sigma |
| A | 15 | 169 | 1131211 | 10626.39 | 537 | 529 | 106.4 |
| A | 10 | 83 | 48885 | 454.46 | 537 | 529 | 106.4 |
| A | 13 | 254 | 8053 | 70.71 | 537 | 529 | 106.4 |
| B | 5 | 172 | 333926 | 2955.05 | 600 | 587 | 112.8 |
| B | 5 | 255 | 200148 | 1769.11 | 600 | 587 | 112.8 |
| B | 0 | 245 | 36834 | 321.33 | 600 | 587 | 112.8 |
| C | 15 | 214 | 212027 | 1537.81 | 602 | 610 | 137.5 |
| C | 0 | 10 | 207970 | 1508.3 | 602 | 610 | 137.5 |
| C | 2 | 16 | 34355 | 245.45 | 602 | 610 | 137.5 |
| D | 8 | 195 | 627599 | 4367.55 | 596 | 581 | 143.6 |
| D | 13 | 249 | 46906 | 322.68 | 596 | 581 | 143.6 |
| D | 2 | 250 | 42275 | 290.42 | 596 | 581 | 143.6 |
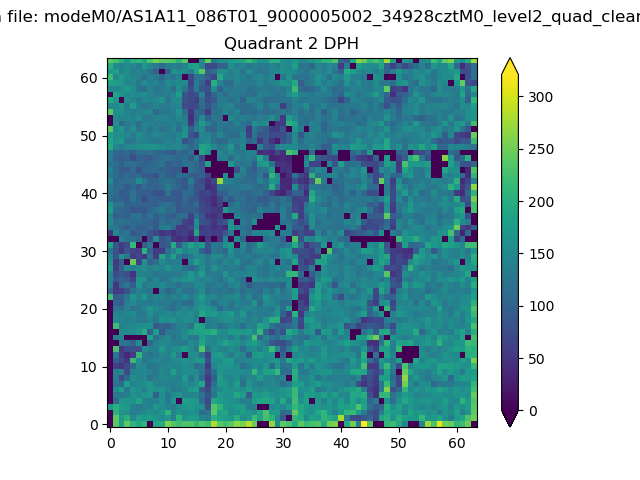
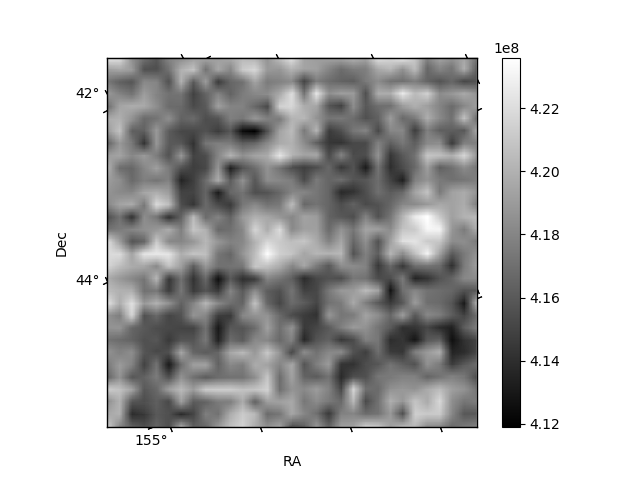
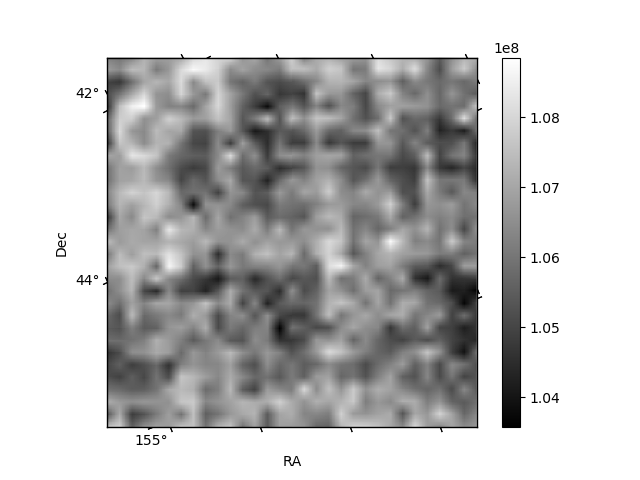
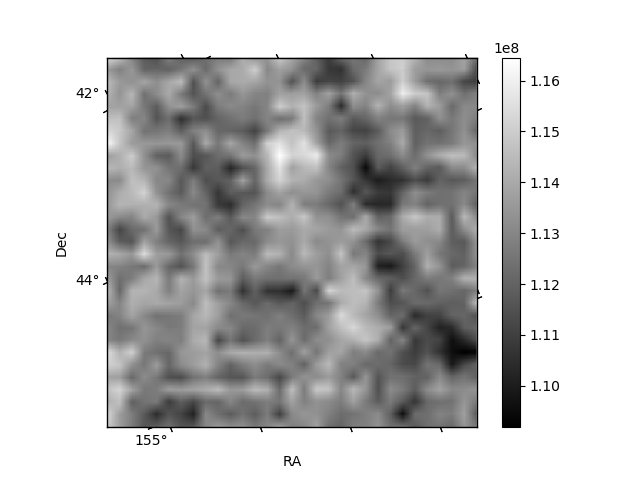
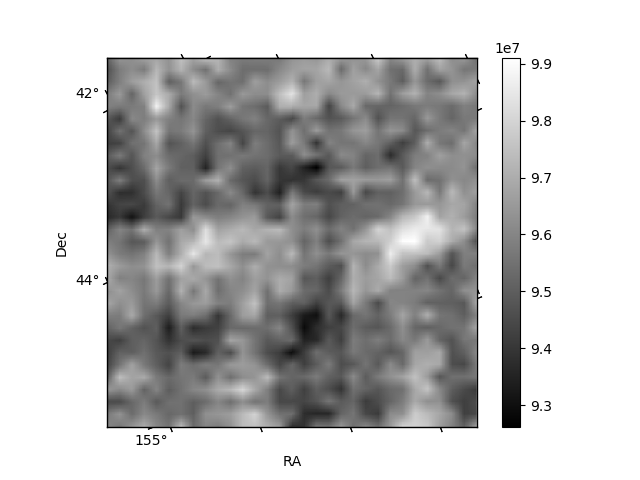
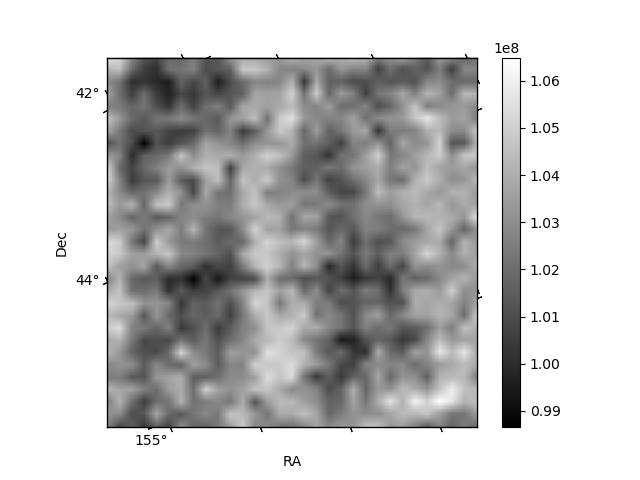
Histogram calculated using DETX and DETY for each event in the final _common_clean file
| Quadrant A | 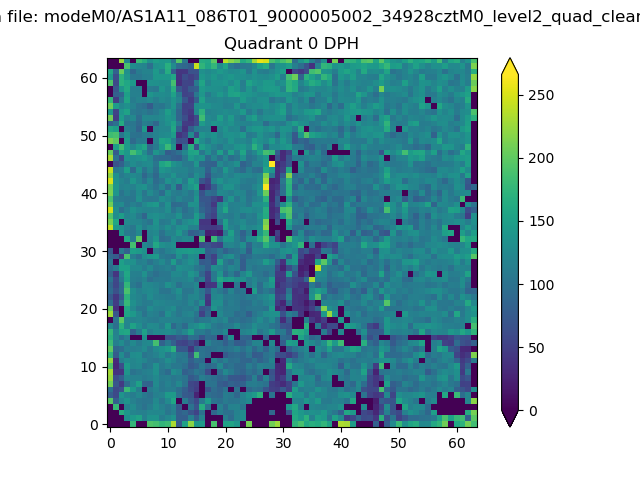 |
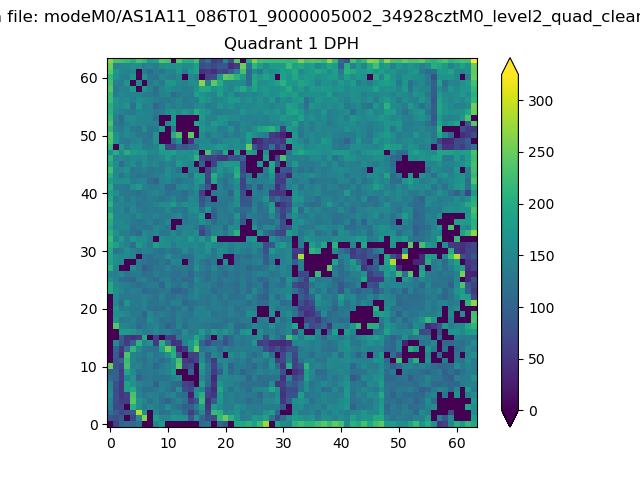 |
Quadrant B |
|---|---|---|---|
| Quadrant D | 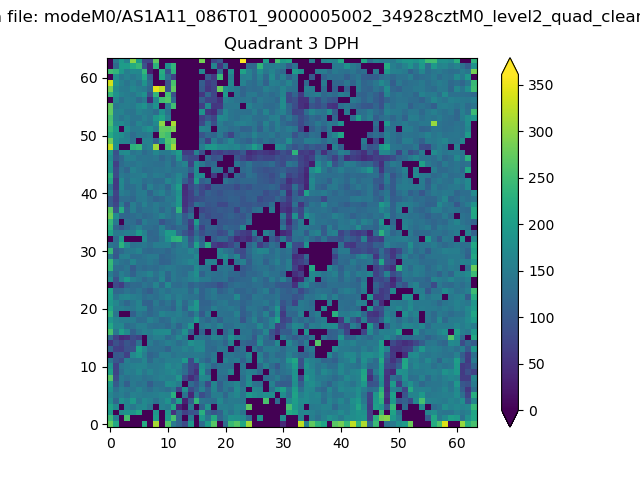 |
 |
Quadrant C |
| Plot type | Count rate plots | Images |
|---|---|---|
| Comparison with Poisson distribution Blue bars denote a histogram of data divided into 1 sec bins. Red curve is a Poisson curve with rate = median count rate of data. |
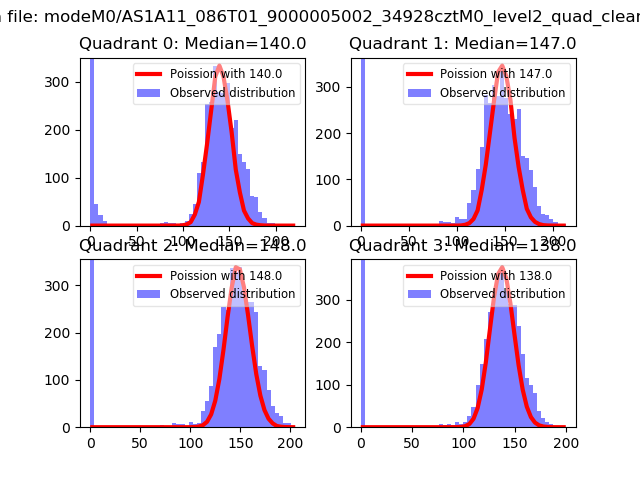 |
 |
| Quadrant-wise count rates Data is divided into 100 sec bins |
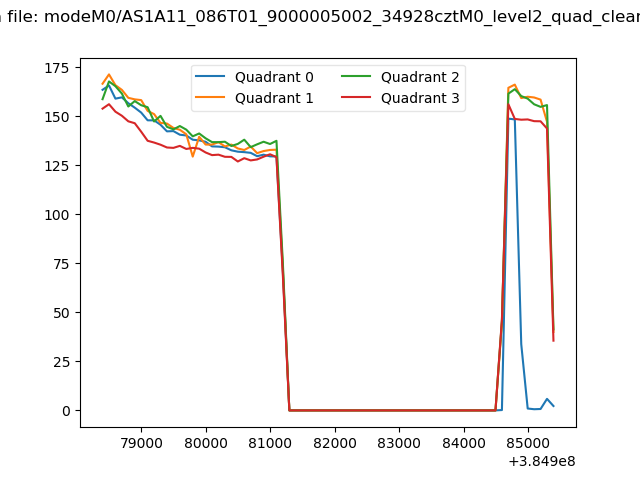 |
|
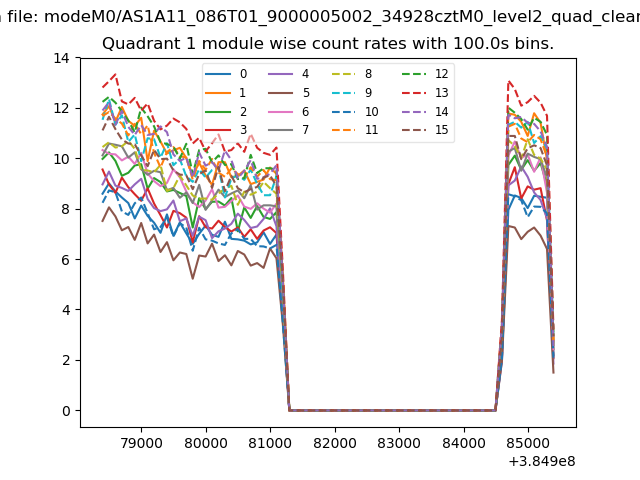
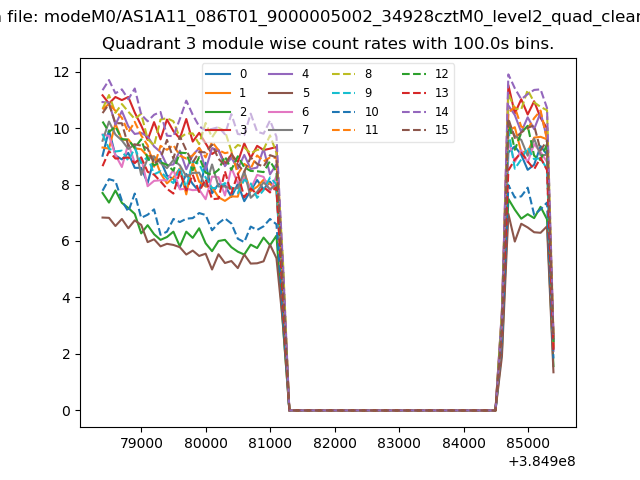
| Module-wise count rates for Quadrant A Data is divided into 100 sec bins |
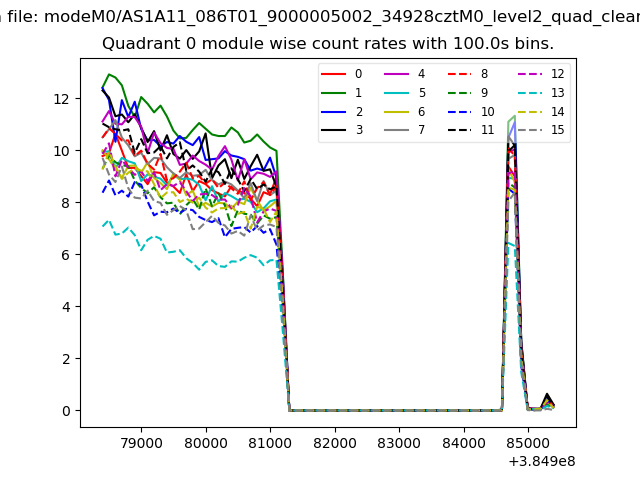 |
 |
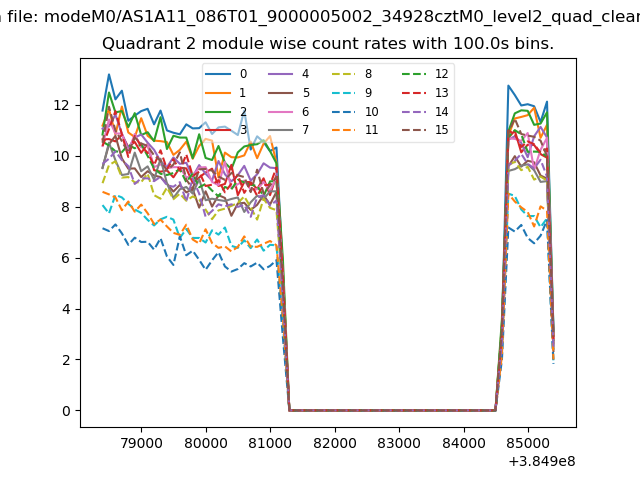
| Module-wise count rates for Quadrant B Data is divided into 100 sec bins |
 |
 |
| Module-wise count rates for Quadrant C Data is divided into 100 sec bins |
 |
 |
| Module-wise count rates for Quadrant D Data is divided into 100 sec bins |
 |
 |
| Parameter | Plot |
|---|---|
| CZT HV Monitor | 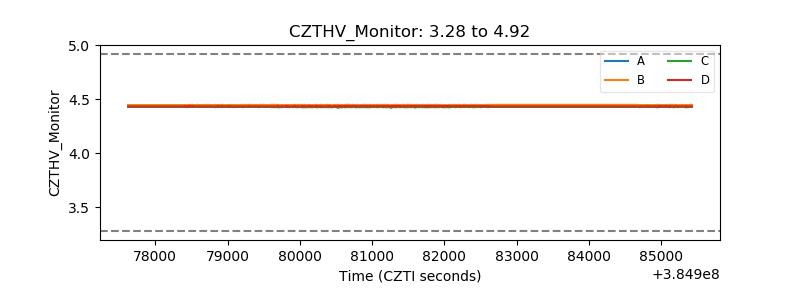 |
| D_VDD | 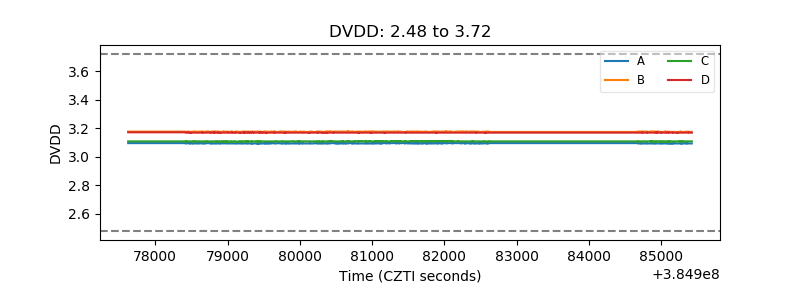 |
| Temperature 1 | 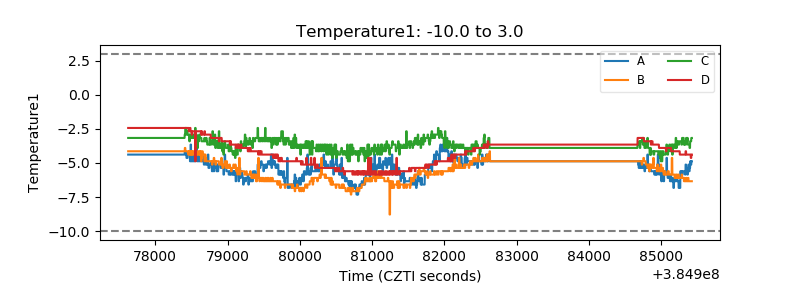 |
| Veto HV Monitor | 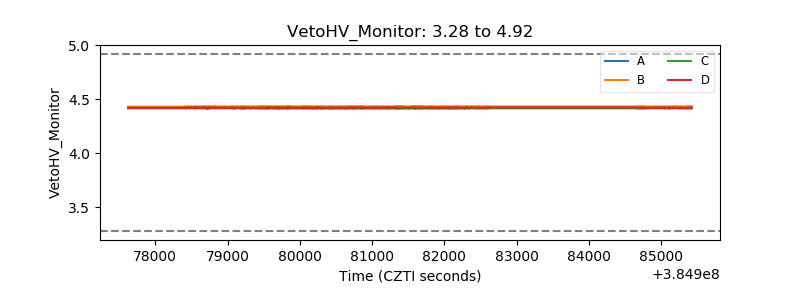 |
| Veto LLD | 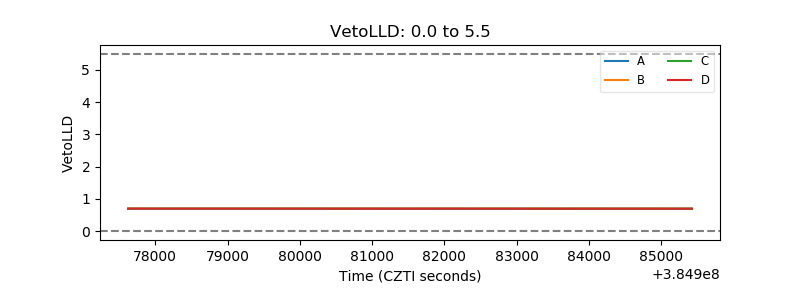 |
| Alpha Counter | 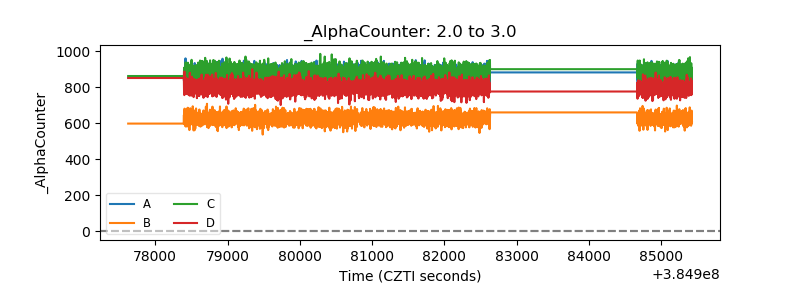 |
| _CPM_Rate | 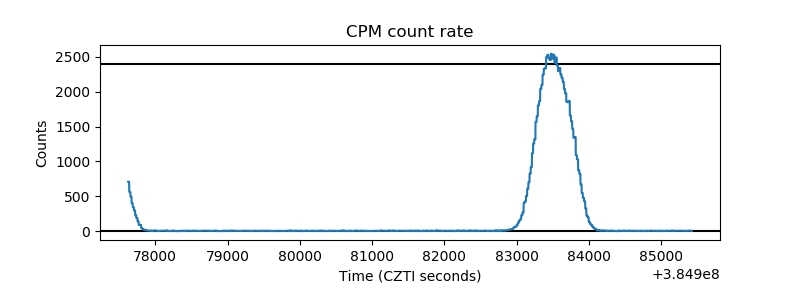 |
| CZT Counter | 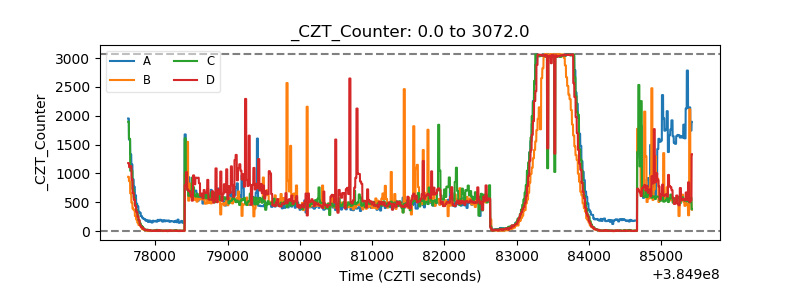 |
| +2.5 Volts monitor | 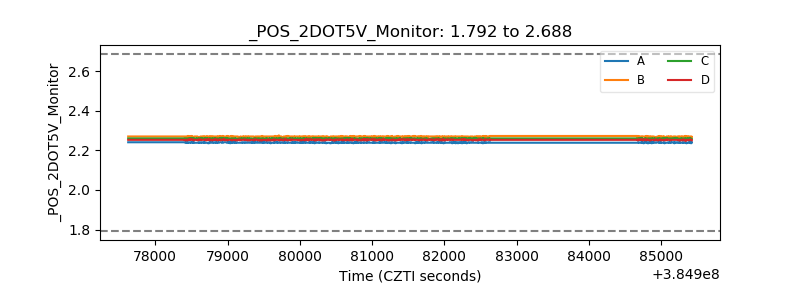 |
| +5 Volts monitor | 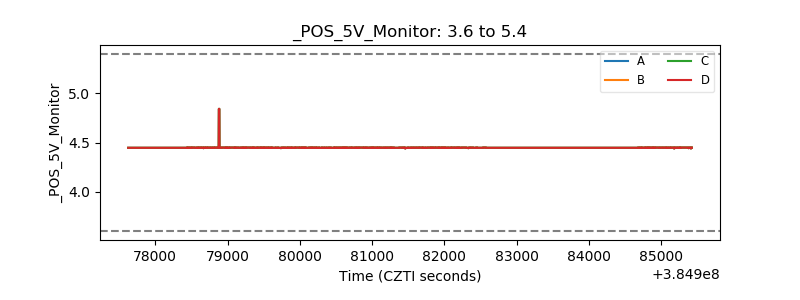 |
| _ROLL_ROT | 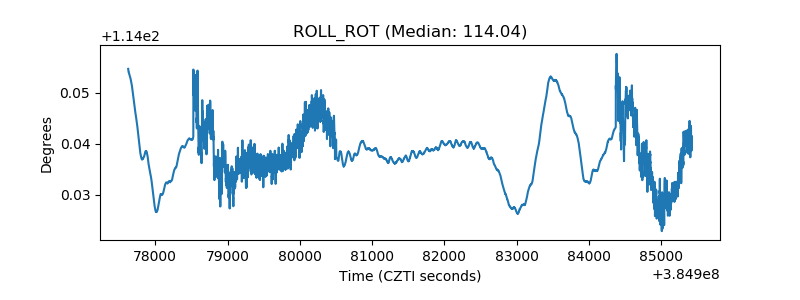 |
| _Roll_DEC | 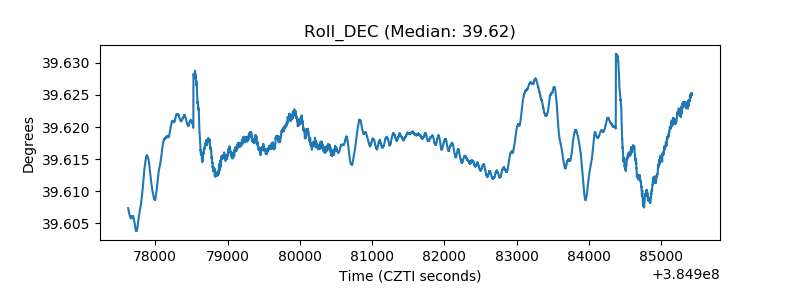 |
| _Roll_RA | 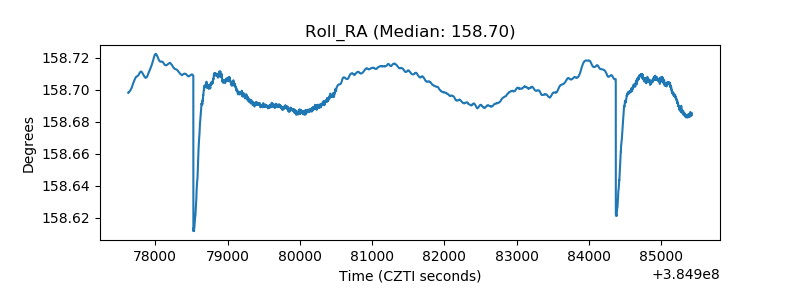 |
| Veto Counter |  |