| Param | Original file | Final file |
|---|---|---|
| Filename | modeM0/AS1A11_086T01_9000005002_34927cztM0_level2.evt | modeM0/AS1A11_086T01_9000005002_34927cztM0_level2_quad_clean.evt |
| Size (bytes) | 474,439,680 | 84,988,800 |
| Size | 452.5 MB | 81.1 MB |
| Events in quadrant A | 2,620,760 | 574,766 |
| Events in quadrant B | 4,710,623 | 515,344 |
| Events in quadrant C | 2,753,763 | 580,947 |
| Events in quadrant D | 3,933,572 | 541,215 |
| Mode M9 | |||
|---|---|---|---|
| Quadrant | BADHDUFLAG | Total packets | Discarded packets |
| A | 0 | 20 | 0 |
| B | 0 | 20 | 0 |
| C | 0 | 20 | 0 |
| D | 0 | 21 | 0 |
| Mode SS | |||
|---|---|---|---|
| Quadrant | BADHDUFLAG | Total packets | Discarded packets |
| A | 0 | 104 | 0 |
| B | 0 | 104 | 0 |
| C | 0 | 104 | 0 |
| D | 0 | 104 | 0 |
| Mode M0 | |||
|---|---|---|---|
| Quadrant | BADHDUFLAG | Total packets | Discarded packets |
| A | 0 | 11242 | 3 |
| B | 0 | 17328 | 2 |
| C | 0 | 11280 | 2 |
| D | 0 | 15412 | 2 |
| Quadrant | Total seconds | Saturated seconds | Saturation percentage |
|---|---|---|---|
| A | 5159 | 16 | 0.310138% |
| B | 5159 | 832 | 16.127156% |
| C | 5159 | 35 | 0.678426% |
| D | 5159 | 58 | 1.124249% |
Noise dominated data is calculated using 1-second bins in cleaned event files. If a bin has >2000 counts, and if more than 50% of those come from <1% of pixels, then it is considered to be noise-dominated and hence unusable.
| Quadrant | # 1 sec bins | Bins with >0 counts | Bins with >2000 counts | High rate bins dominated by noise | Noise dominated (total time) | Noise dominated (detector-on time) | Marked lightcurve |
|---|---|---|---|---|---|---|---|
| A | 7073 | 5160 | 4 | 4 | 0.06% | 0.08% | 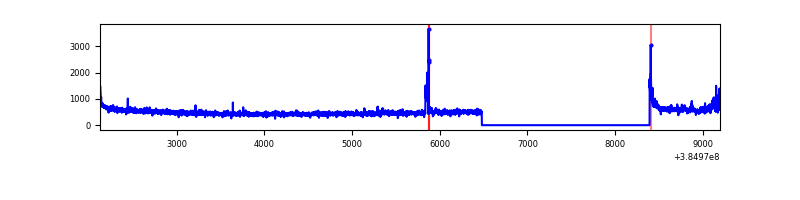 |
| B | 7073 | 5160 | 722 | 722 | 10.21% | 13.99% | 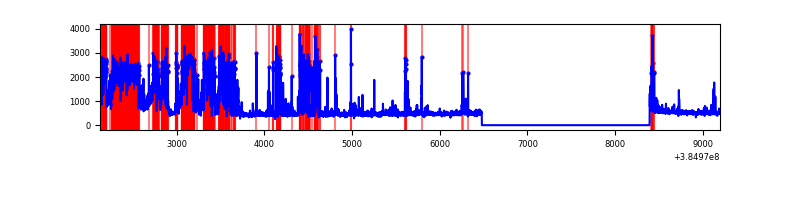 |
| C | 7073 | 5160 | 20 | 20 | 0.28% | 0.39% | 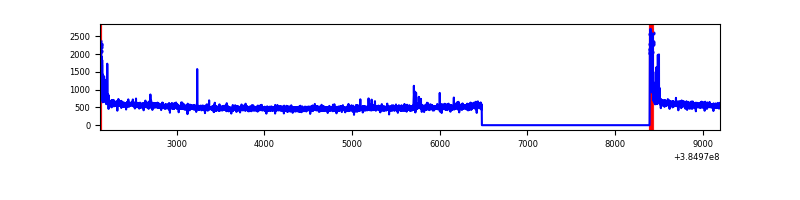 |
| D | 7073 | 5160 | 54 | 54 | 0.76% | 1.05% | 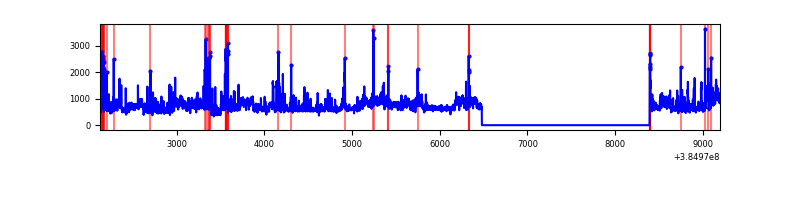 |
Top three noisy pixels from each quadrant. If the there are fewer than three noisy pixels in the level2.evt file, extra rows are filled as -1
| Pixel properties | Quadrant properties | ||||||
|---|---|---|---|---|---|---|---|
| Quadrant | DetID | PixID | Counts | Sigma | Mean | Median | Sigma |
| A | 15 | 169 | 139962 | 1129.87 | 620 | 609 | 123.3 |
| A | 10 | 83 | 62790 | 504.16 | 620 | 609 | 123.3 |
| A | 13 | 254 | 9158 | 69.31 | 620 | 609 | 123.3 |
| B | 5 | 172 | 1977395 | 18272.45 | 567 | 552 | 108.2 |
| B | 5 | 255 | 458026 | 4228.55 | 567 | 552 | 108.2 |
| B | 0 | 245 | 27166 | 246.0 | 567 | 552 | 108.2 |
| C | 15 | 214 | 219756 | 1555.09 | 614 | 619 | 140.9 |
| C | 0 | 10 | 115447 | 814.87 | 614 | 619 | 140.9 |
| C | 8 | 111 | 11481 | 77.08 | 614 | 619 | 140.9 |
| D | 8 | 195 | 769258 | 5223.18 | 609 | 594 | 147.2 |
| D | 2 | 31 | 490675 | 3330.17 | 609 | 594 | 147.2 |
| D | 1 | 47 | 76331 | 514.64 | 609 | 594 | 147.2 |
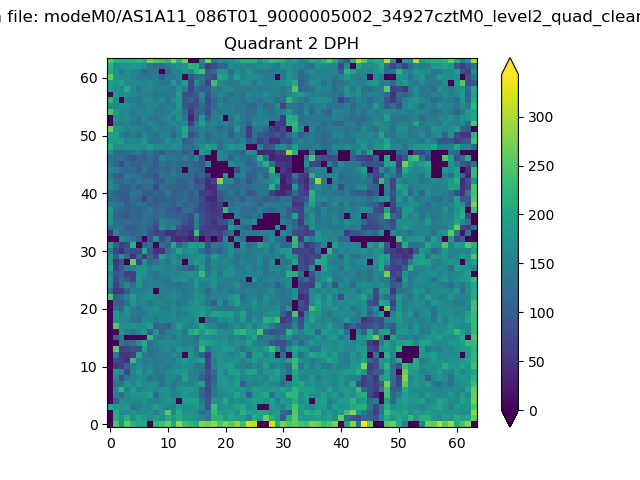
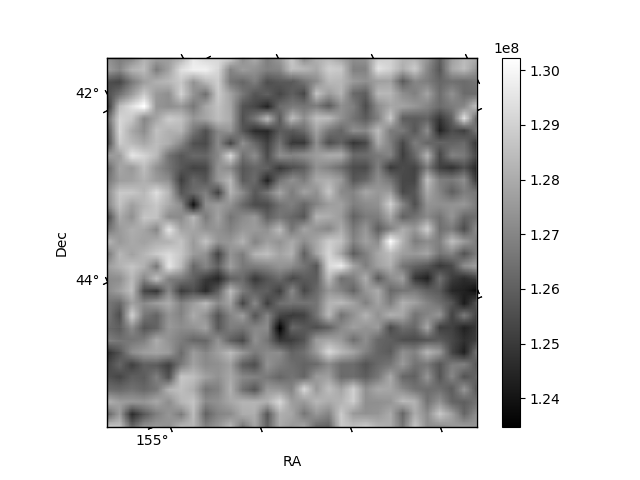
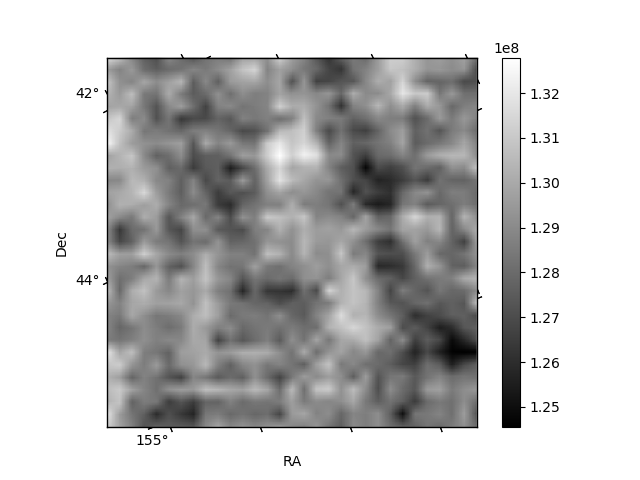
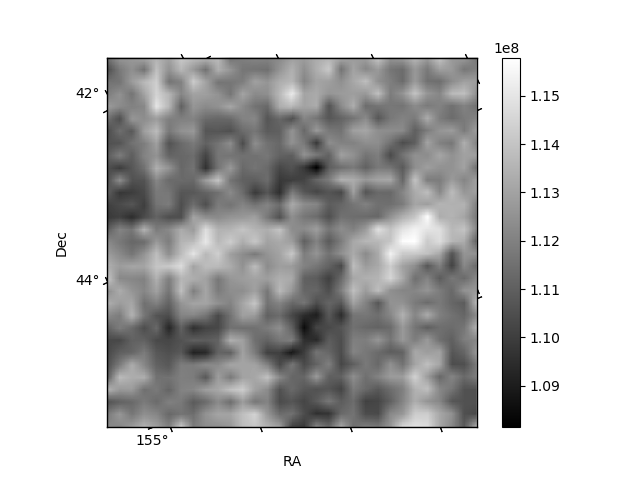
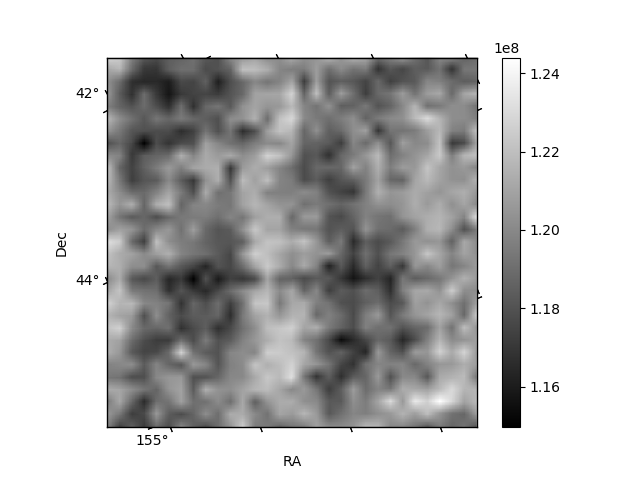
Histogram calculated using DETX and DETY for each event in the final _common_clean file
| Quadrant A | 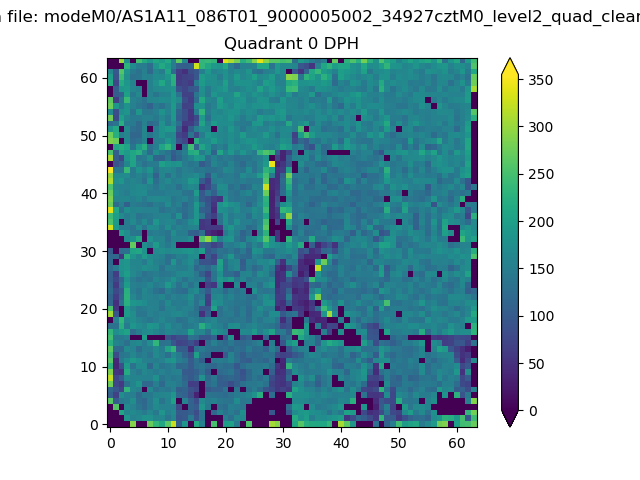 |
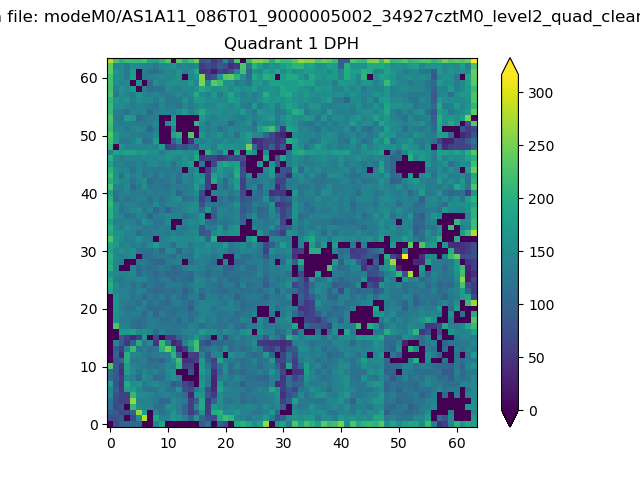 |
Quadrant B |
|---|---|---|---|
| Quadrant D | 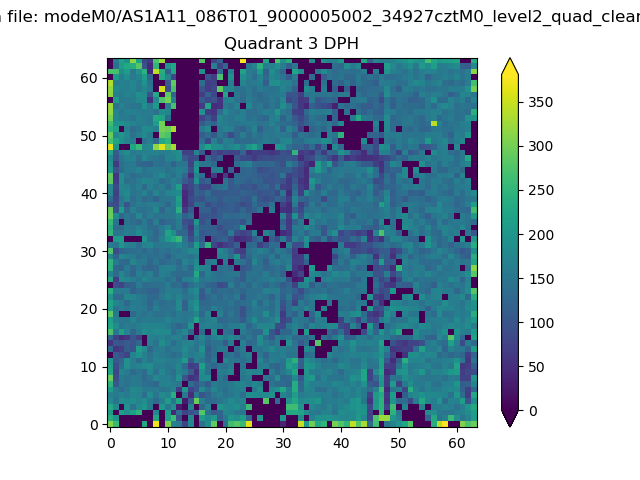 |
 |
Quadrant C |
| Plot type | Count rate plots | Images |
|---|---|---|
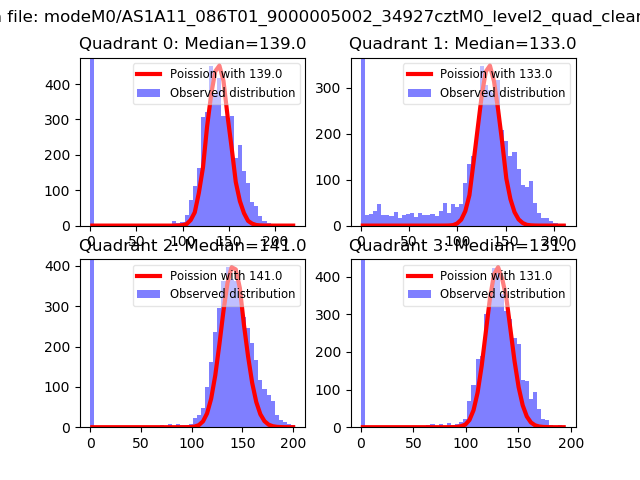
| Comparison with Poisson distribution Blue bars denote a histogram of data divided into 1 sec bins. Red curve is a Poisson curve with rate = median count rate of data. |
 |
 |
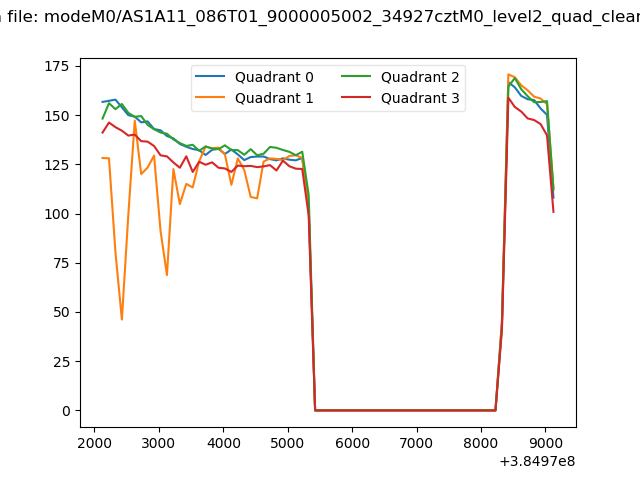
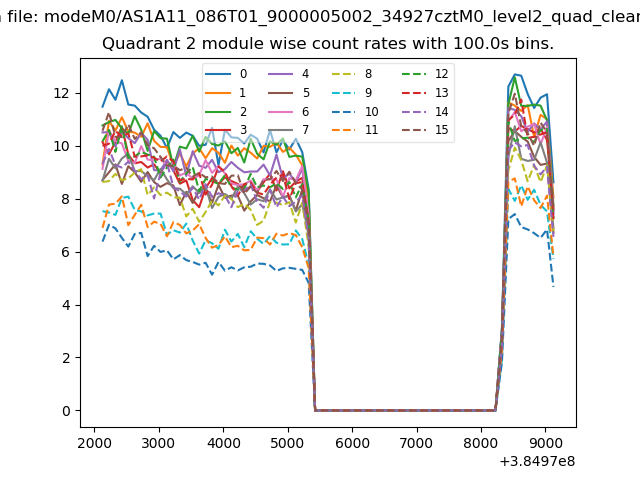
| Quadrant-wise count rates Data is divided into 100 sec bins |
 |
|
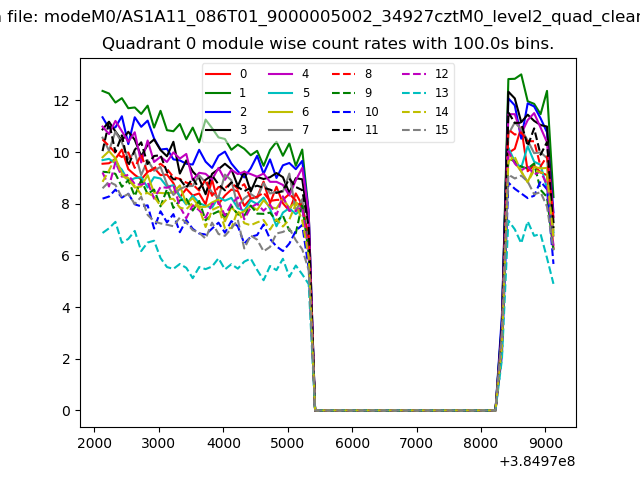
| Module-wise count rates for Quadrant A Data is divided into 100 sec bins |
 |
 |
| Module-wise count rates for Quadrant B Data is divided into 100 sec bins |
 |
 |
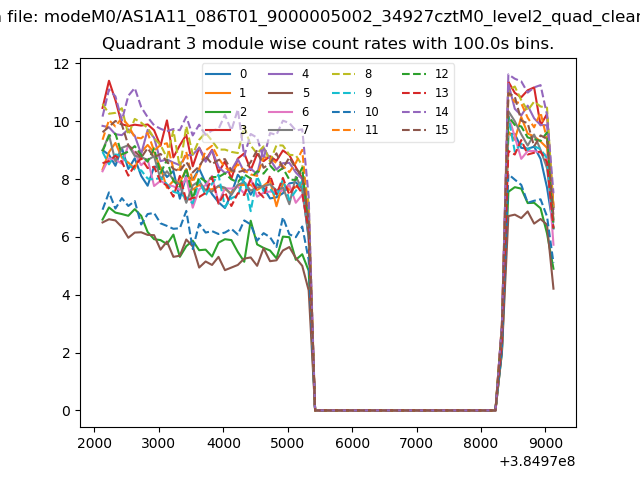
| Module-wise count rates for Quadrant C Data is divided into 100 sec bins |
 |
 |
| Module-wise count rates for Quadrant D Data is divided into 100 sec bins |
 |
 |
| Parameter | Plot |
|---|---|
| CZT HV Monitor | 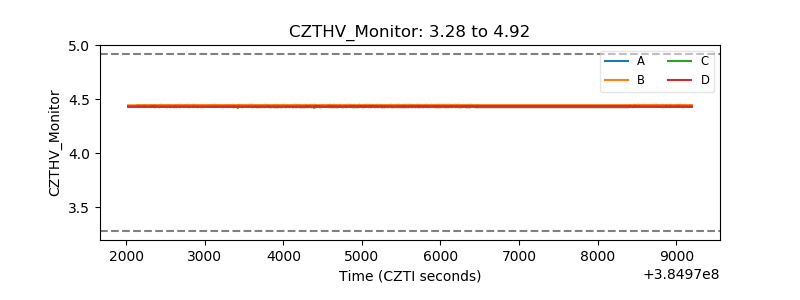 |
| D_VDD | 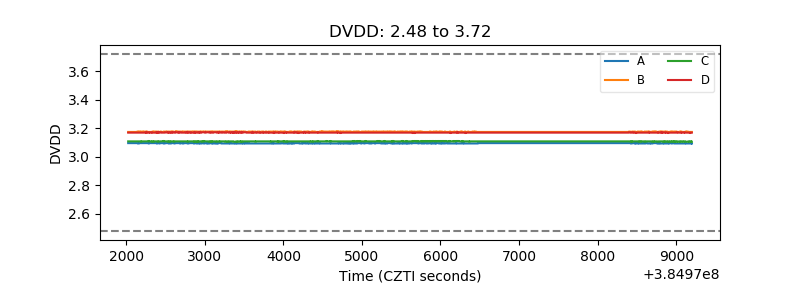 |
| Temperature 1 | 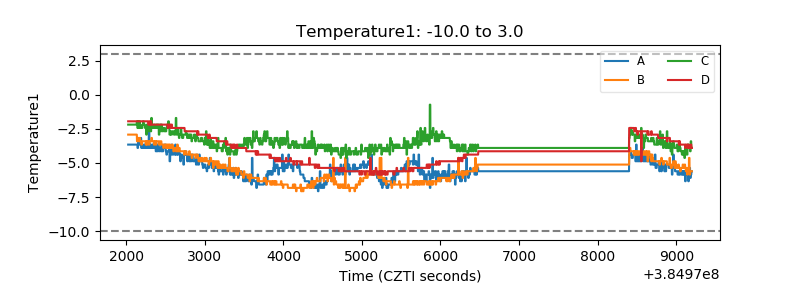 |
| Veto HV Monitor | 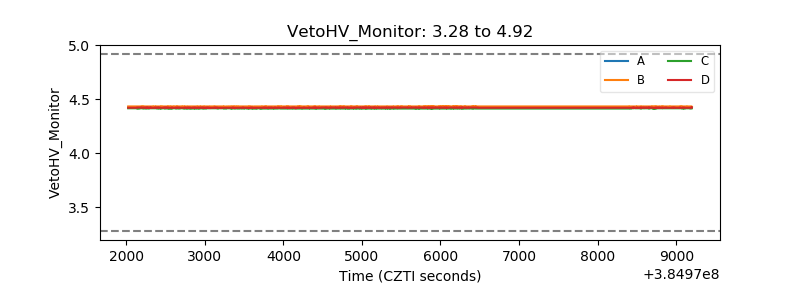 |
| Veto LLD | 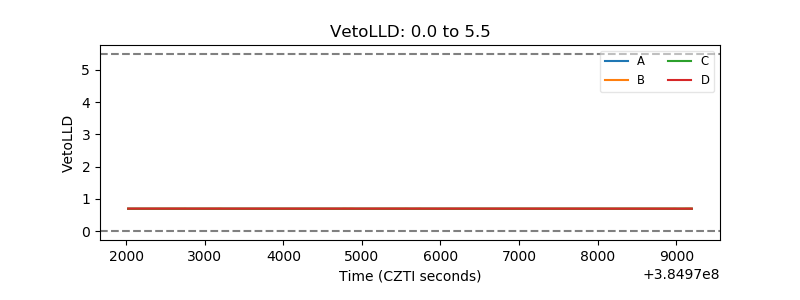 |
| Alpha Counter | 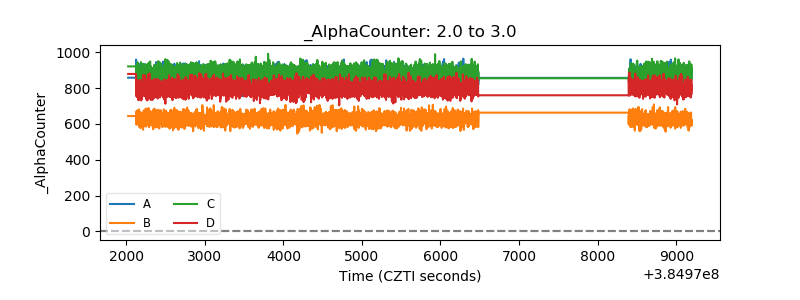 |
| _CPM_Rate | 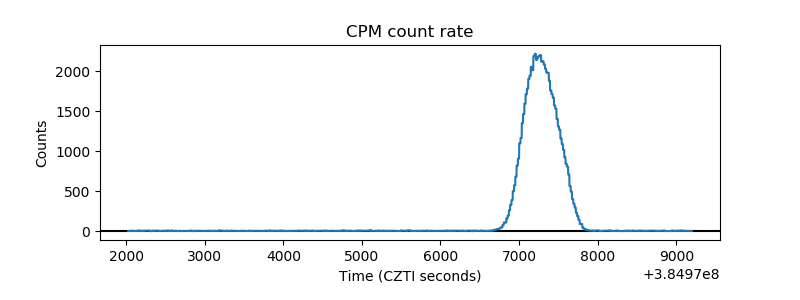 |
| CZT Counter | 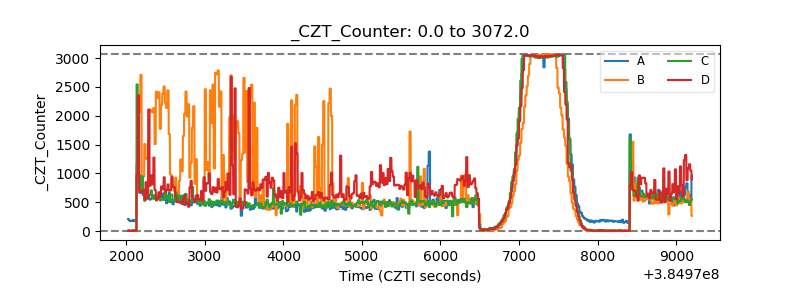 |
| +2.5 Volts monitor | 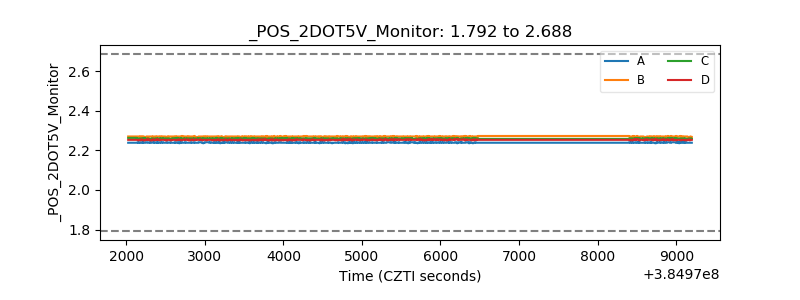 |
| +5 Volts monitor | 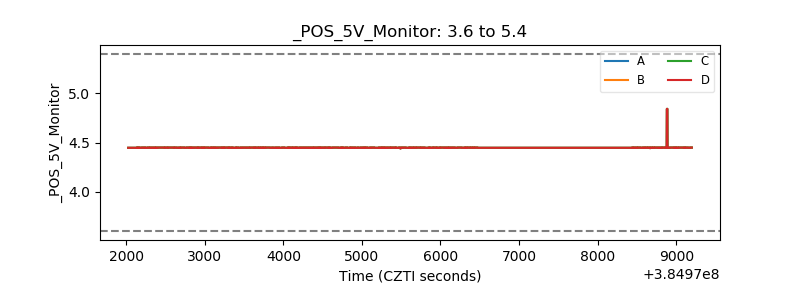 |
| _ROLL_ROT | 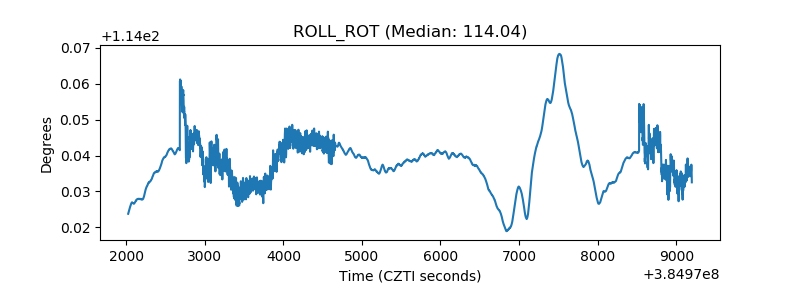 |
| _Roll_DEC | 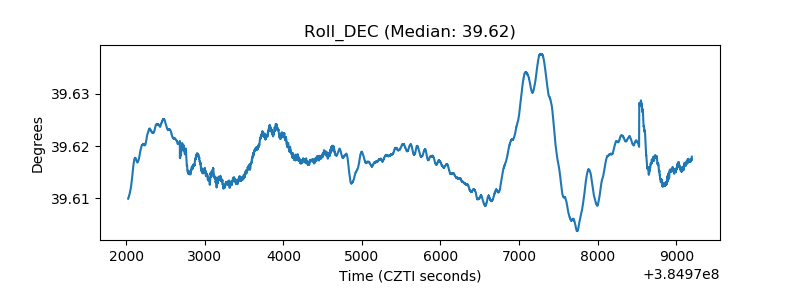 |
| _Roll_RA | 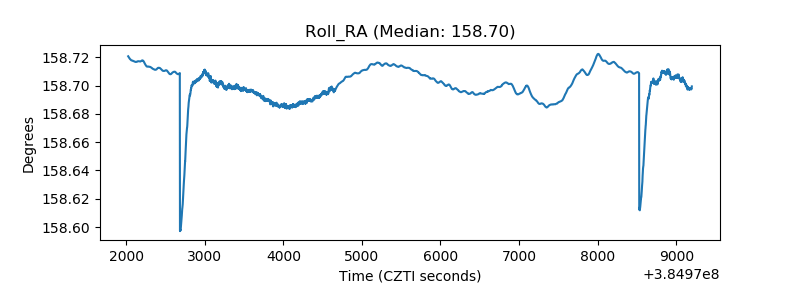 |
| Veto Counter | 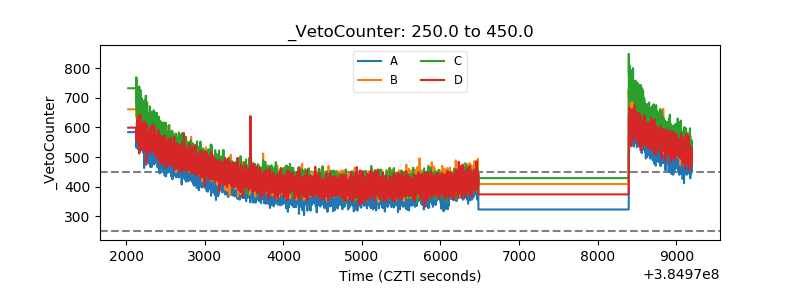 |