| Param | Original file | Final file |
|---|---|---|
| Filename | modeM0/AS1A11_086T01_9000005002_34917cztM0_level2.evt | modeM0/AS1A11_086T01_9000005002_34917cztM0_level2_quad_clean.evt |
| Size (bytes) | 430,306,560 | 61,848,000 |
| Size | 410.4 MB | 59.0 MB |
| Events in quadrant A | 3,040,226 | 378,284 |
| Events in quadrant B | 3,090,092 | 387,854 |
| Events in quadrant C | 2,782,022 | 385,253 |
| Events in quadrant D | 3,773,233 | 363,664 |
| Mode M9 | |||
|---|---|---|---|
| Quadrant | BADHDUFLAG | Total packets | Discarded packets |
| A | 0 | 35 | 0 |
| B | 0 | 35 | 0 |
| C | 0 | 35 | 0 |
| D | 0 | 36 | 0 |
| Mode SS | |||
|---|---|---|---|
| Quadrant | BADHDUFLAG | Total packets | Discarded packets |
| A | 0 | 104 | 0 |
| B | 0 | 104 | 0 |
| C | 0 | 104 | 0 |
| D | 0 | 104 | 0 |
| Mode M0 | |||
|---|---|---|---|
| Quadrant | BADHDUFLAG | Total packets | Discarded packets |
| A | 0 | 12308 | 3 |
| B | 0 | 12717 | 2 |
| C | 0 | 11476 | 2 |
| D | 0 | 14753 | 2 |
| Quadrant | Total seconds | Saturated seconds | Saturation percentage |
|---|---|---|---|
| A | 5101 | 62 | 1.215448% |
| B | 5101 | 157 | 3.077828% |
| C | 5101 | 72 | 1.411488% |
| D | 5101 | 161 | 3.156244% |
Noise dominated data is calculated using 1-second bins in cleaned event files. If a bin has >2000 counts, and if more than 50% of those come from <1% of pixels, then it is considered to be noise-dominated and hence unusable.
| Quadrant | # 1 sec bins | Bins with >0 counts | Bins with >2000 counts | High rate bins dominated by noise | Noise dominated (total time) | Noise dominated (detector-on time) | Marked lightcurve |
|---|---|---|---|---|---|---|---|
| A | 7044 | 5102 | 34 | 34 | 0.48% | 0.67% | 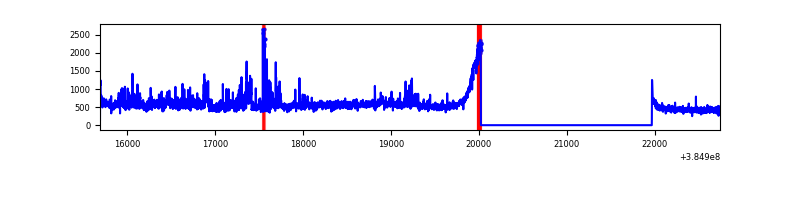 |
| B | 7044 | 5102 | 108 | 108 | 1.53% | 2.12% | 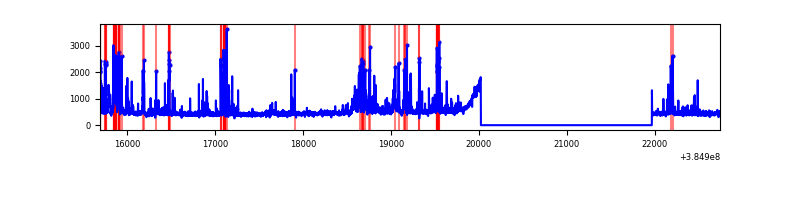 |
| C | 7044 | 5102 | 58 | 58 | 0.82% | 1.14% | 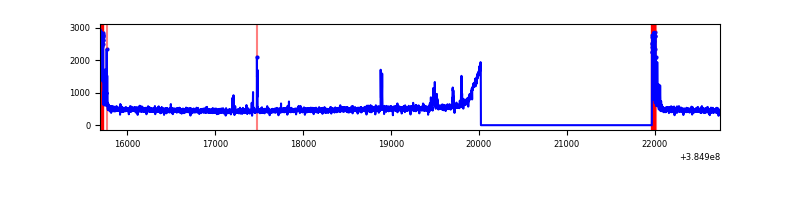 |
| D | 7044 | 5101 | 144 | 144 | 2.04% | 2.82% | 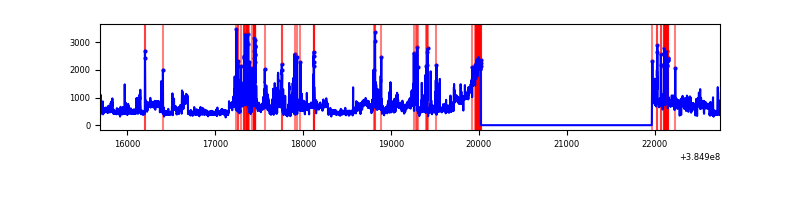 |
Top three noisy pixels from each quadrant. If the there are fewer than three noisy pixels in the level2.evt file, extra rows are filled as -1
| Pixel properties | Quadrant properties | ||||||
|---|---|---|---|---|---|---|---|
| Quadrant | DetID | PixID | Counts | Sigma | Mean | Median | Sigma |
| A | 15 | 169 | 559839 | 4394.33 | 622 | 613 | 127.3 |
| A | 10 | 83 | 58500 | 454.87 | 622 | 613 | 127.3 |
| A | 13 | 6 | 11951 | 89.09 | 622 | 613 | 127.3 |
| B | 5 | 172 | 698810 | 5941.31 | 597 | 583 | 117.5 |
| B | 0 | 245 | 23294 | 193.25 | 597 | 583 | 117.5 |
| B | 4 | 232 | 19628 | 162.06 | 597 | 583 | 117.5 |
| C | 15 | 214 | 216482 | 1551.18 | 588 | 594 | 139.2 |
| C | 0 | 10 | 199702 | 1430.62 | 588 | 594 | 139.2 |
| C | 8 | 111 | 50697 | 360.0 | 588 | 594 | 139.2 |
| D | 8 | 195 | 837758 | 5551.99 | 595 | 581 | 150.8 |
| D | 2 | 249 | 306045 | 2025.78 | 595 | 581 | 150.8 |
| D | 13 | 249 | 119991 | 791.9 | 595 | 581 | 150.8 |
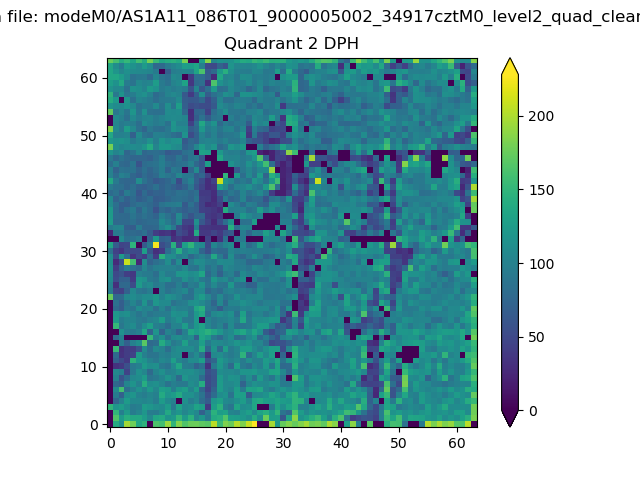
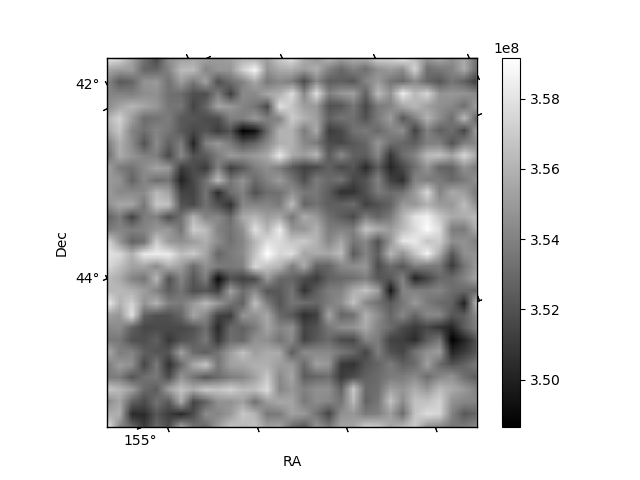
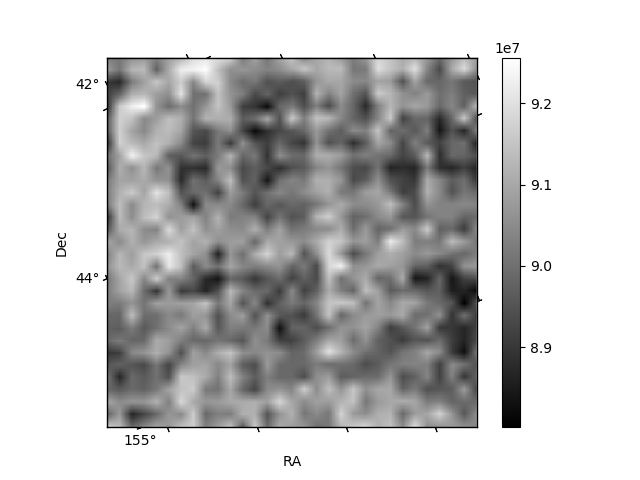
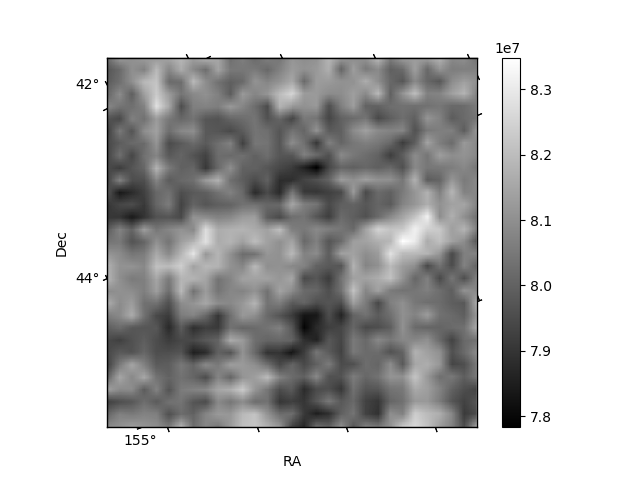
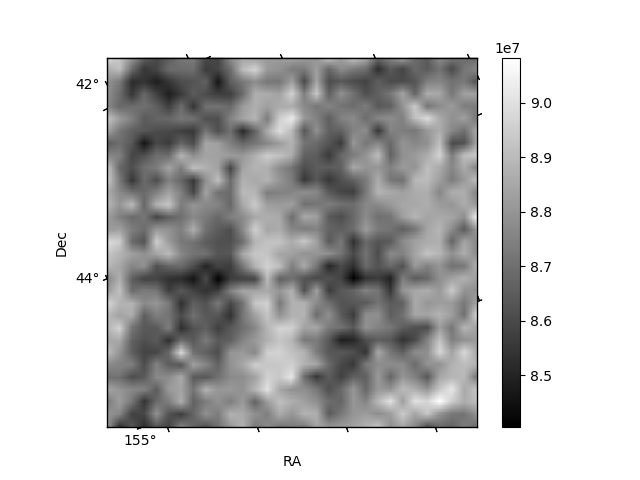
Histogram calculated using DETX and DETY for each event in the final _common_clean file
| Quadrant A | 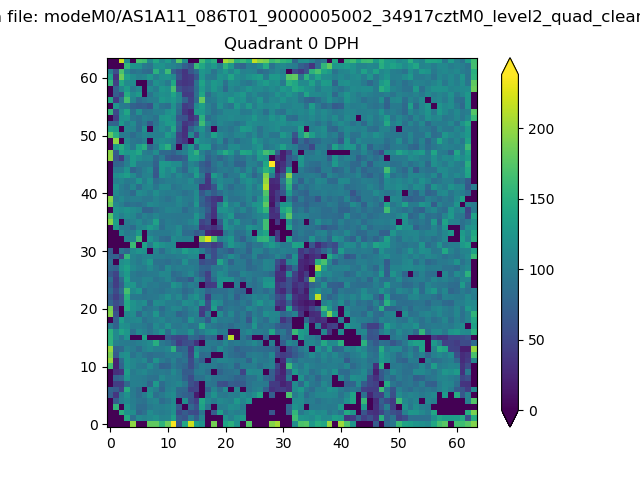 |
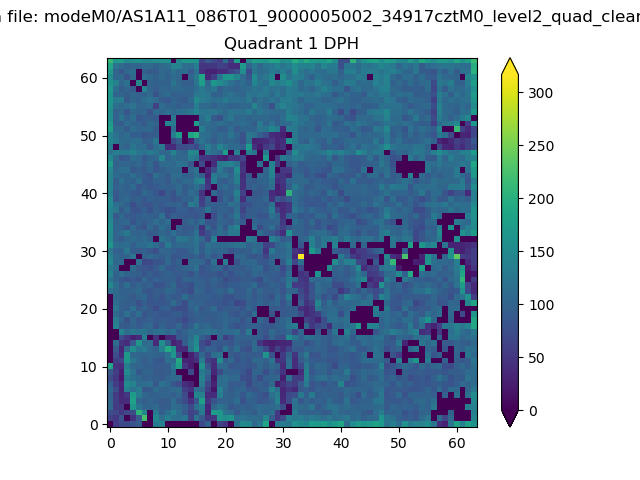 |
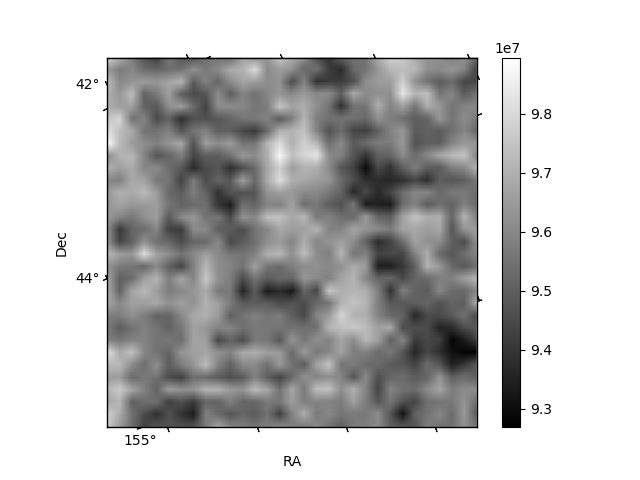
Quadrant B |
|---|---|---|---|
| Quadrant D | 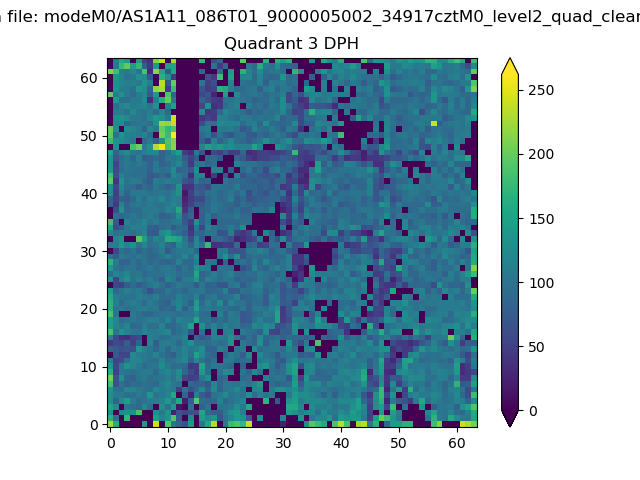 |
 |
Quadrant C |
| Plot type | Count rate plots | Images |
|---|---|---|
| Comparison with Poisson distribution Blue bars denote a histogram of data divided into 1 sec bins. Red curve is a Poisson curve with rate = median count rate of data. |
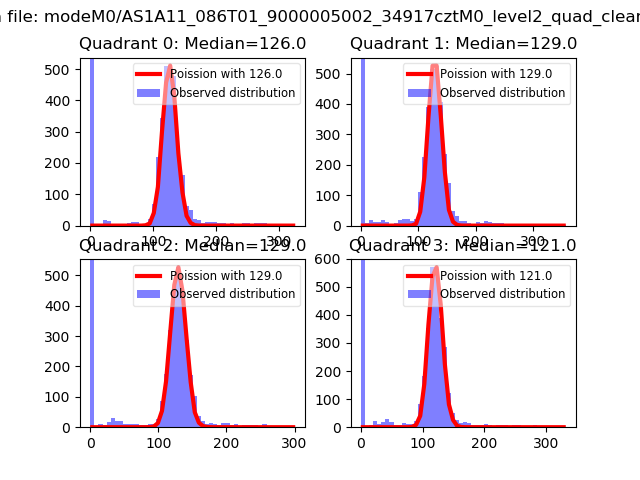 |
 |
| Quadrant-wise count rates Data is divided into 100 sec bins |
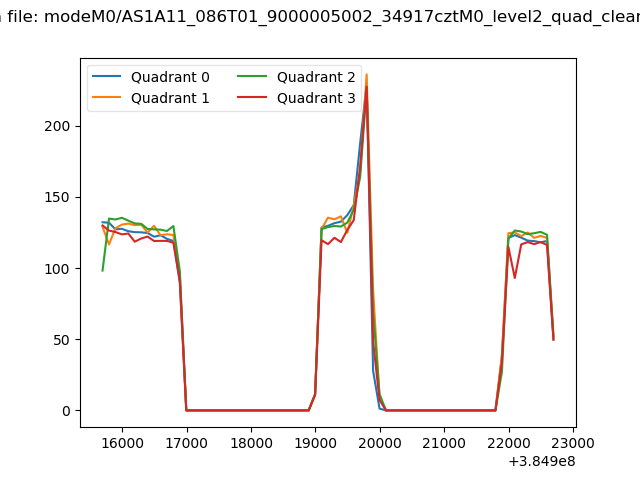 |
|
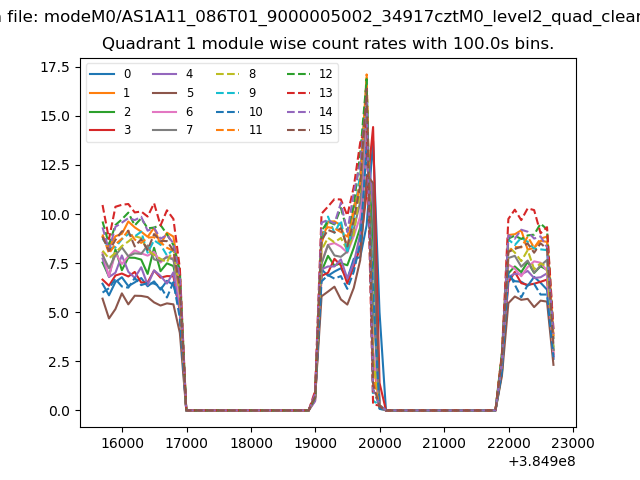
| Module-wise count rates for Quadrant A Data is divided into 100 sec bins |
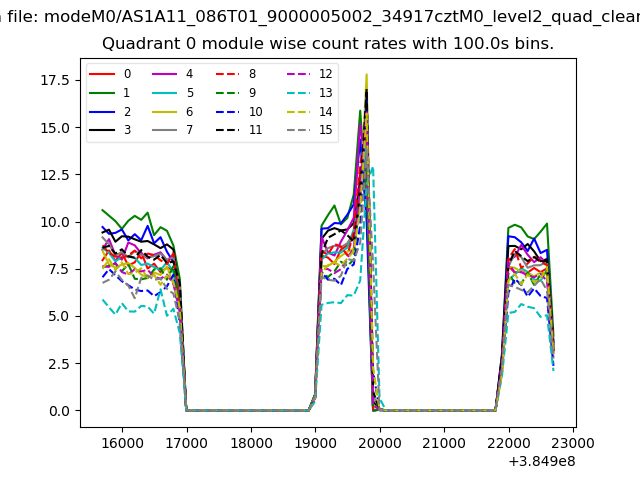 |
 |
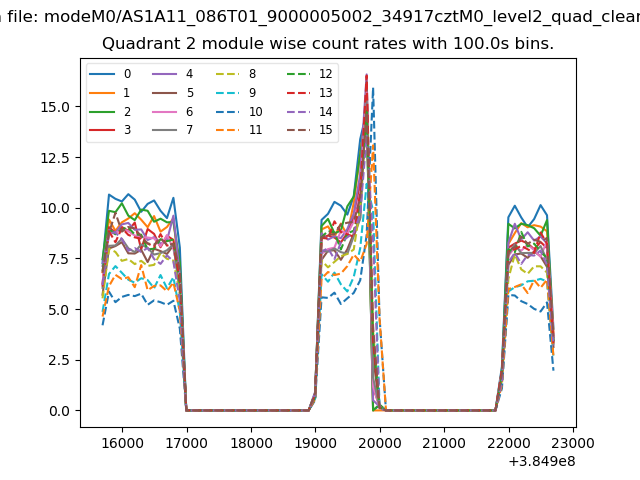
| Module-wise count rates for Quadrant B Data is divided into 100 sec bins |
 |
 |
| Module-wise count rates for Quadrant C Data is divided into 100 sec bins |
 |
 |
| Module-wise count rates for Quadrant D Data is divided into 100 sec bins |
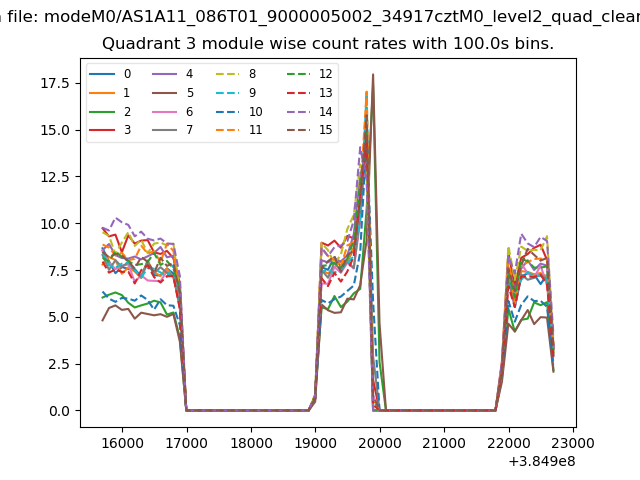 |
 |
| Parameter | Plot |
|---|---|
| CZT HV Monitor | 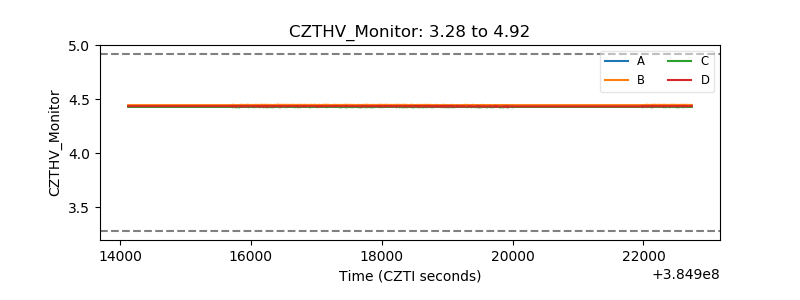 |
| D_VDD |  |
| Temperature 1 | 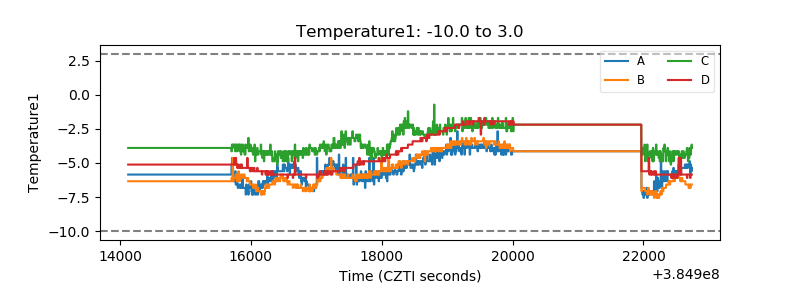 |
| Veto HV Monitor | 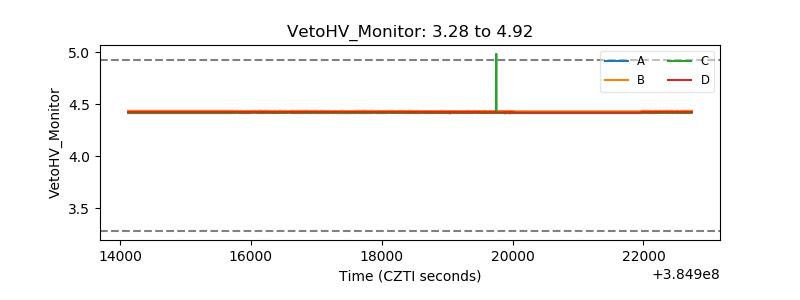 |
| Veto LLD | 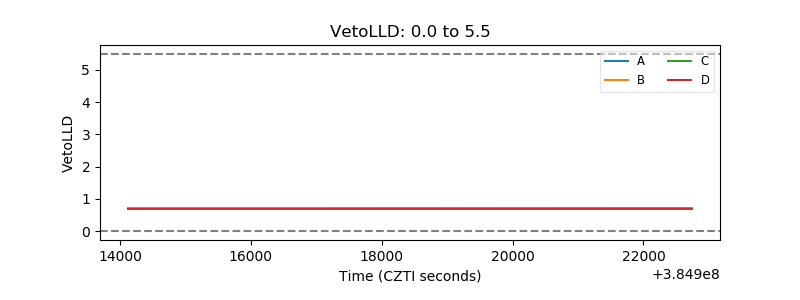 |
| Alpha Counter | 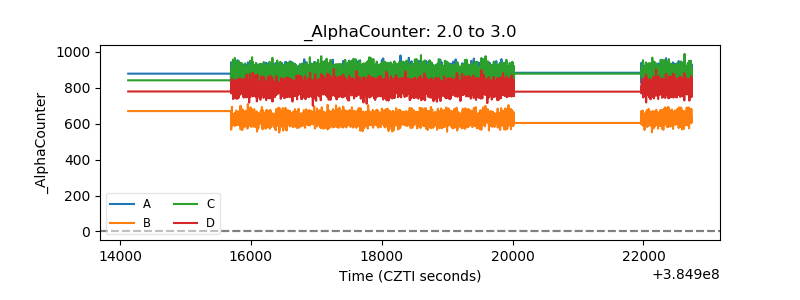 |
| _CPM_Rate | 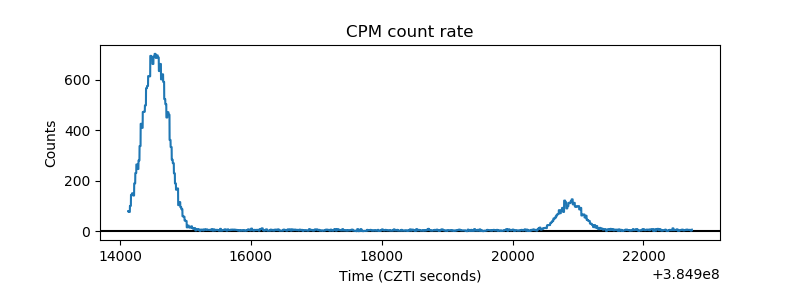 |
| CZT Counter | 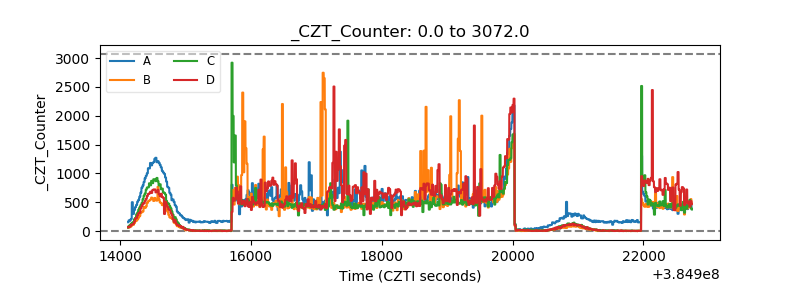 |
| +2.5 Volts monitor | 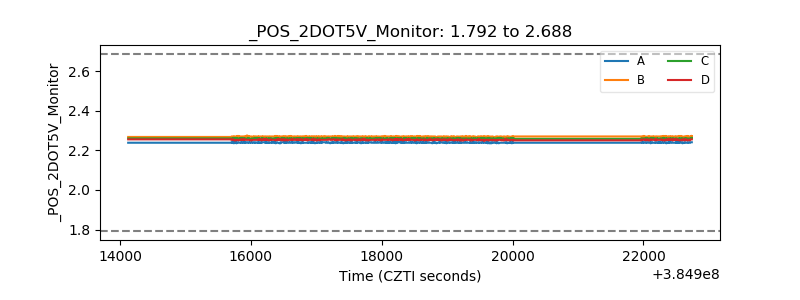 |
| +5 Volts monitor | 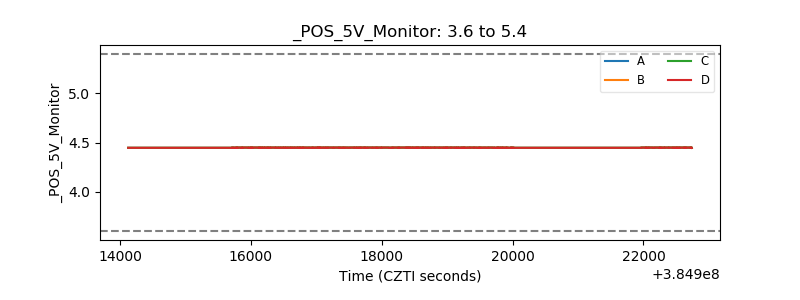 |
| _ROLL_ROT | 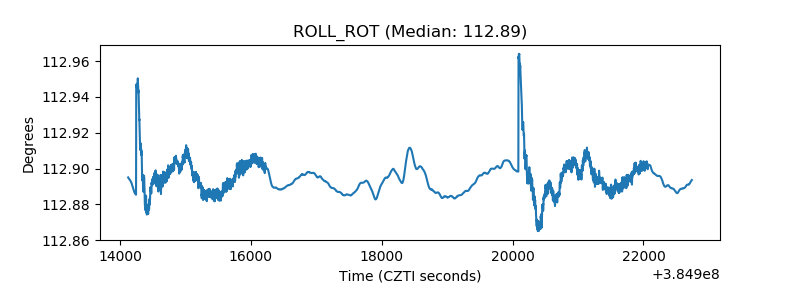 |
| _Roll_DEC | 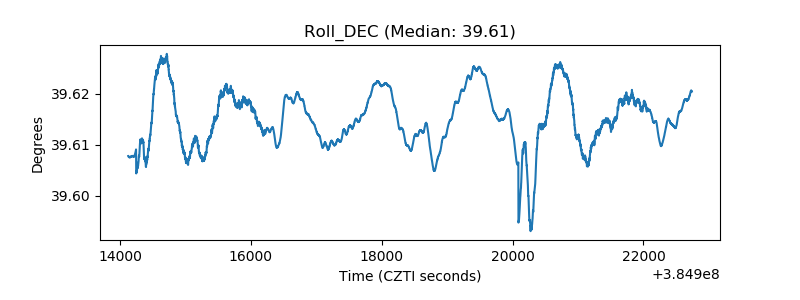 |
| _Roll_RA | 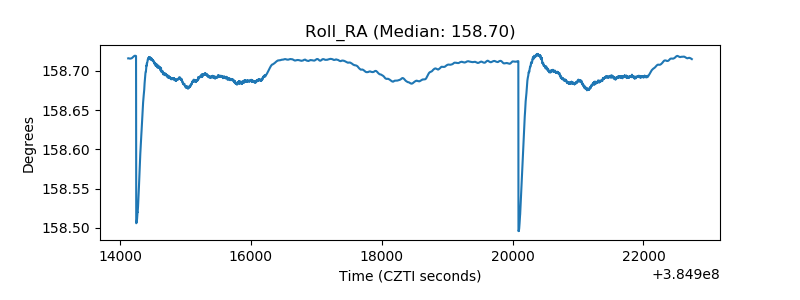 |
| Veto Counter | 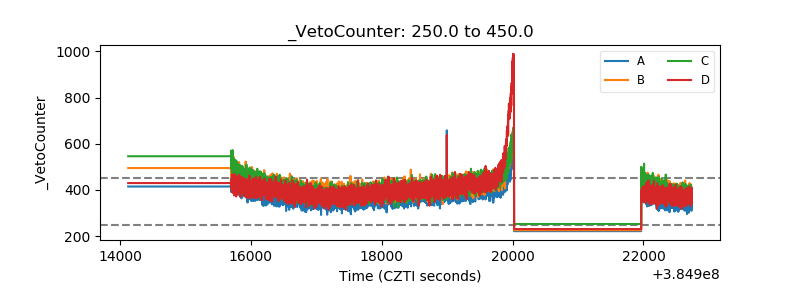 |