| Param | Original file | Final file |
|---|---|---|
| Filename | modeM0/AS1A11_065T21_9000005000_34909cztM0_level2.evt | modeM0/AS1A11_065T21_9000005000_34909cztM0_level2_quad_clean.evt |
| Size (bytes) | 423,198,720 | 88,689,600 |
| Size | 403.6 MB | 84.6 MB |
| Events in quadrant A | 2,478,529 | 594,522 |
| Events in quadrant B | 3,387,544 | 582,873 |
| Events in quadrant C | 2,671,160 | 585,993 |
| Events in quadrant D | 3,918,677 | 550,629 |
| Mode M0 | |||
|---|---|---|---|
| Quadrant | BADHDUFLAG | Total packets | Discarded packets |
| A | 0 | 10911 | 2 |
| B | 0 | 13582 | 1 |
| C | 0 | 11041 | 1 |
| D | 0 | 15343 | 1 |
| Mode SS | |||
|---|---|---|---|
| Quadrant | BADHDUFLAG | Total packets | Discarded packets |
| A | 0 | 108 | 0 |
| B | 0 | 108 | 0 |
| C | 0 | 108 | 0 |
| D | 0 | 108 | 0 |
| Mode M9 | |||
|---|---|---|---|
| Quadrant | BADHDUFLAG | Total packets | Discarded packets |
| A | 0 | 16 | 0 |
| B | 0 | 16 | 0 |
| C | 0 | 16 | 0 |
| D | 0 | 16 | 0 |
| Quadrant | Total seconds | Saturated seconds | Saturation percentage |
|---|---|---|---|
| A | 5309 | 10 | 0.188359% |
| B | 5309 | 306 | 5.763797% |
| C | 5309 | 20 | 0.376719% |
| D | 5309 | 148 | 2.787719% |
Noise dominated data is calculated using 1-second bins in cleaned event files. If a bin has >2000 counts, and if more than 50% of those come from <1% of pixels, then it is considered to be noise-dominated and hence unusable.
| Quadrant | # 1 sec bins | Bins with >0 counts | Bins with >2000 counts | High rate bins dominated by noise | Noise dominated (total time) | Noise dominated (detector-on time) | Marked lightcurve |
|---|---|---|---|---|---|---|---|
| A | 6922 | 5310 | 1 | 1 | 0.01% | 0.02% | 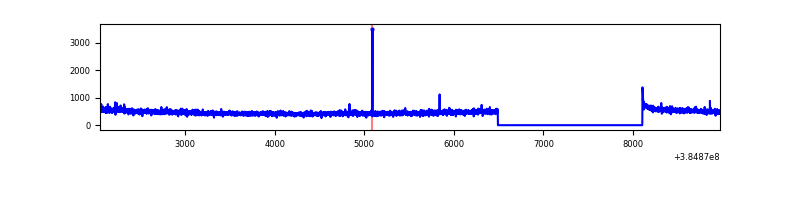 |
| B | 6922 | 5310 | 228 | 228 | 3.29% | 4.29% | 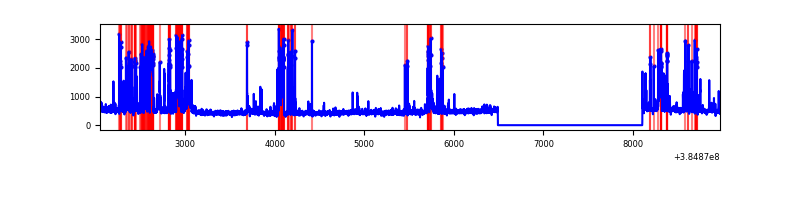 |
| C | 6922 | 5310 | 15 | 15 | 0.22% | 0.28% | 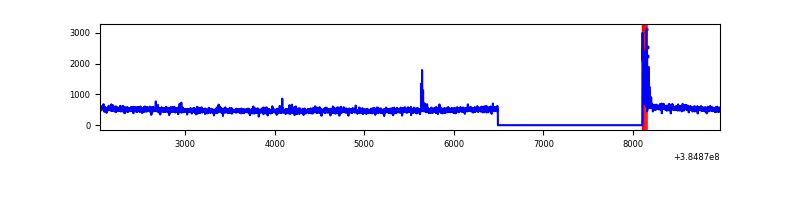 |
| D | 6922 | 5310 | 126 | 126 | 1.82% | 2.37% |  |
Top three noisy pixels from each quadrant. If the there are fewer than three noisy pixels in the level2.evt file, extra rows are filled as -1
| Pixel properties | Quadrant properties | ||||||
|---|---|---|---|---|---|---|---|
| Quadrant | DetID | PixID | Counts | Sigma | Mean | Median | Sigma |
| A | 10 | 83 | 41309 | 324.33 | 620 | 607 | 125.5 |
| A | 13 | 6 | 15603 | 119.49 | 620 | 607 | 125.5 |
| A | 15 | 169 | 13467 | 102.47 | 620 | 607 | 125.5 |
| B | 5 | 172 | 890174 | 7636.58 | 600 | 583 | 116.5 |
| B | 5 | 255 | 64250 | 546.54 | 600 | 583 | 116.5 |
| B | 0 | 190 | 29136 | 245.11 | 600 | 583 | 116.5 |
| C | 15 | 214 | 220146 | 1554.4 | 605 | 610 | 141.2 |
| C | 0 | 10 | 58720 | 411.44 | 605 | 610 | 141.2 |
| C | 14 | 67 | 20978 | 144.21 | 605 | 610 | 141.2 |
| D | 8 | 195 | 757387 | 5186.75 | 597 | 580 | 145.9 |
| D | 13 | 249 | 365963 | 2504.14 | 597 | 580 | 145.9 |
| D | 1 | 52 | 110449 | 752.98 | 597 | 580 | 145.9 |
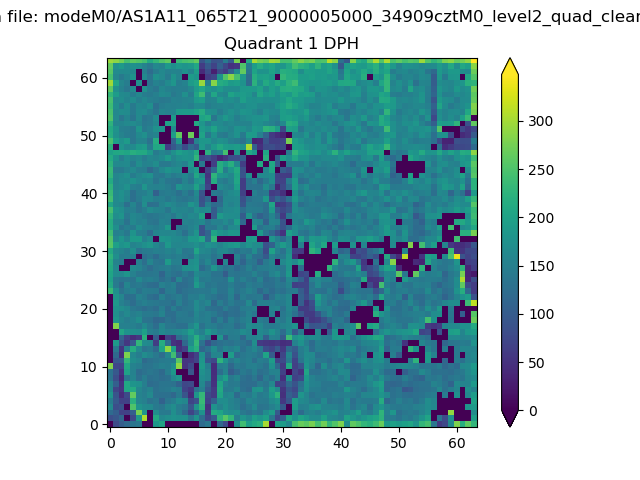
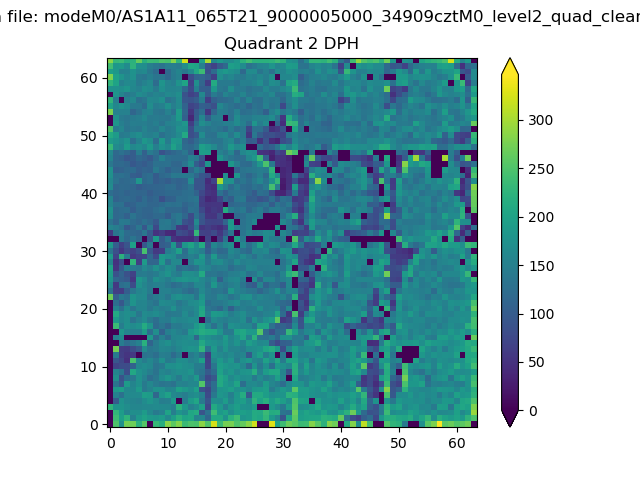
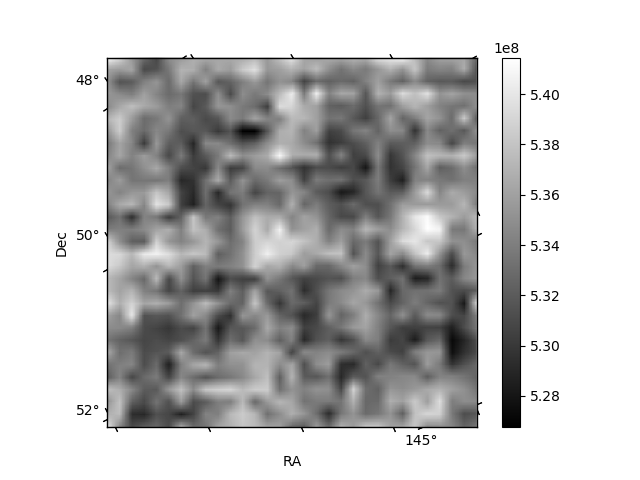
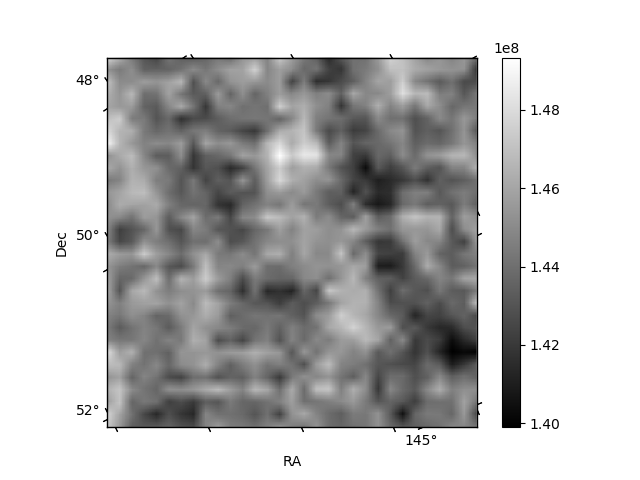
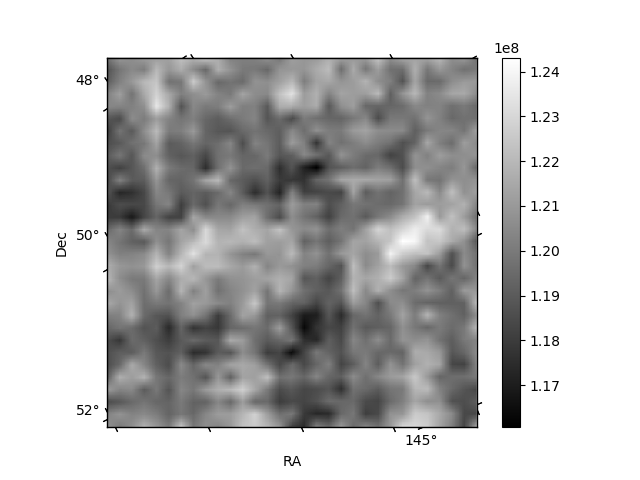
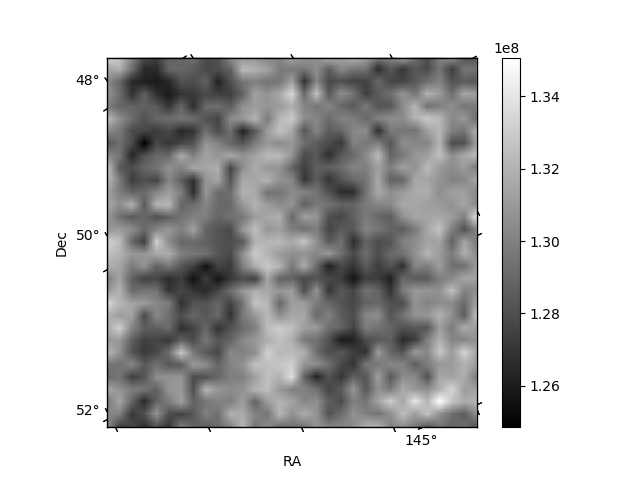
Histogram calculated using DETX and DETY for each event in the final _common_clean file
| Quadrant A | 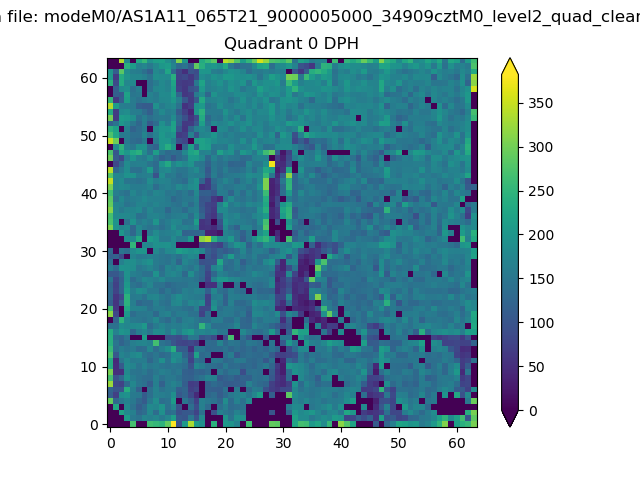 |
 |
Quadrant B |
|---|---|---|---|
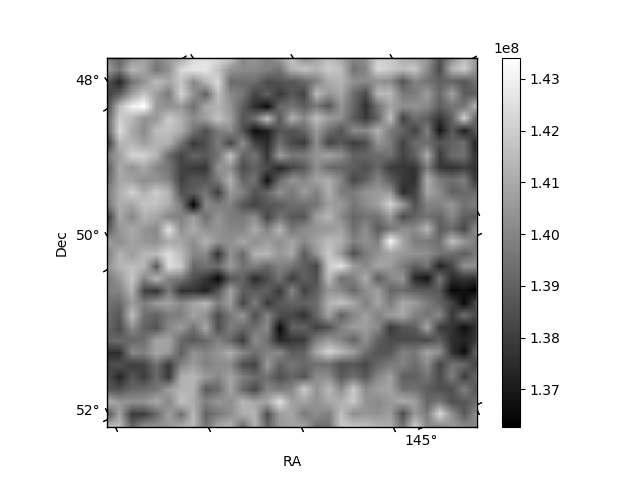
| Quadrant D | 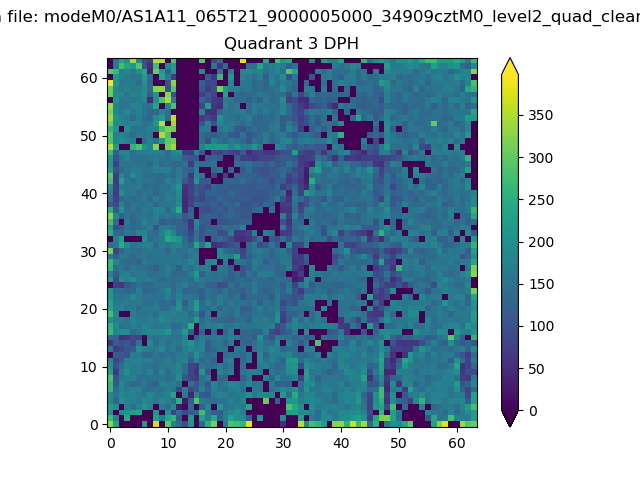 |
 |
Quadrant C |
| Plot type | Count rate plots | Images |
|---|---|---|
| Comparison with Poisson distribution Blue bars denote a histogram of data divided into 1 sec bins. Red curve is a Poisson curve with rate = median count rate of data. |
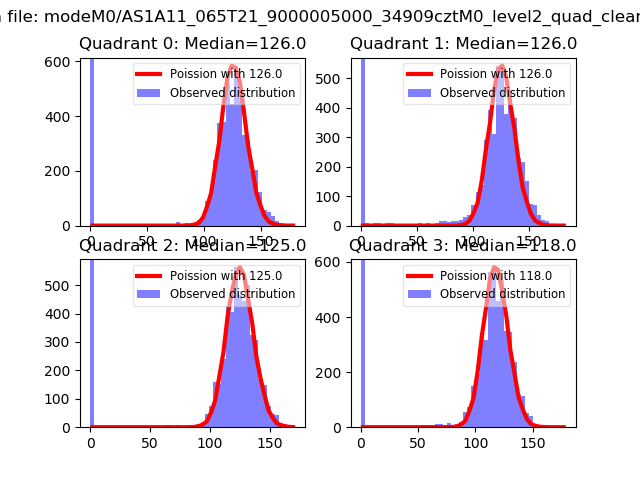 |
 |
| Quadrant-wise count rates Data is divided into 100 sec bins |
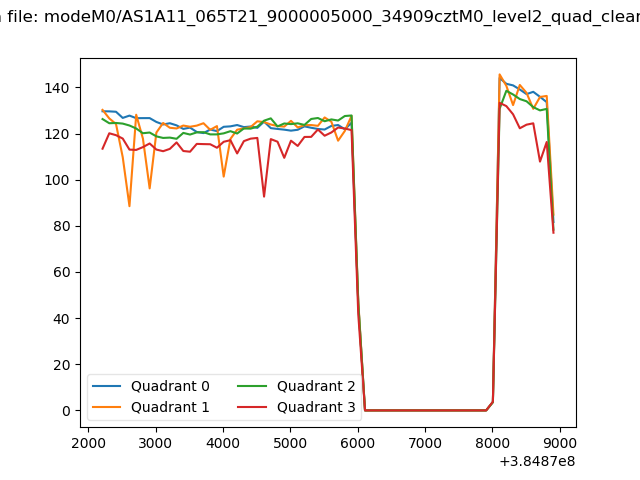 |
|
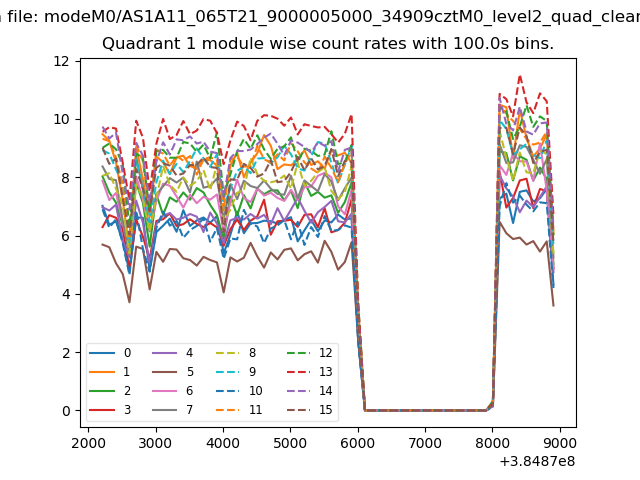
| Module-wise count rates for Quadrant A Data is divided into 100 sec bins |
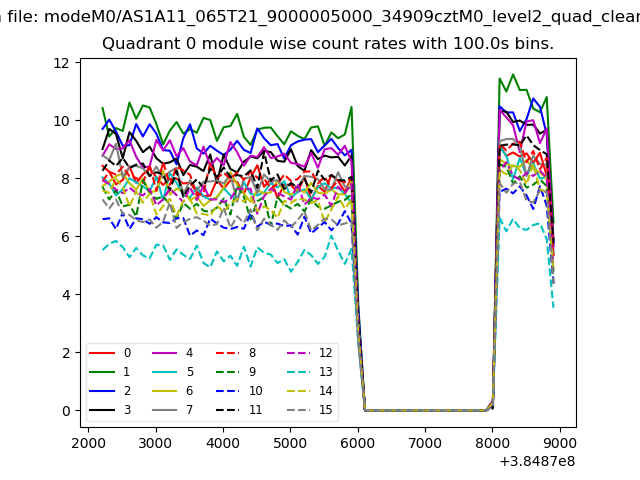 |
 |
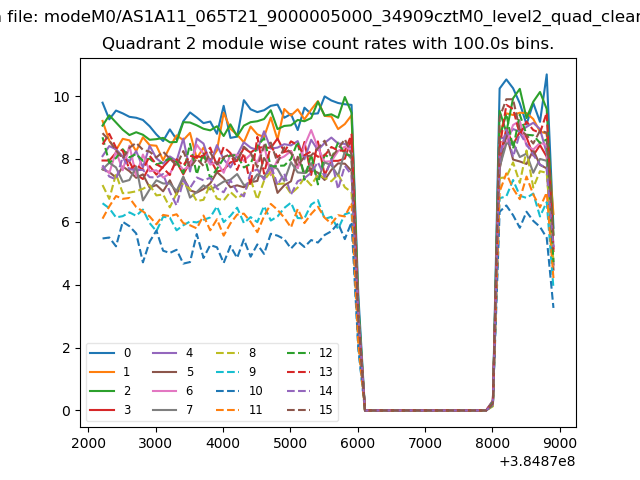
| Module-wise count rates for Quadrant B Data is divided into 100 sec bins |
 |
 |
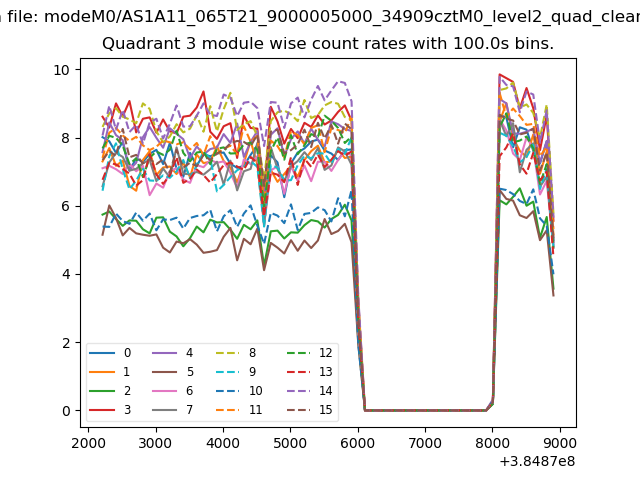
| Module-wise count rates for Quadrant C Data is divided into 100 sec bins |
 |
 |
| Module-wise count rates for Quadrant D Data is divided into 100 sec bins |
 |
 |
| Parameter | Plot |
|---|---|
| CZT HV Monitor | 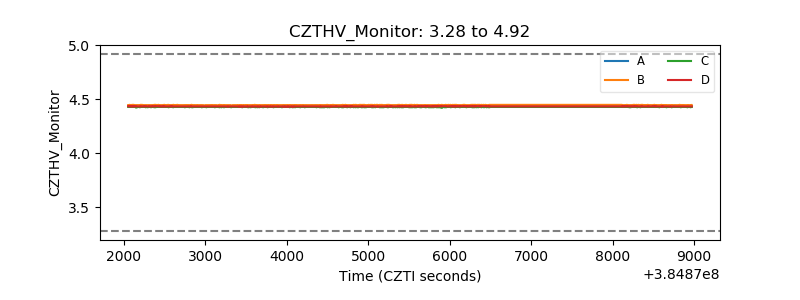 |
| D_VDD | 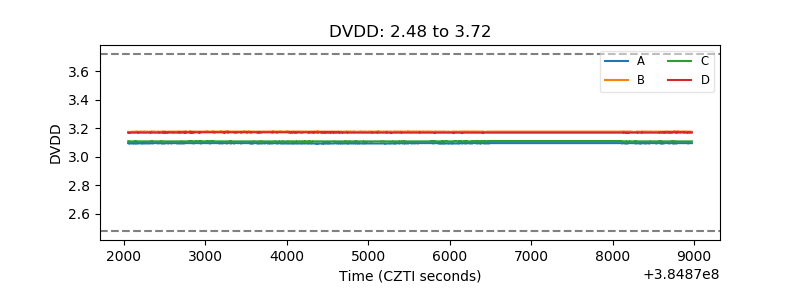 |
| Temperature 1 | 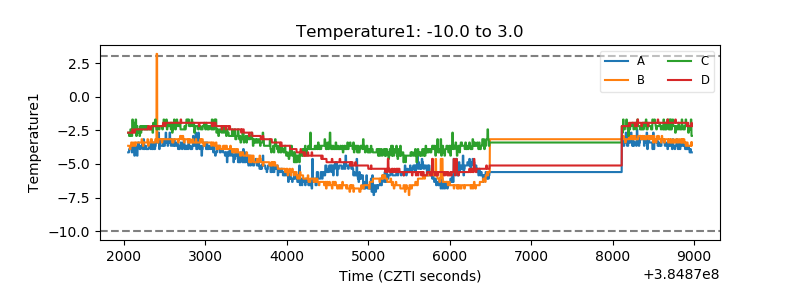 |
| Veto HV Monitor | 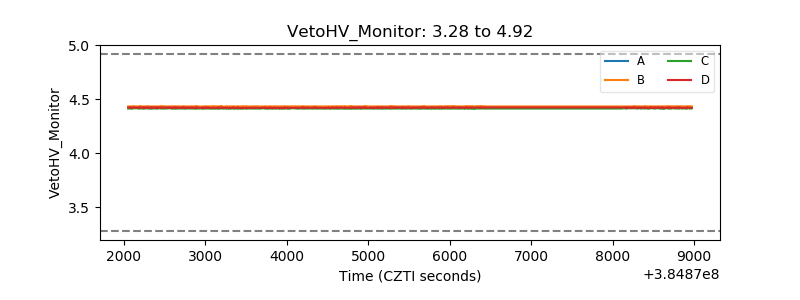 |
| Veto LLD | 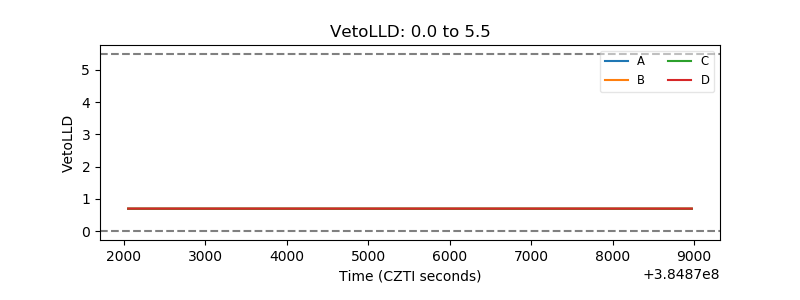 |
| Alpha Counter | 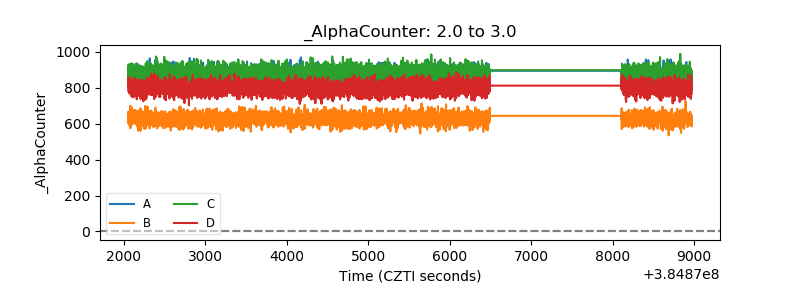 |
| _CPM_Rate | 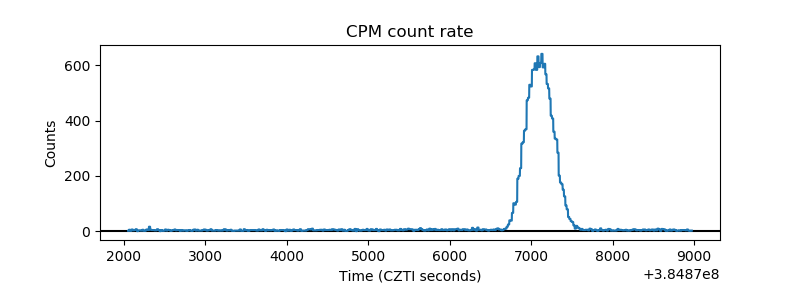 |
| CZT Counter | 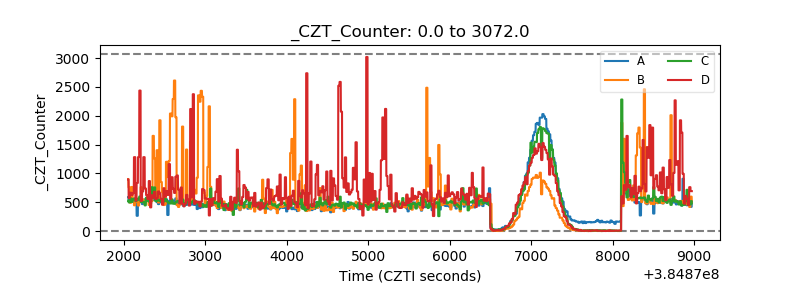 |
| +2.5 Volts monitor | 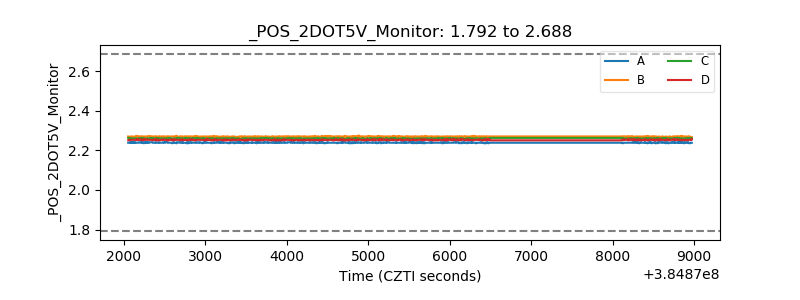 |
| +5 Volts monitor | 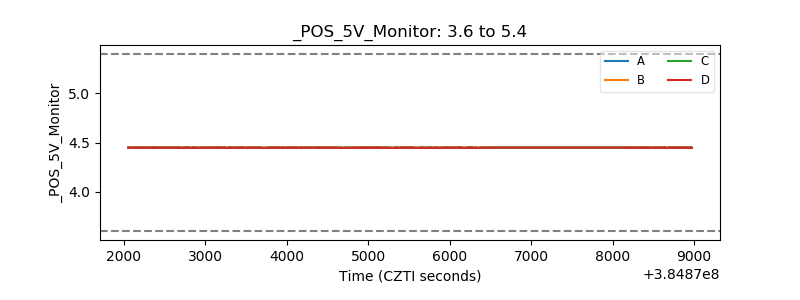 |
| _ROLL_ROT | 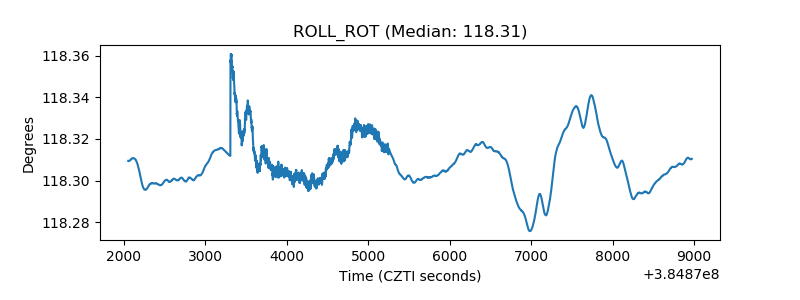 |
| _Roll_DEC | 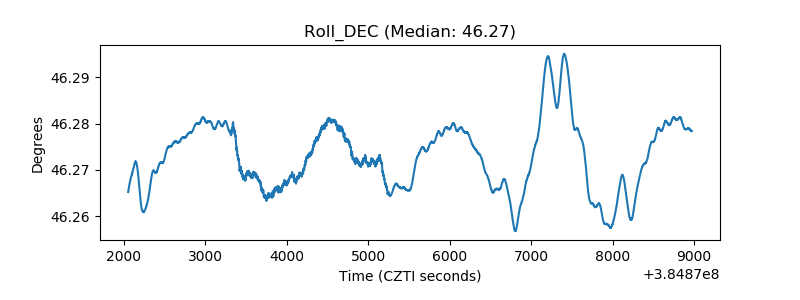 |
| _Roll_RA | 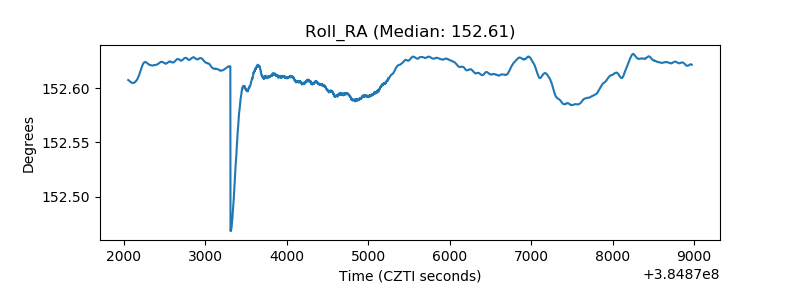 |
| Veto Counter | 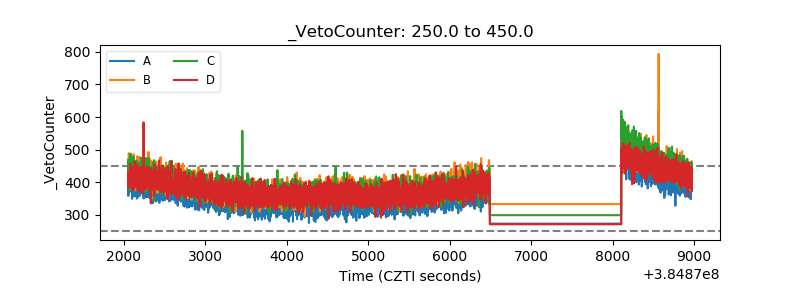 |