| Param | Original file | Final file |
|---|---|---|
| Filename | modeM0/AS1A11_065T05_9000004998_34905cztM0_level2.evt | modeM0/AS1A11_065T05_9000004998_34905cztM0_level2_quad_clean.evt |
| Size (bytes) | 481,829,760 | 61,643,520 |
| Size | 459.5 MB | 58.8 MB |
| Events in quadrant A | 2,739,874 | 373,281 |
| Events in quadrant B | 3,131,522 | 378,658 |
| Events in quadrant C | 3,080,098 | 367,995 |
| Events in quadrant D | 5,241,939 | 335,377 |
| Mode M9 | |||
|---|---|---|---|
| Quadrant | BADHDUFLAG | Total packets | Discarded packets |
| A | 0 | 22 | 0 |
| B | 0 | 22 | 0 |
| C | 0 | 22 | 0 |
| D | 0 | 23 | 0 |
| Mode SS | |||
|---|---|---|---|
| Quadrant | BADHDUFLAG | Total packets | Discarded packets |
| A | 0 | 118 | 0 |
| B | 0 | 118 | 0 |
| C | 0 | 118 | 0 |
| D | 0 | 118 | 0 |
| Mode M0 | |||
|---|---|---|---|
| Quadrant | BADHDUFLAG | Total packets | Discarded packets |
| A | 0 | 11893 | 3 |
| B | 0 | 13010 | 2 |
| C | 0 | 12421 | 2 |
| D | 0 | 19798 | 2 |
| Quadrant | Total seconds | Saturated seconds | Saturation percentage |
|---|---|---|---|
| A | 5886 | 6 | 0.101937% |
| B | 5886 | 93 | 1.580020% |
| C | 5886 | 48 | 0.815494% |
| D | 5886 | 291 | 4.943935% |
Noise dominated data is calculated using 1-second bins in cleaned event files. If a bin has >2000 counts, and if more than 50% of those come from <1% of pixels, then it is considered to be noise-dominated and hence unusable.
| Quadrant | # 1 sec bins | Bins with >0 counts | Bins with >2000 counts | High rate bins dominated by noise | Noise dominated (total time) | Noise dominated (detector-on time) | Marked lightcurve |
|---|---|---|---|---|---|---|---|
| A | 7229 | 5887 | 0 | 0 | 0.00% | 0.00% | 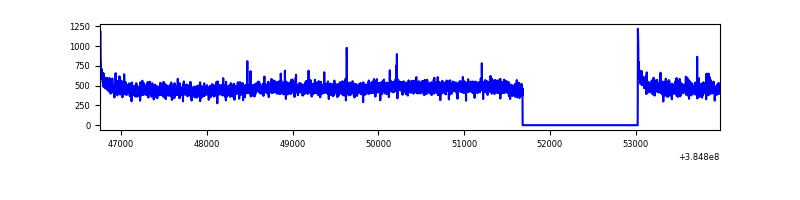 |
| B | 7229 | 5887 | 63 | 63 | 0.87% | 1.07% | 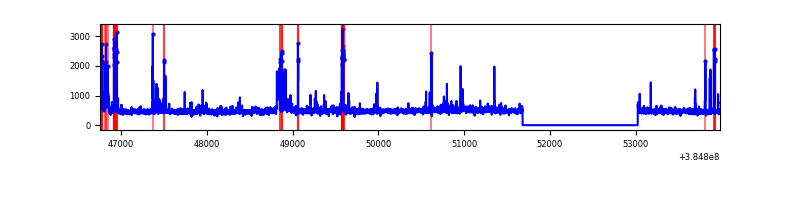 |
| C | 7229 | 5887 | 44 | 44 | 0.61% | 0.75% | 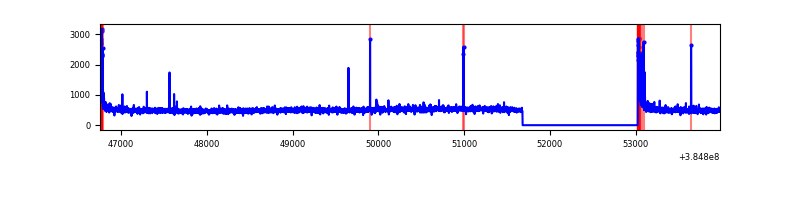 |
| D | 7229 | 5887 | 281 | 281 | 3.89% | 4.77% | 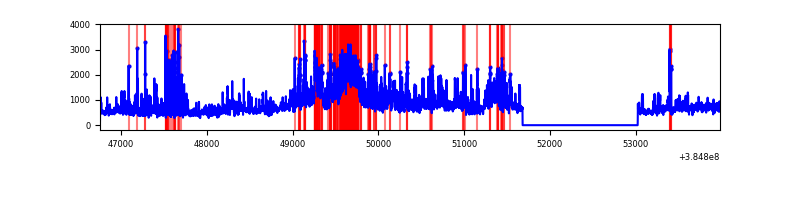 |
Top three noisy pixels from each quadrant. If the there are fewer than three noisy pixels in the level2.evt file, extra rows are filled as -1
| Pixel properties | Quadrant properties | ||||||
|---|---|---|---|---|---|---|---|
| Quadrant | DetID | PixID | Counts | Sigma | Mean | Median | Sigma |
| A | 10 | 83 | 60896 | 429.79 | 688 | 674 | 140.1 |
| A | 13 | 6 | 13356 | 90.51 | 688 | 674 | 140.1 |
| A | 13 | 254 | 9987 | 66.46 | 688 | 674 | 140.1 |
| B | 5 | 172 | 152750 | 1147.01 | 684 | 666 | 132.6 |
| B | 5 | 200 | 112515 | 843.56 | 684 | 666 | 132.6 |
| B | 4 | 232 | 69393 | 518.34 | 684 | 666 | 132.6 |
| C | 15 | 214 | 268373 | 1704.04 | 669 | 673 | 157.1 |
| C | 0 | 10 | 148390 | 940.29 | 669 | 673 | 157.1 |
| C | 14 | 67 | 23250 | 143.71 | 669 | 673 | 157.1 |
| D | 8 | 195 | 1121403 | 6814.52 | 661 | 642 | 164.5 |
| D | 12 | 227 | 786999 | 4781.26 | 661 | 642 | 164.5 |
| D | 10 | 253 | 228610 | 1386.1 | 661 | 642 | 164.5 |
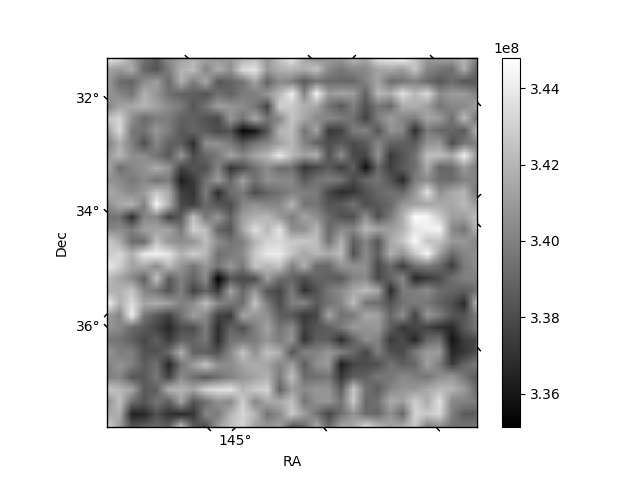
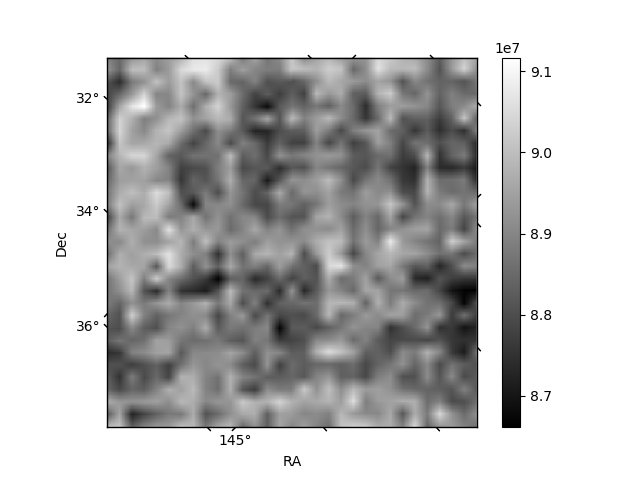
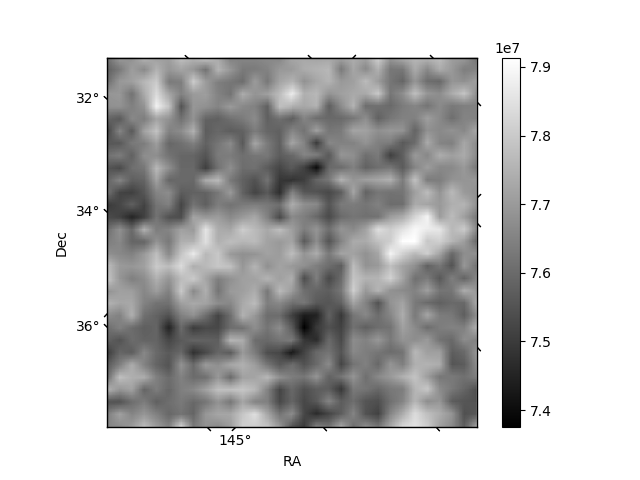
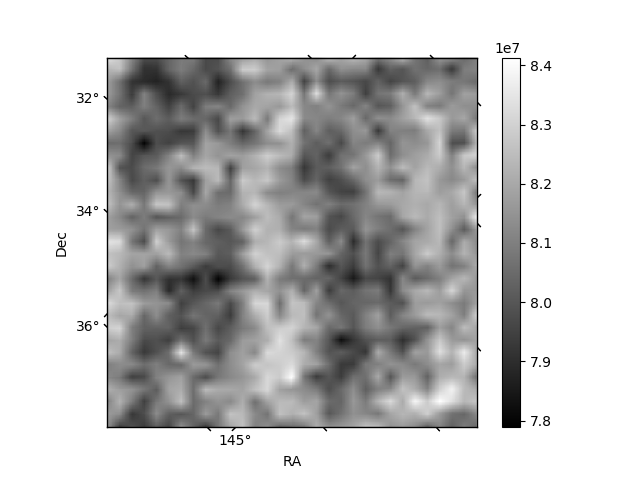
Histogram calculated using DETX and DETY for each event in the final _common_clean file
| Quadrant A | 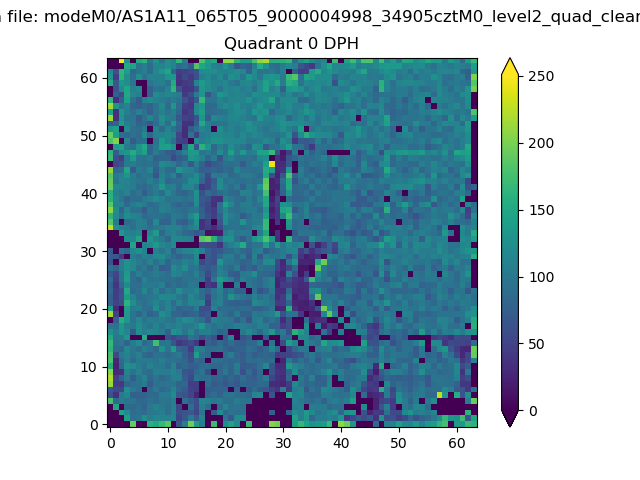 |
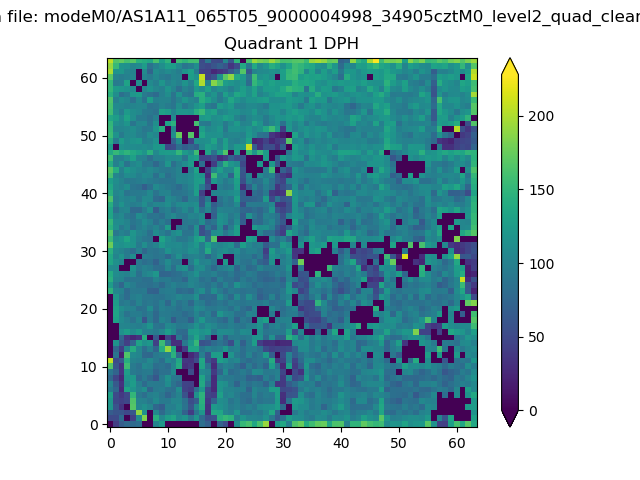 |
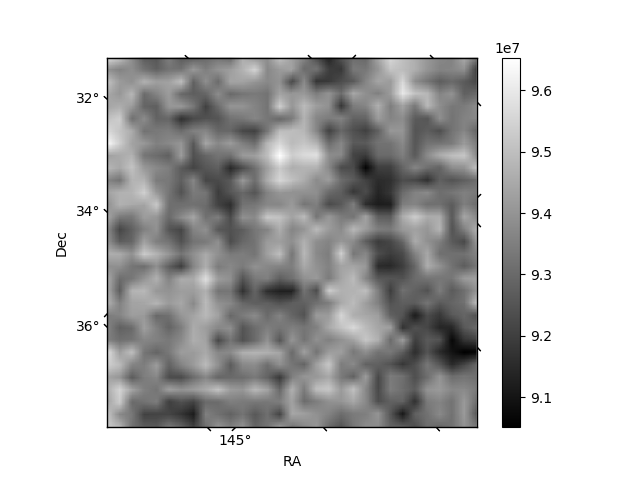
Quadrant B |
|---|---|---|---|
| Quadrant D | 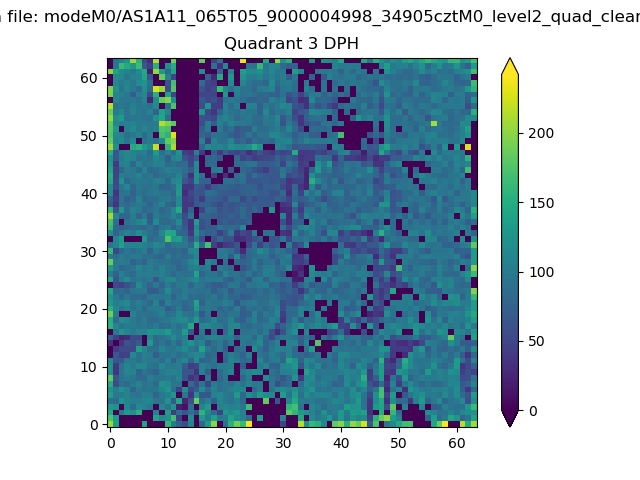 |
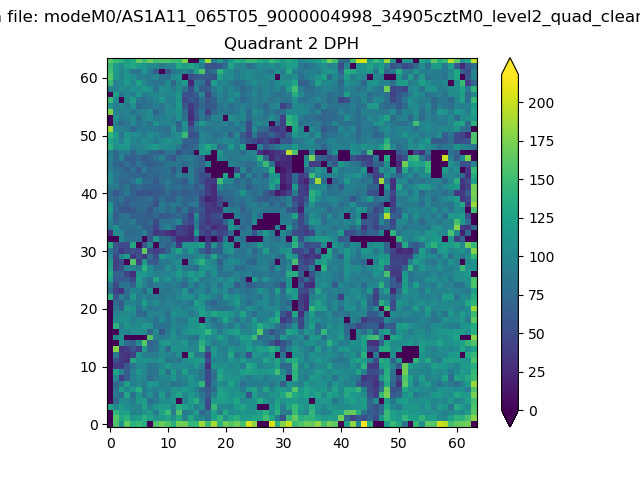 |
Quadrant C |
| Plot type | Count rate plots | Images |
|---|---|---|
| Comparison with Poisson distribution Blue bars denote a histogram of data divided into 1 sec bins. Red curve is a Poisson curve with rate = median count rate of data. |
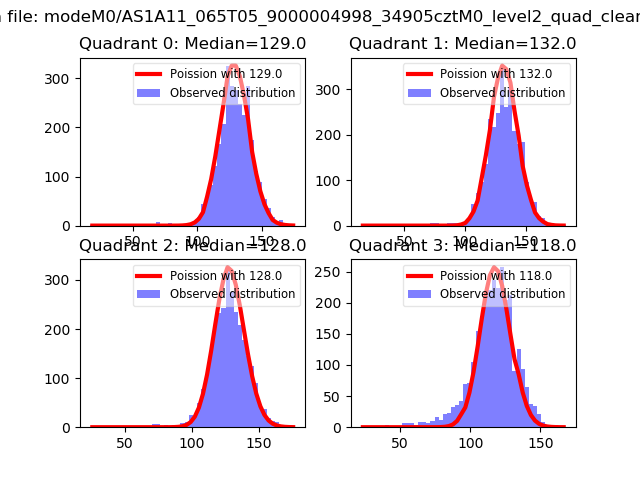 |
 |
| Quadrant-wise count rates Data is divided into 100 sec bins |
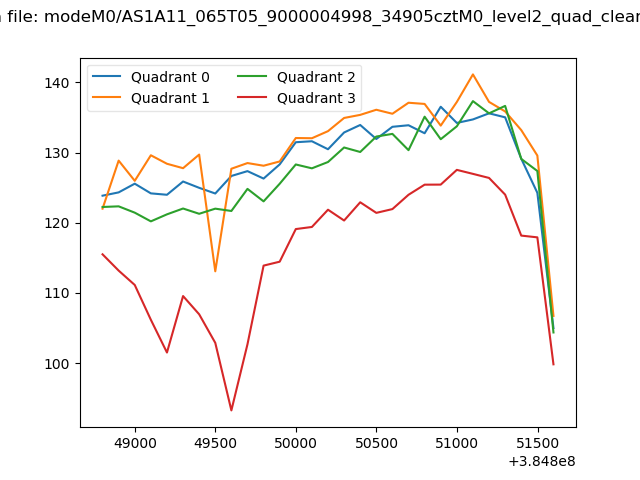 |
|
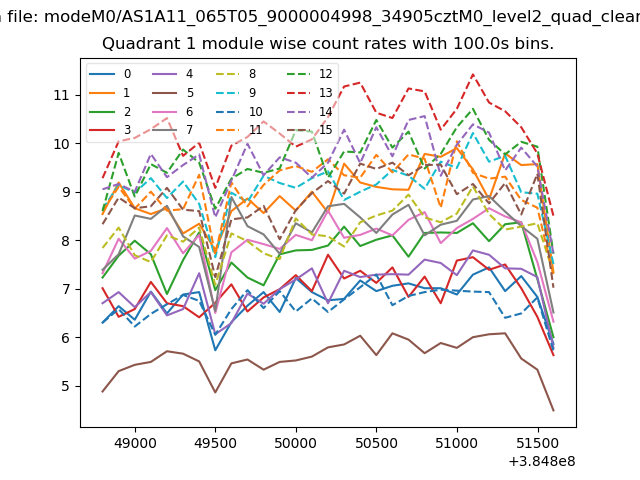
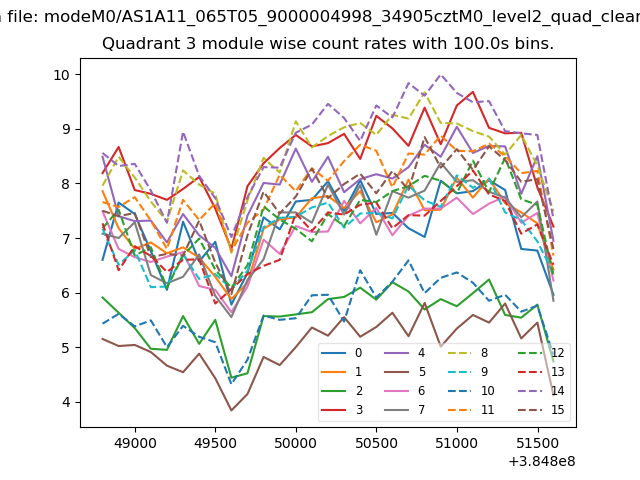
| Module-wise count rates for Quadrant A Data is divided into 100 sec bins |
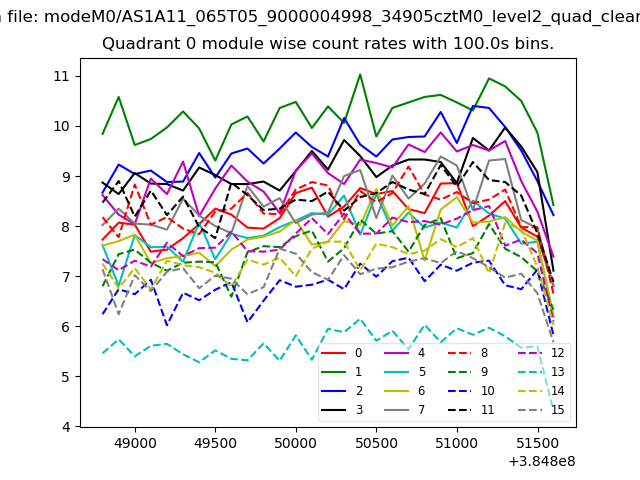 |
 |
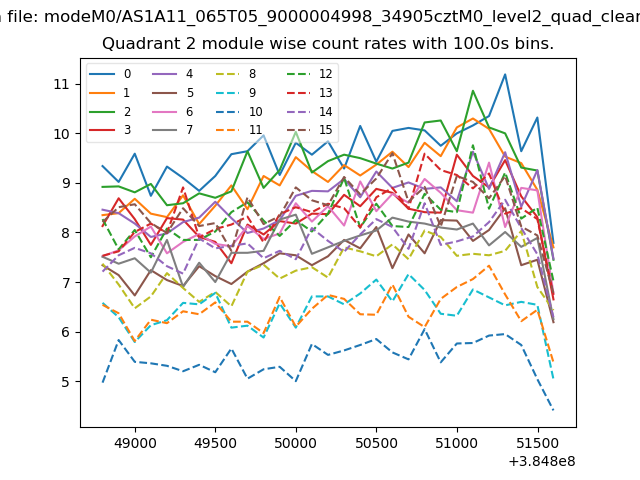
| Module-wise count rates for Quadrant B Data is divided into 100 sec bins |
 |
 |
| Module-wise count rates for Quadrant C Data is divided into 100 sec bins |
 |
 |
| Module-wise count rates for Quadrant D Data is divided into 100 sec bins |
 |
 |
| Parameter | Plot |
|---|---|
| CZT HV Monitor | 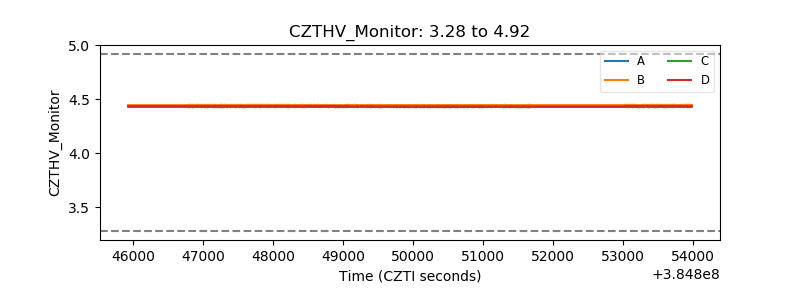 |
| D_VDD | 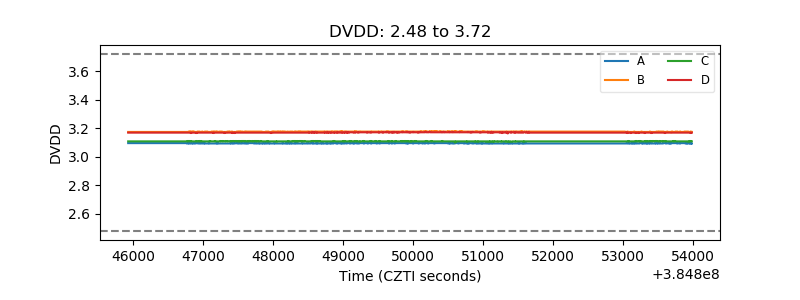 |
| Temperature 1 | 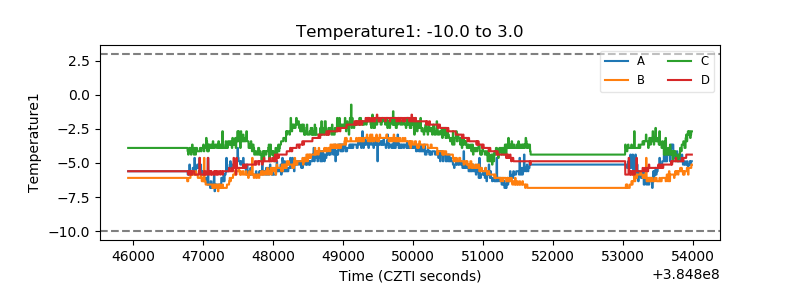 |
| Veto HV Monitor |  |
| Veto LLD | 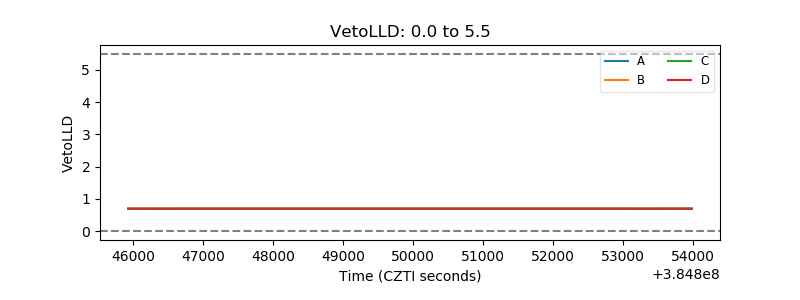 |
| Alpha Counter | 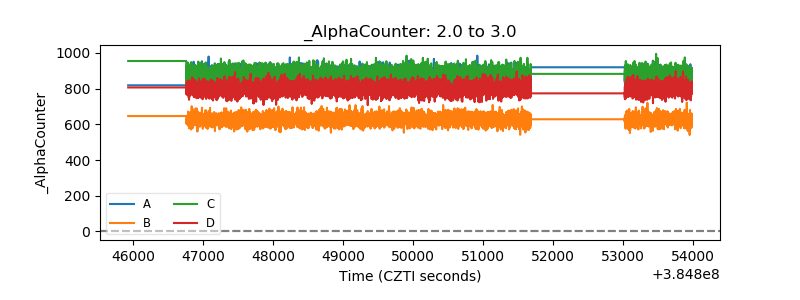 |
| _CPM_Rate | 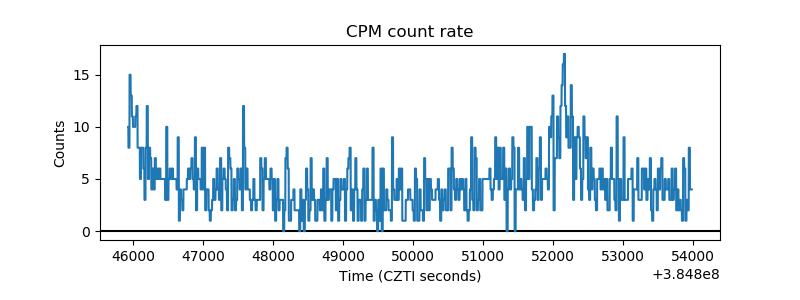 |
| CZT Counter | 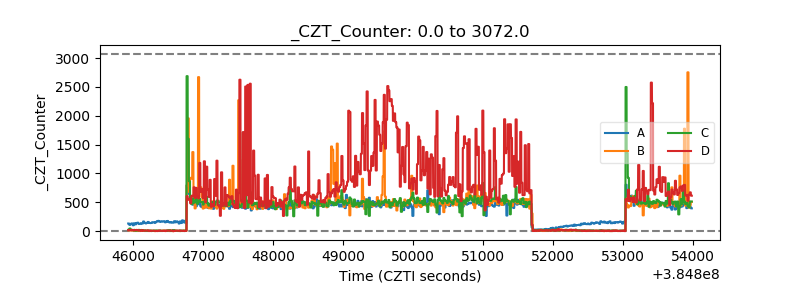 |
| +2.5 Volts monitor | 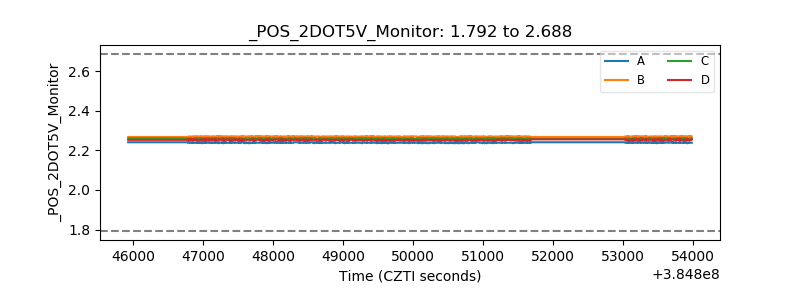 |
| +5 Volts monitor | 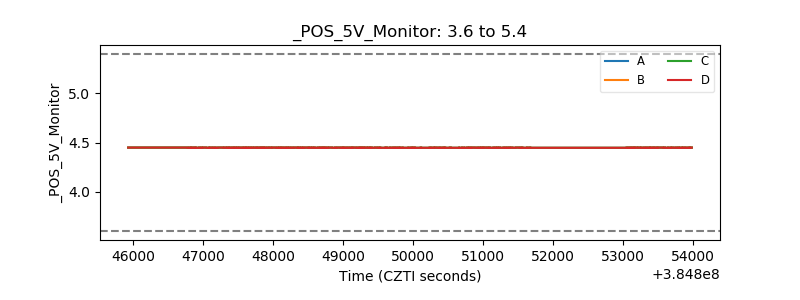 |
| _ROLL_ROT | 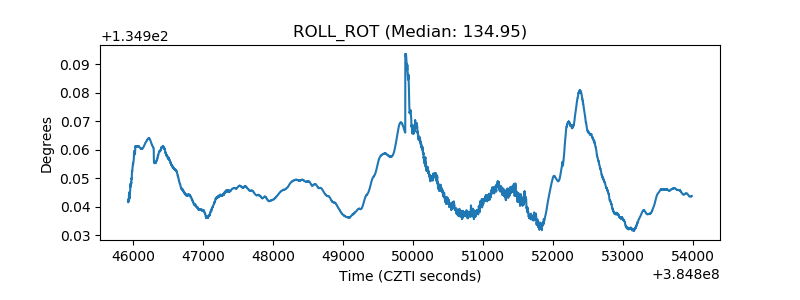 |
| _Roll_DEC | 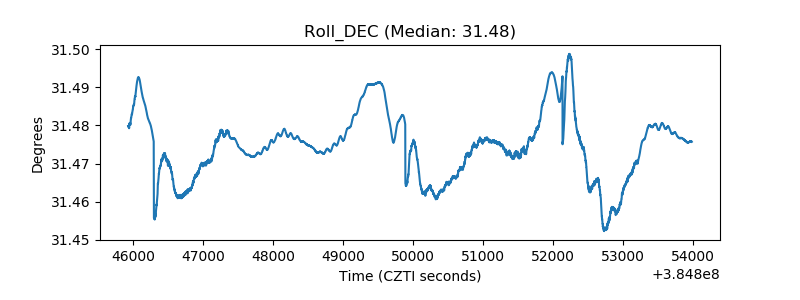 |
| _Roll_RA | 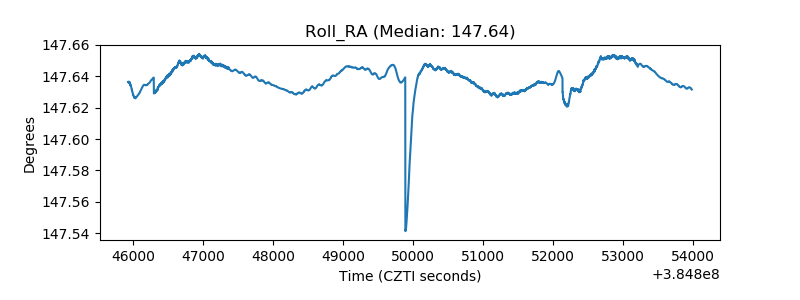 |
| Veto Counter | 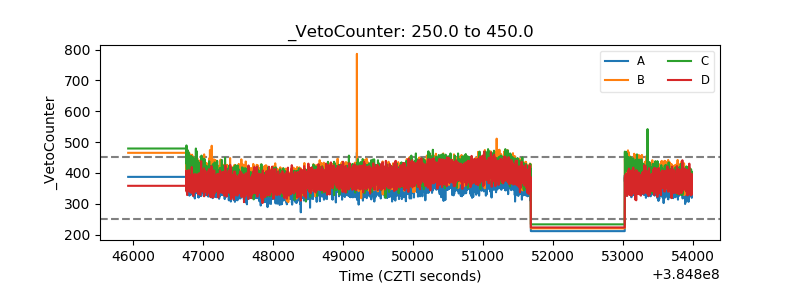 |