| Param | Original file | Final file |
|---|---|---|
| Filename | modeM0/AS1T04_077T01_9000004994_34894cztM0_level2.evt | modeM0/AS1T04_077T01_9000004994_34894cztM0_level2_quad_clean.evt |
| Size (bytes) | 1,330,297,920 | 224,553,600 |
| Size | 1.2 GB | 214.2 MB |
| Events in quadrant A | 7,190,392 | 1,481,543 |
| Events in quadrant B | 11,404,283 | 1,439,024 |
| Events in quadrant C | 8,020,715 | 1,460,814 |
| Events in quadrant D | 12,627,471 | 1,349,723 |
| Mode M9 | |||
|---|---|---|---|
| Quadrant | BADHDUFLAG | Total packets | Discarded packets |
| A | 0 | 55 | 0 |
| B | 0 | 55 | 0 |
| C | 0 | 55 | 0 |
| D | 0 | 55 | 0 |
| Mode M0 | |||
|---|---|---|---|
| Quadrant | BADHDUFLAG | Total packets | Discarded packets |
| A | 0 | 31462 | 5 |
| B | 0 | 43945 | 4 |
| C | 0 | 32561 | 4 |
| D | 0 | 48184 | 4 |
| Mode SS | |||
|---|---|---|---|
| Quadrant | BADHDUFLAG | Total packets | Discarded packets |
| A | 0 | 320 | 0 |
| B | 0 | 320 | 0 |
| C | 0 | 320 | 0 |
| D | 0 | 320 | 0 |
| Quadrant | Total seconds | Saturated seconds | Saturation percentage |
|---|---|---|---|
| A | 15499 | 16 | 0.103232% |
| B | 15499 | 1100 | 7.097232% |
| C | 15499 | 99 | 0.638751% |
| D | 15499 | 625 | 4.032518% |
Noise dominated data is calculated using 1-second bins in cleaned event files. If a bin has >2000 counts, and if more than 50% of those come from <1% of pixels, then it is considered to be noise-dominated and hence unusable.
| Quadrant | # 1 sec bins | Bins with >0 counts | Bins with >2000 counts | High rate bins dominated by noise | Noise dominated (total time) | Noise dominated (detector-on time) | Marked lightcurve |
|---|---|---|---|---|---|---|---|
| A | 21023 | 15503 | 0 | 0 | 0.00% | 0.00% | 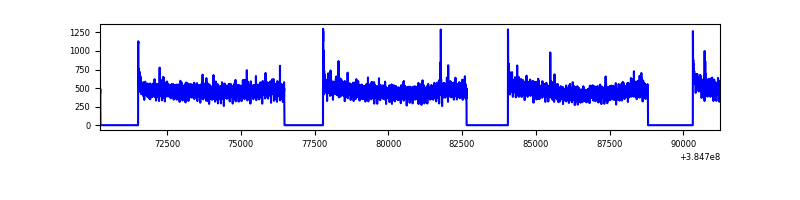 |
| B | 21023 | 15502 | 841 | 841 | 4.00% | 5.43% | 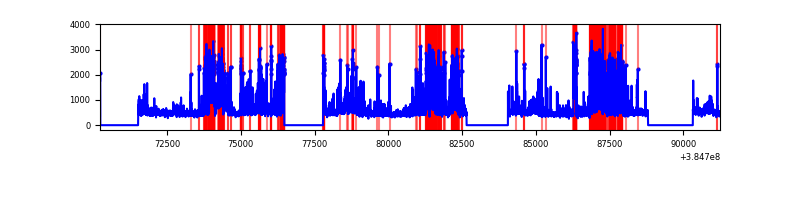 |
| C | 21023 | 15503 | 78 | 78 | 0.37% | 0.50% | 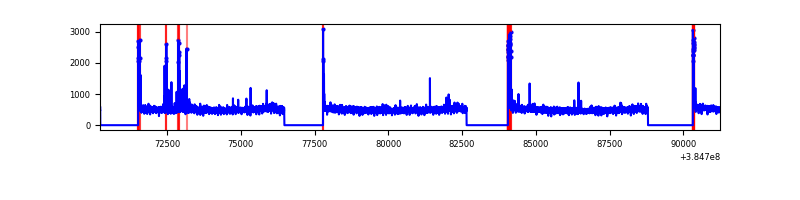 |
| D | 21023 | 15503 | 580 | 580 | 2.76% | 3.74% | 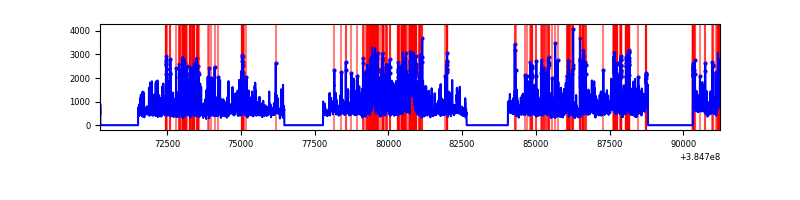 |
Top three noisy pixels from each quadrant. If the there are fewer than three noisy pixels in the level2.evt file, extra rows are filled as -1
| Pixel properties | Quadrant properties | ||||||
|---|---|---|---|---|---|---|---|
| Quadrant | DetID | PixID | Counts | Sigma | Mean | Median | Sigma |
| A | 10 | 83 | 131077 | 354.55 | 1818 | 1778 | 364.7 |
| A | 13 | 6 | 27137 | 69.54 | 1818 | 1778 | 364.7 |
| A | 13 | 254 | 24651 | 62.72 | 1818 | 1778 | 364.7 |
| B | 4 | 171 | 2260824 | 6668.0 | 1764 | 1713 | 338.8 |
| B | 5 | 172 | 1274814 | 3757.69 | 1764 | 1713 | 338.8 |
| B | 0 | 190 | 497604 | 1463.67 | 1764 | 1713 | 338.8 |
| C | 15 | 214 | 696684 | 1699.21 | 1766 | 1776 | 409.0 |
| C | 0 | 10 | 262524 | 637.59 | 1766 | 1776 | 409.0 |
| C | 0 | 207 | 108360 | 260.62 | 1766 | 1776 | 409.0 |
| D | 8 | 195 | 2812465 | 6581.51 | 1743 | 1697 | 427.1 |
| D | 1 | 52 | 848596 | 1983.04 | 1743 | 1697 | 427.1 |
| D | 7 | 223 | 520332 | 1214.4 | 1743 | 1697 | 427.1 |
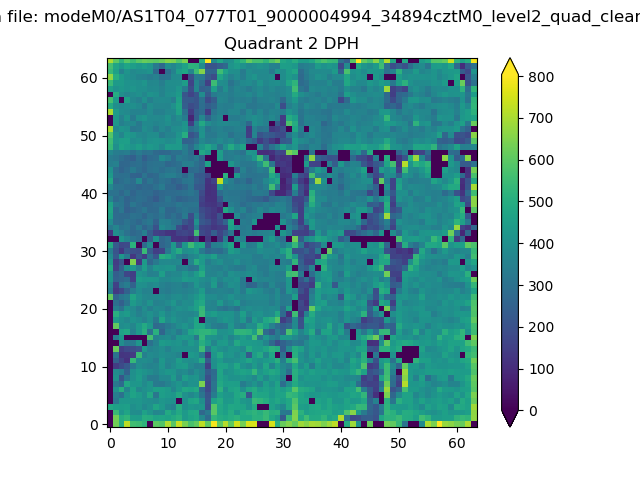
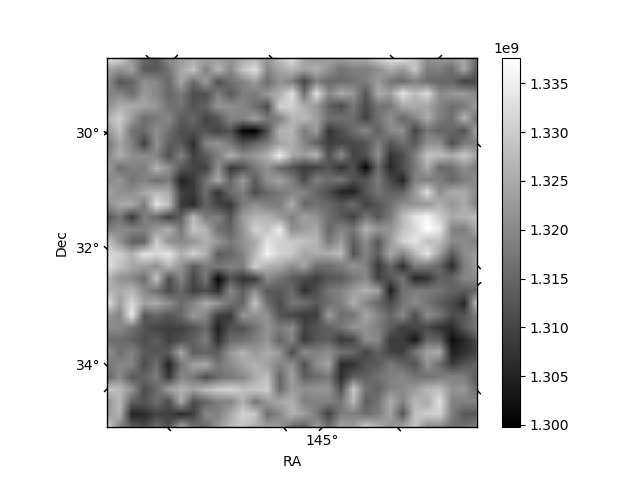
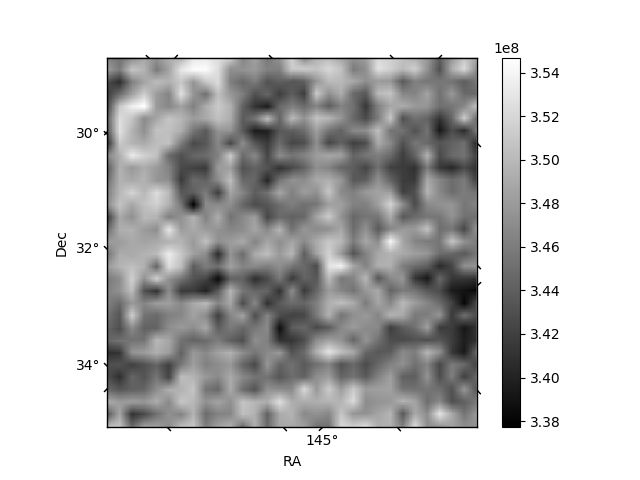
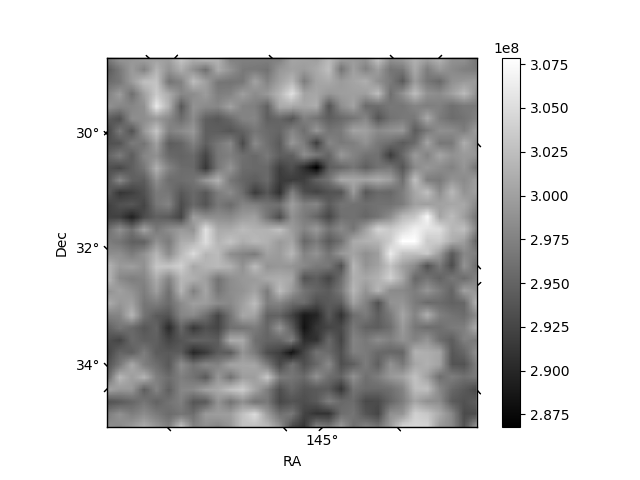
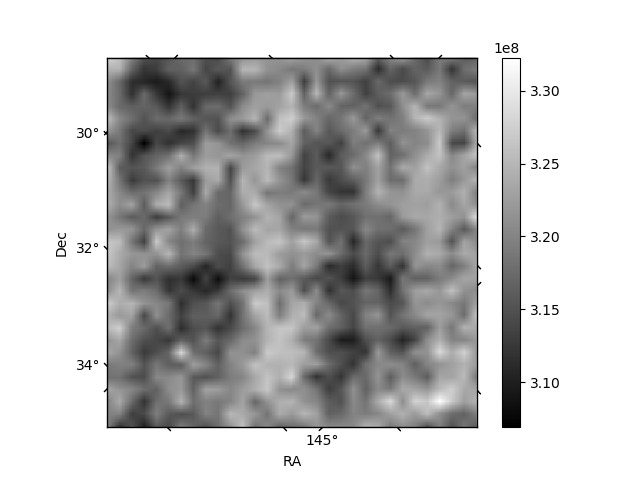
Histogram calculated using DETX and DETY for each event in the final _common_clean file
| Quadrant A | 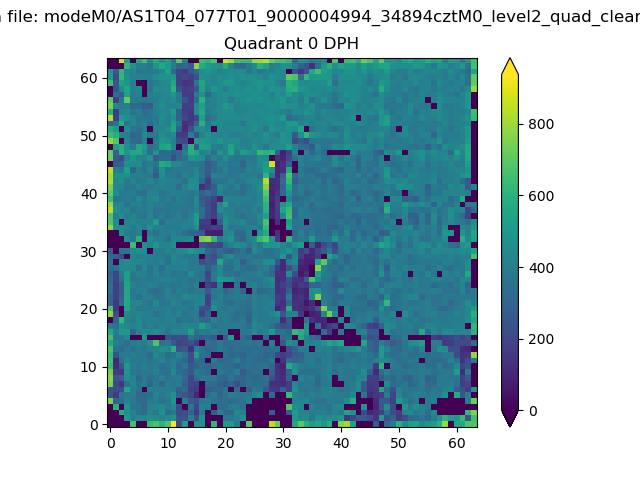 |
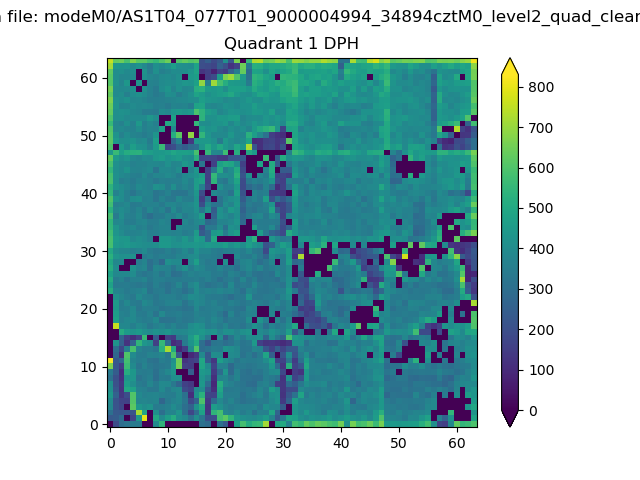 |
Quadrant B |
|---|---|---|---|
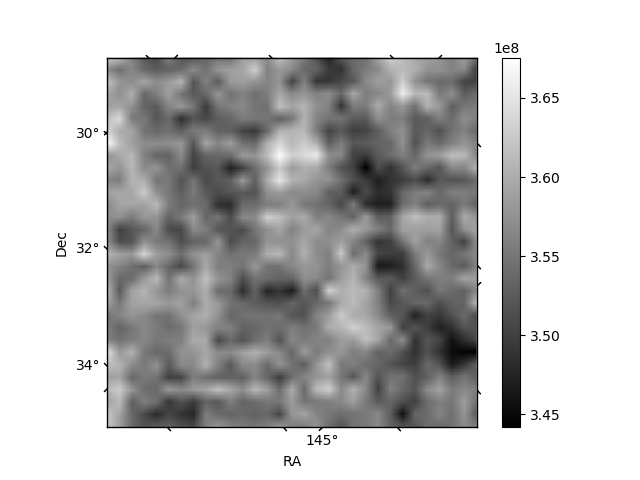
| Quadrant D | 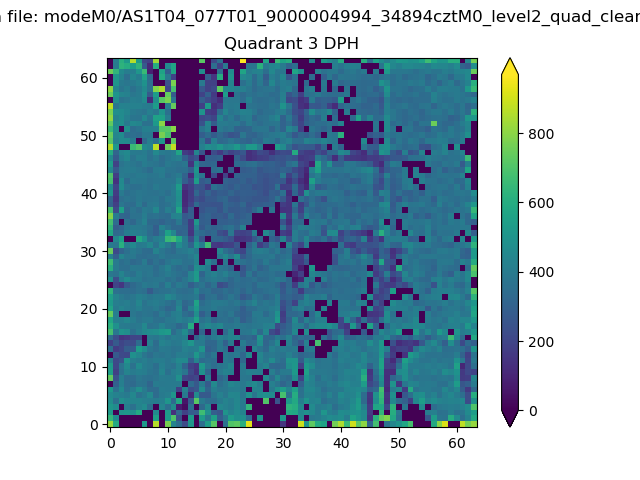 |
 |
Quadrant C |
| Plot type | Count rate plots | Images |
|---|---|---|
| Comparison with Poisson distribution Blue bars denote a histogram of data divided into 1 sec bins. Red curve is a Poisson curve with rate = median count rate of data. |
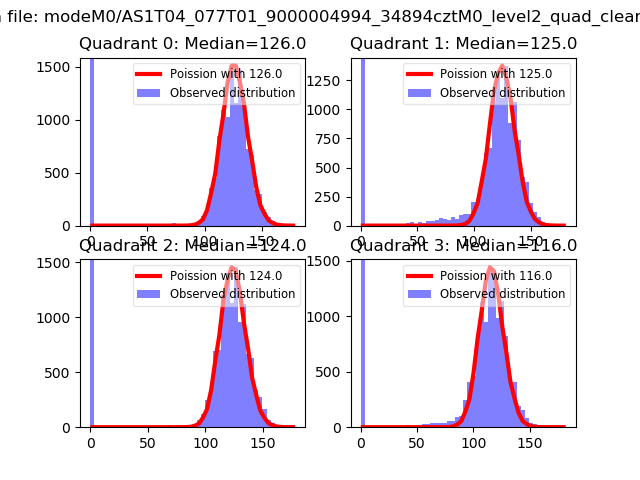 |
 |
| Quadrant-wise count rates Data is divided into 100 sec bins |
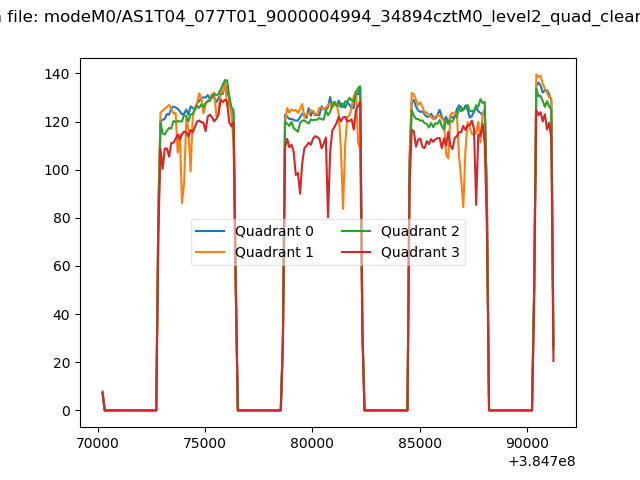 |
|
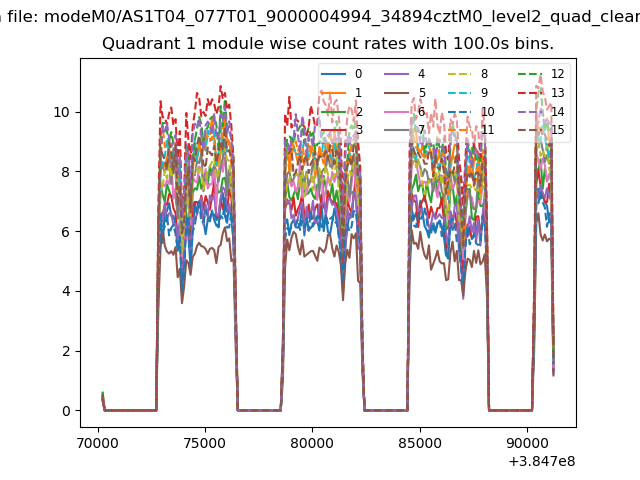
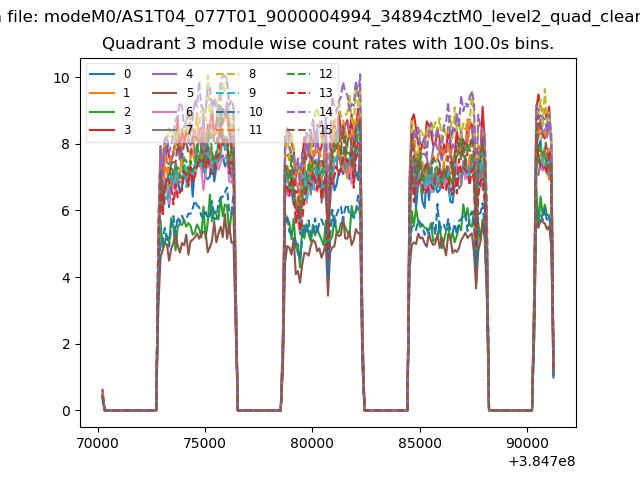
| Module-wise count rates for Quadrant A Data is divided into 100 sec bins |
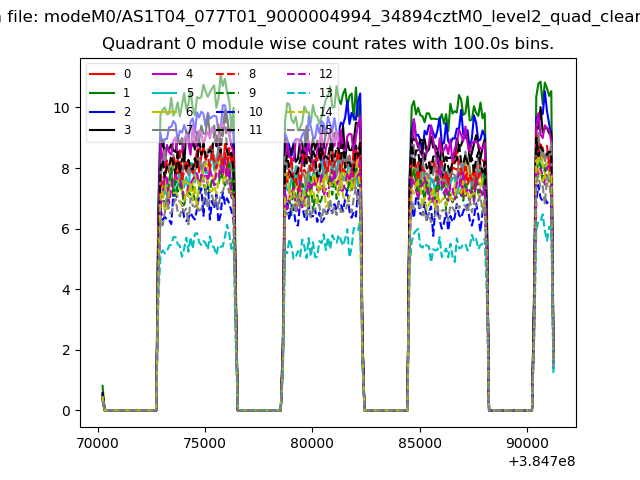 |
 |
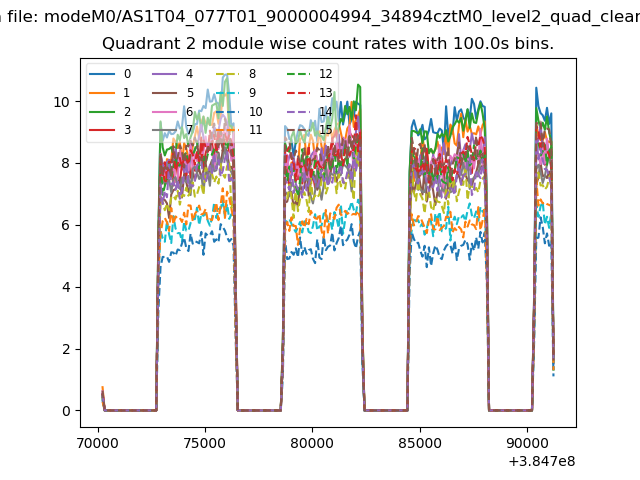
| Module-wise count rates for Quadrant B Data is divided into 100 sec bins |
 |
 |
| Module-wise count rates for Quadrant C Data is divided into 100 sec bins |
 |
 |
| Module-wise count rates for Quadrant D Data is divided into 100 sec bins |
 |
 |
| Parameter | Plot |
|---|---|
| CZT HV Monitor |  |
| D_VDD | 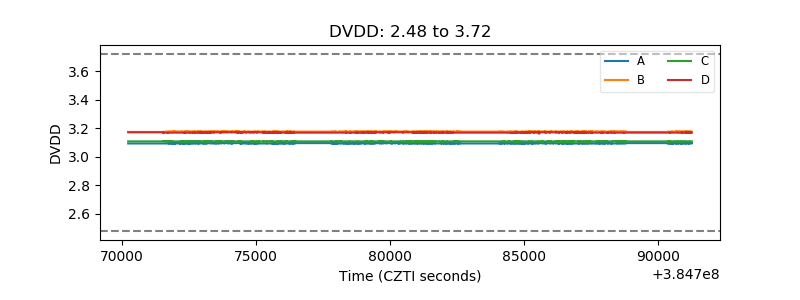 |
| Temperature 1 | 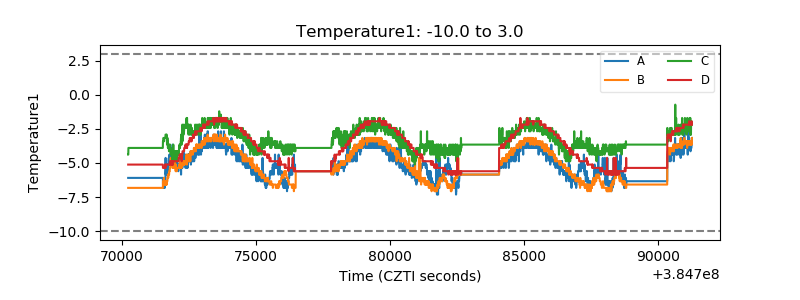 |
| Veto HV Monitor | 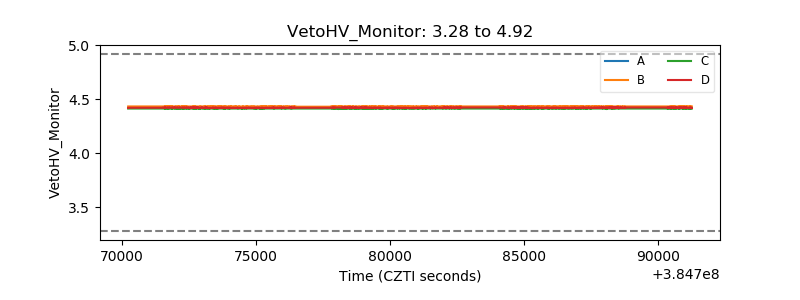 |
| Veto LLD | 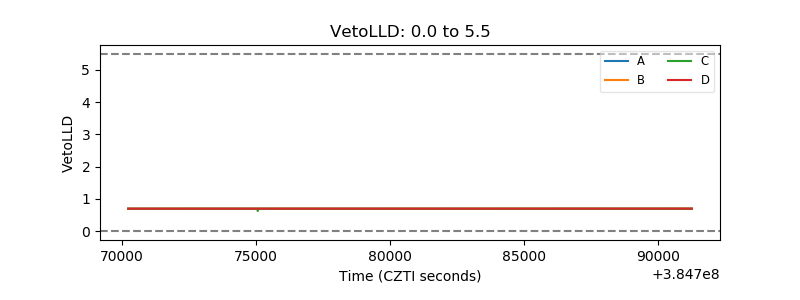 |
| Alpha Counter | 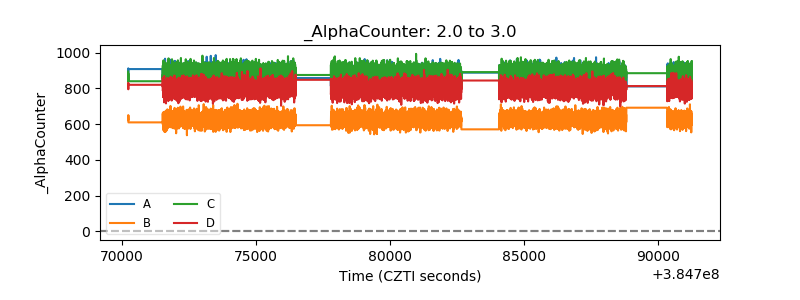 |
| _CPM_Rate | 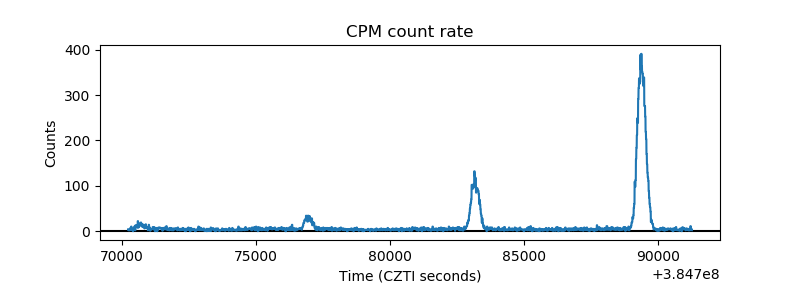 |
| CZT Counter | 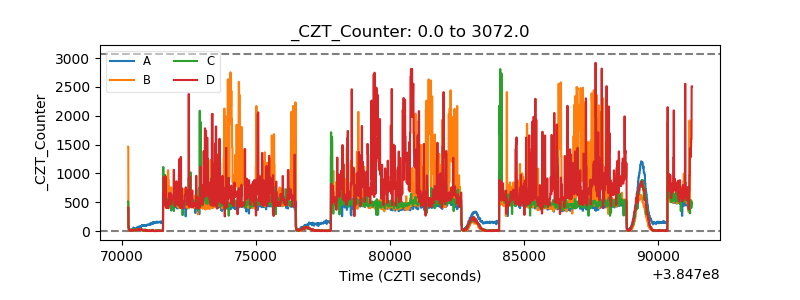 |
| +2.5 Volts monitor | 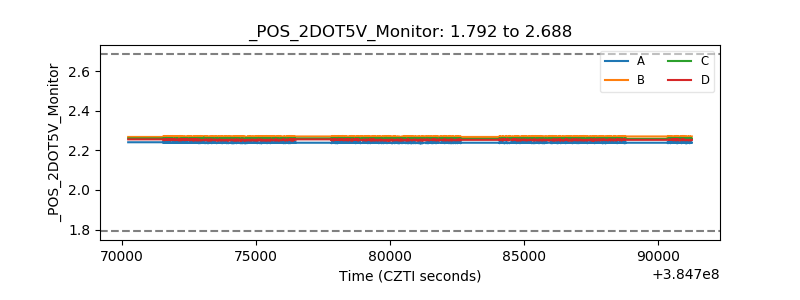 |
| +5 Volts monitor | 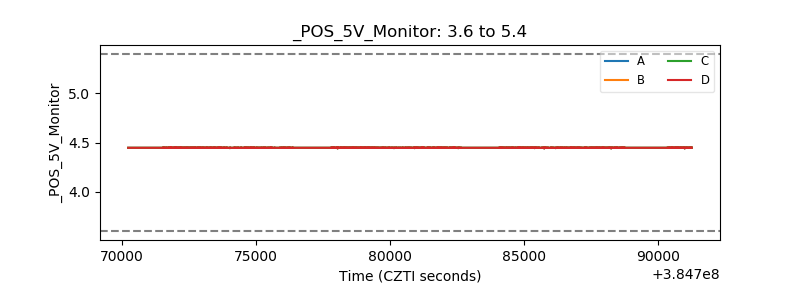 |
| _ROLL_ROT | 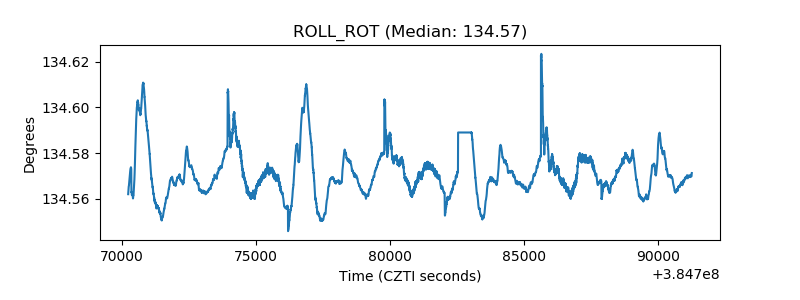 |
| _Roll_DEC | 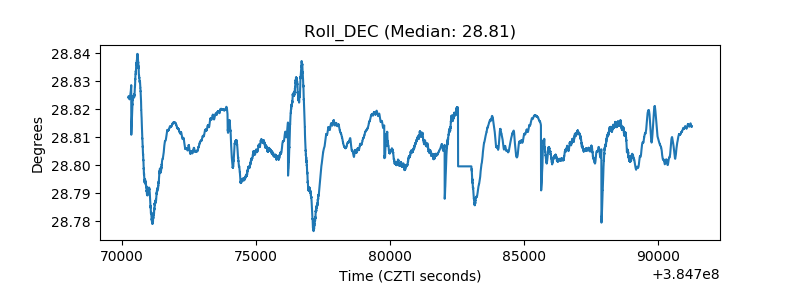 |
| _Roll_RA | 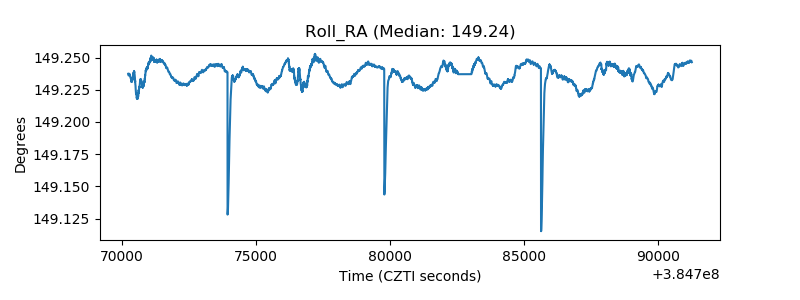 |
| Veto Counter | 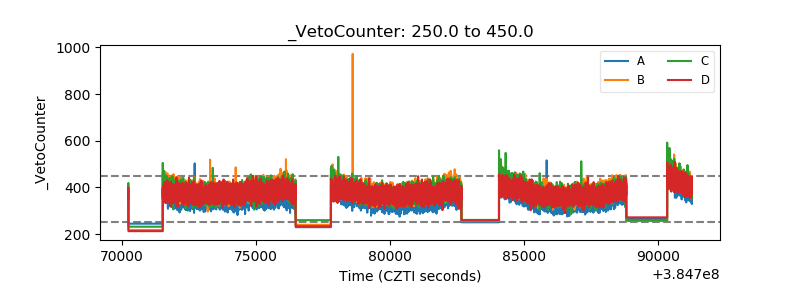 |