| Param | Original file | Final file |
|---|---|---|
| Filename | modeM0/AS1T04_077T01_9000004994_34891cztM0_level2.evt | modeM0/AS1T04_077T01_9000004994_34891cztM0_level2_quad_clean.evt |
| Size (bytes) | 517,602,240 | 81,089,280 |
| Size | 493.6 MB | 77.3 MB |
| Events in quadrant A | 3,102,706 | 509,003 |
| Events in quadrant B | 3,878,598 | 510,182 |
| Events in quadrant C | 3,423,855 | 501,432 |
| Events in quadrant D | 4,819,932 | 471,502 |
| Mode M9 | |||
|---|---|---|---|
| Quadrant | BADHDUFLAG | Total packets | Discarded packets |
| A | 0 | 26 | 0 |
| B | 0 | 26 | 0 |
| C | 0 | 26 | 0 |
| D | 0 | 26 | 0 |
| Mode M0 | |||
|---|---|---|---|
| Quadrant | BADHDUFLAG | Total packets | Discarded packets |
| A | 0 | 13421 | 3 |
| B | 0 | 15716 | 2 |
| C | 0 | 13764 | 2 |
| D | 0 | 18973 | 2 |
| Mode SS | |||
|---|---|---|---|
| Quadrant | BADHDUFLAG | Total packets | Discarded packets |
| A | 0 | 138 | 0 |
| B | 0 | 138 | 0 |
| C | 0 | 138 | 0 |
| D | 0 | 138 | 0 |
| Quadrant | Total seconds | Saturated seconds | Saturation percentage |
|---|---|---|---|
| A | 6643 | 8 | 0.120428% |
| B | 6643 | 101 | 1.520397% |
| C | 6643 | 15 | 0.225802% |
| D | 6643 | 68 | 1.023634% |
Noise dominated data is calculated using 1-second bins in cleaned event files. If a bin has >2000 counts, and if more than 50% of those come from <1% of pixels, then it is considered to be noise-dominated and hence unusable.
| Quadrant | # 1 sec bins | Bins with >0 counts | Bins with >2000 counts | High rate bins dominated by noise | Noise dominated (total time) | Noise dominated (detector-on time) | Marked lightcurve |
|---|---|---|---|---|---|---|---|
| A | 9299 | 6645 | 0 | 0 | 0.00% | 0.00% | 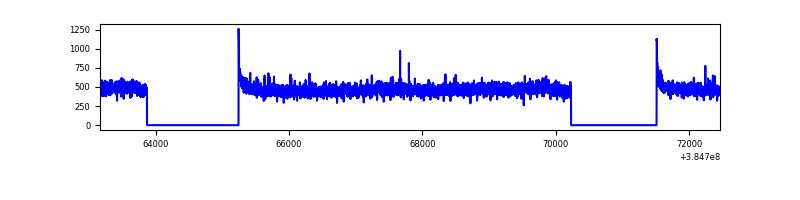 |
| B | 9299 | 6645 | 52 | 52 | 0.56% | 0.78% | 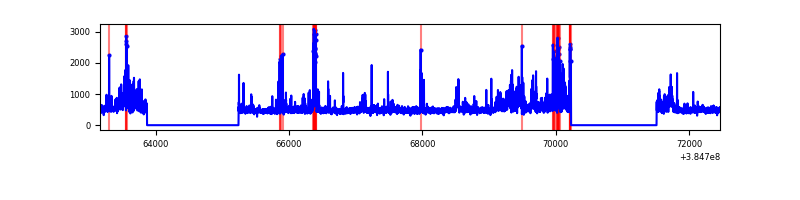 |
| C | 9299 | 6645 | 9 | 9 | 0.10% | 0.14% | 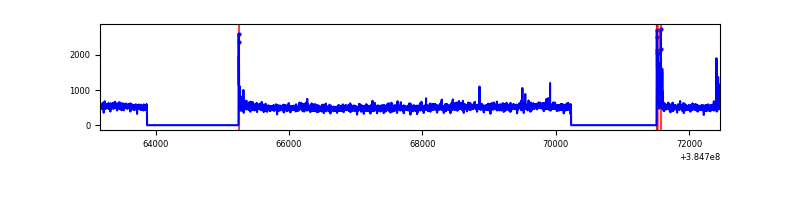 |
| D | 9299 | 6645 | 57 | 57 | 0.61% | 0.86% | 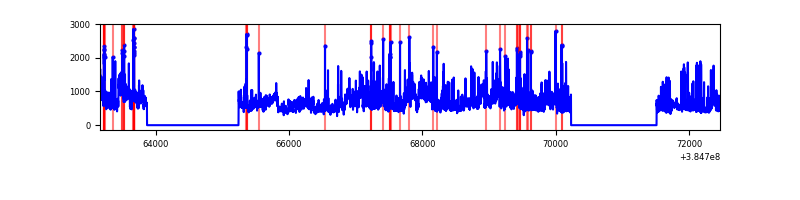 |
Top three noisy pixels from each quadrant. If the there are fewer than three noisy pixels in the level2.evt file, extra rows are filled as -1
| Pixel properties | Quadrant properties | ||||||
|---|---|---|---|---|---|---|---|
| Quadrant | DetID | PixID | Counts | Sigma | Mean | Median | Sigma |
| A | 10 | 83 | 63098 | 398.0 | 783 | 767 | 156.6 |
| A | 13 | 6 | 12321 | 73.77 | 783 | 767 | 156.6 |
| A | 13 | 254 | 10741 | 63.69 | 783 | 767 | 156.6 |
| B | 0 | 190 | 328733 | 2180.57 | 778 | 758 | 150.4 |
| B | 4 | 171 | 290074 | 1923.55 | 778 | 758 | 150.4 |
| B | 5 | 172 | 108432 | 715.88 | 778 | 758 | 150.4 |
| C | 15 | 214 | 299814 | 1679.53 | 763 | 768 | 178.1 |
| C | 0 | 10 | 64772 | 359.47 | 763 | 768 | 178.1 |
| C | 14 | 67 | 54369 | 301.04 | 763 | 768 | 178.1 |
| D | 8 | 195 | 1278495 | 6888.54 | 757 | 737 | 185.5 |
| D | 12 | 227 | 147230 | 789.76 | 757 | 737 | 185.5 |
| D | 13 | 249 | 102695 | 549.67 | 757 | 737 | 185.5 |
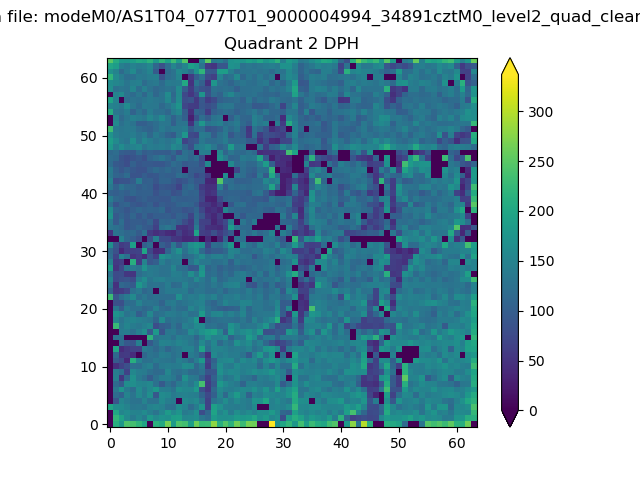
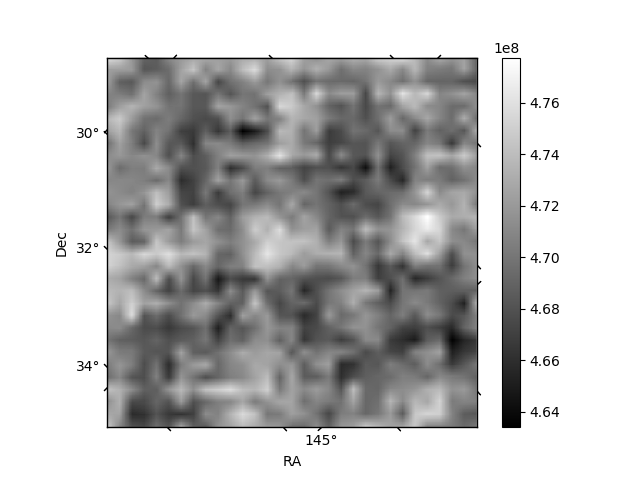
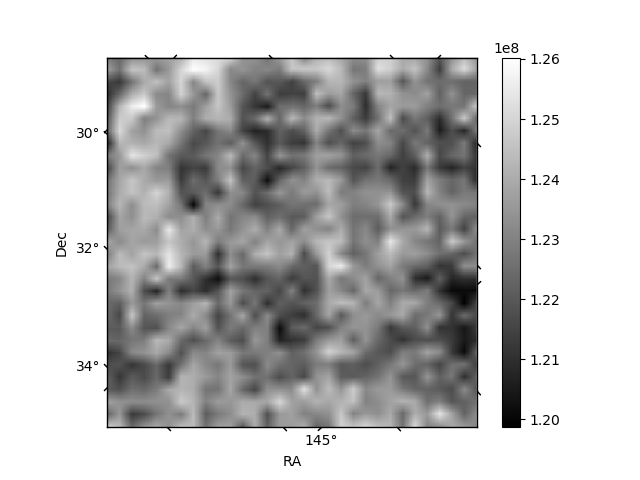
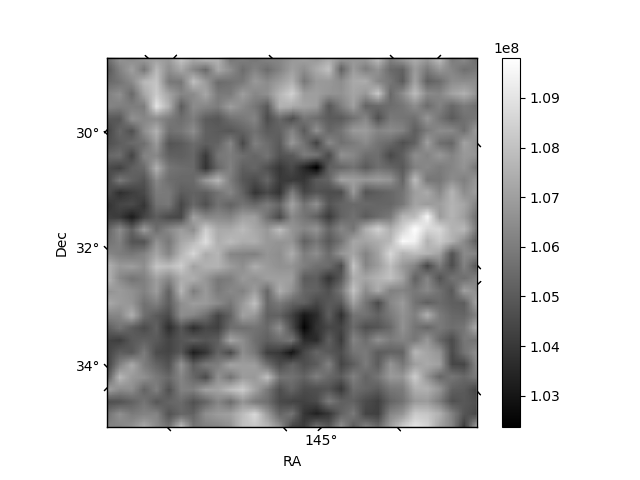
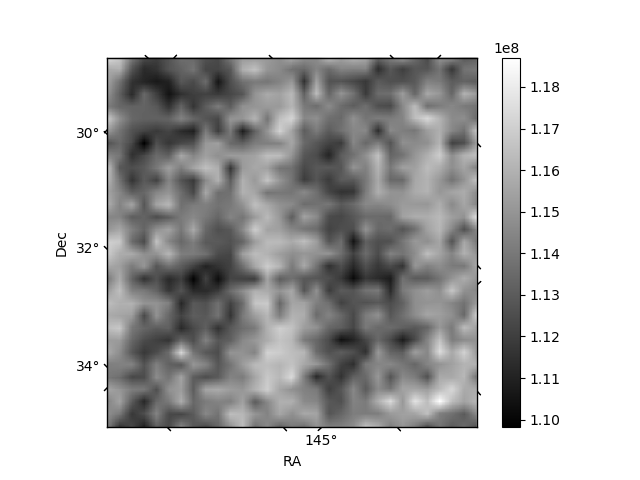
Histogram calculated using DETX and DETY for each event in the final _common_clean file
| Quadrant A | 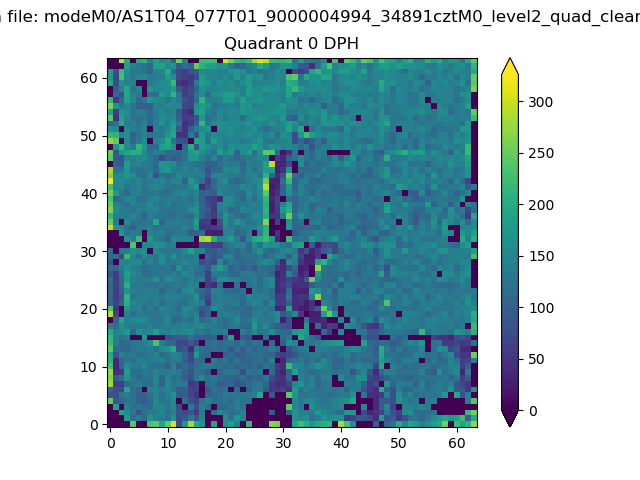 |
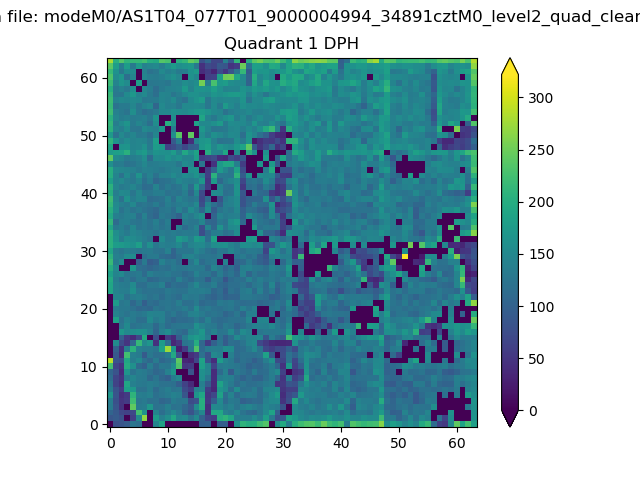 |
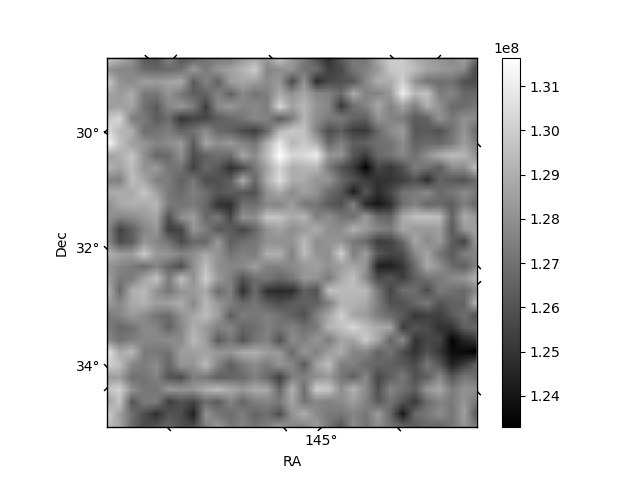
Quadrant B |
|---|---|---|---|
| Quadrant D | 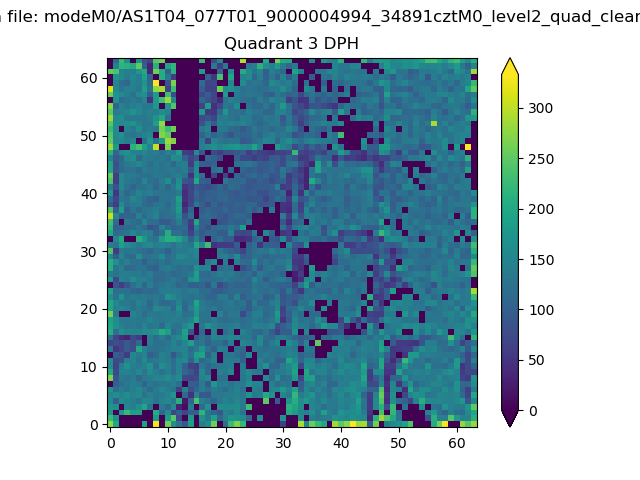 |
 |
Quadrant C |
| Plot type | Count rate plots | Images |
|---|---|---|
| Comparison with Poisson distribution Blue bars denote a histogram of data divided into 1 sec bins. Red curve is a Poisson curve with rate = median count rate of data. |
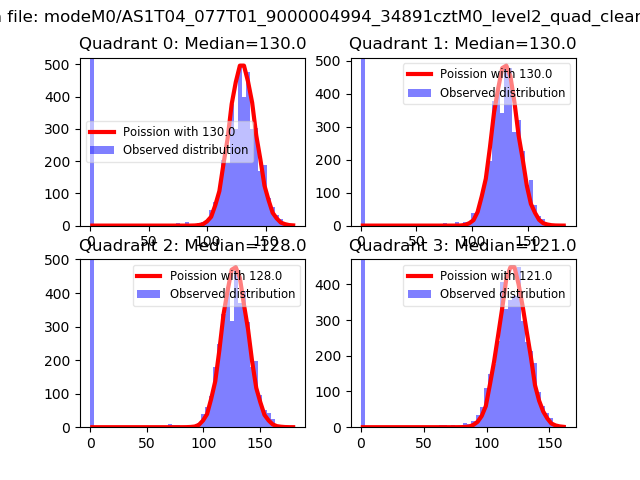 |
 |
| Quadrant-wise count rates Data is divided into 100 sec bins |
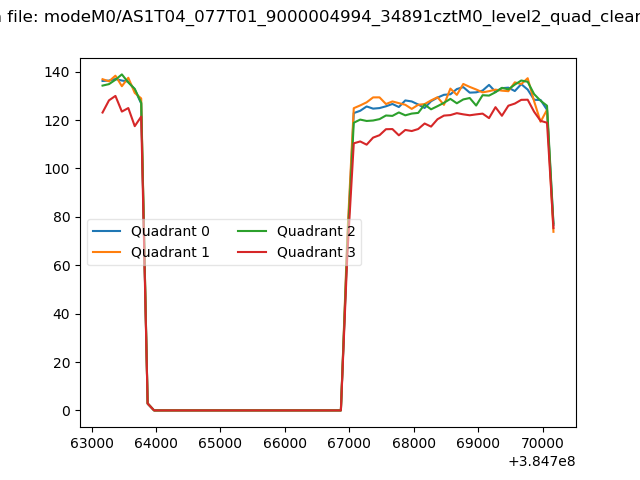 |
|
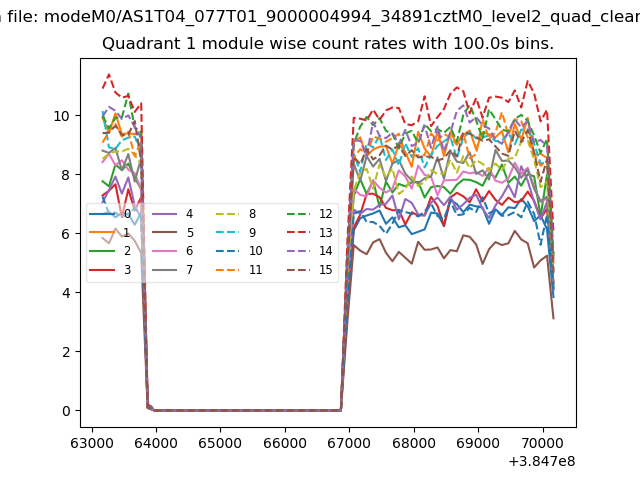
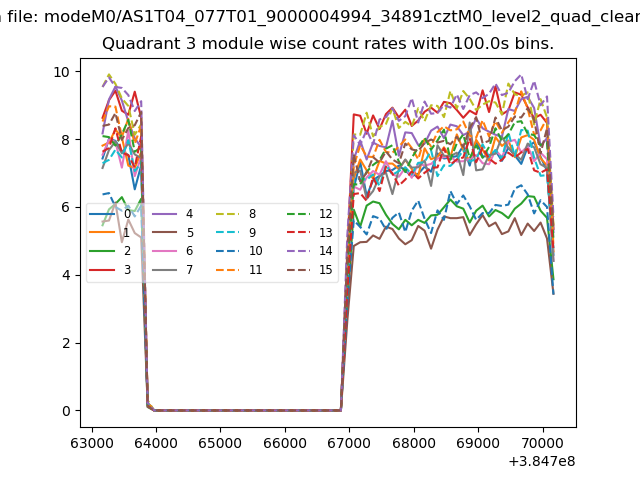
| Module-wise count rates for Quadrant A Data is divided into 100 sec bins |
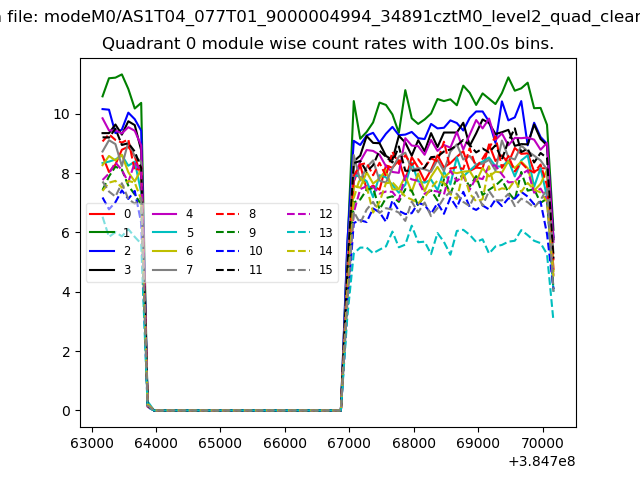 |
 |
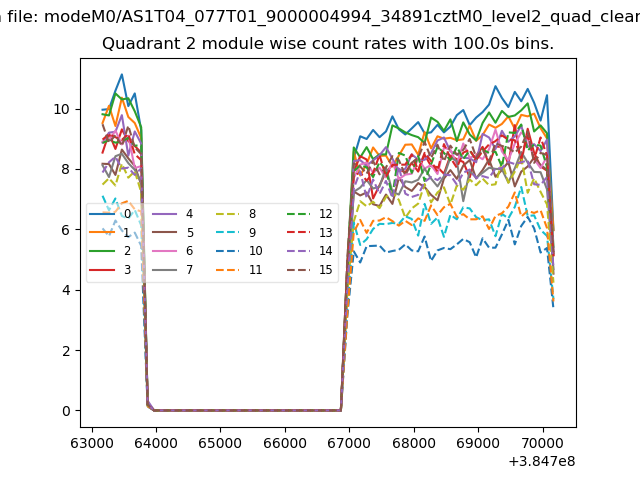
| Module-wise count rates for Quadrant B Data is divided into 100 sec bins |
 |
 |
| Module-wise count rates for Quadrant C Data is divided into 100 sec bins |
 |
 |
| Module-wise count rates for Quadrant D Data is divided into 100 sec bins |
 |
 |
| Parameter | Plot |
|---|---|
| CZT HV Monitor | 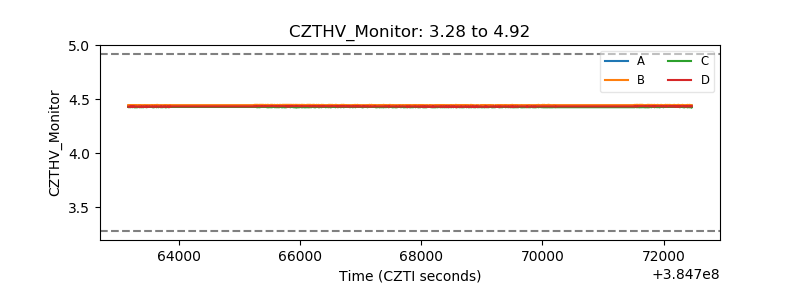 |
| D_VDD | 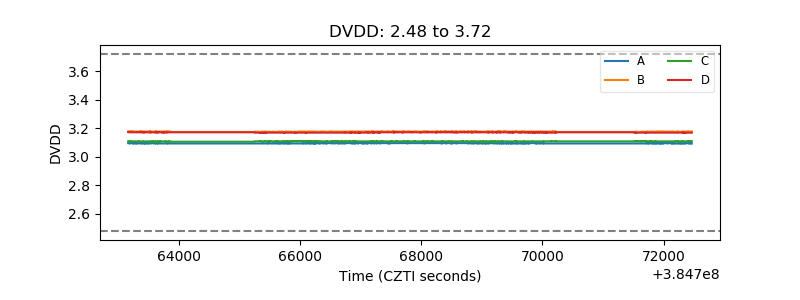 |
| Temperature 1 | 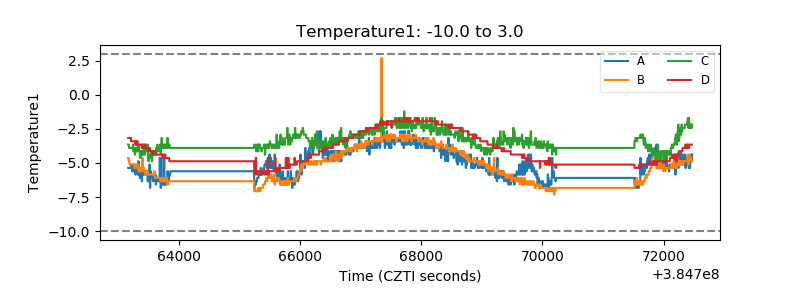 |
| Veto HV Monitor | 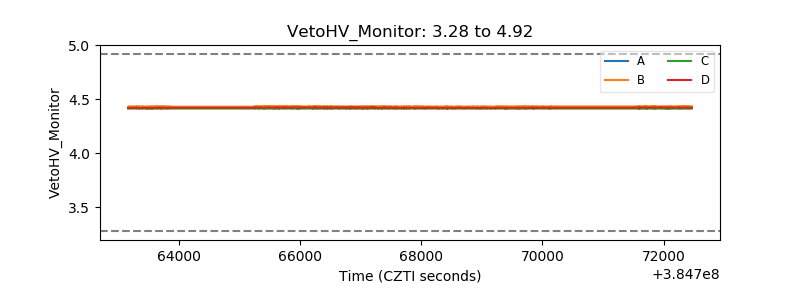 |
| Veto LLD | 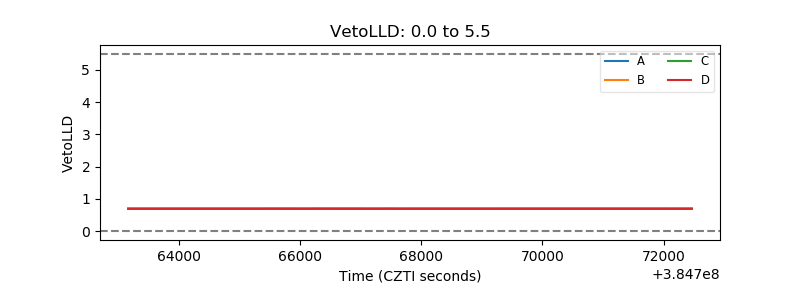 |
| Alpha Counter | 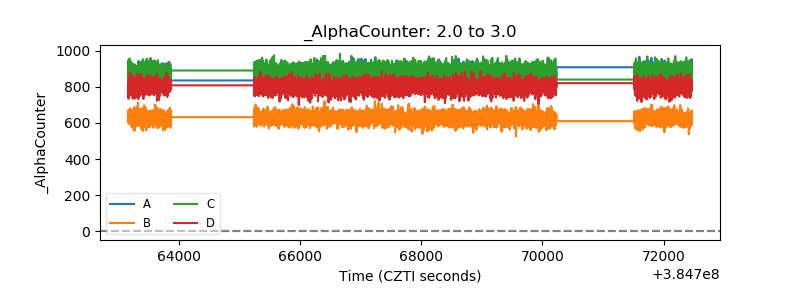 |
| _CPM_Rate | 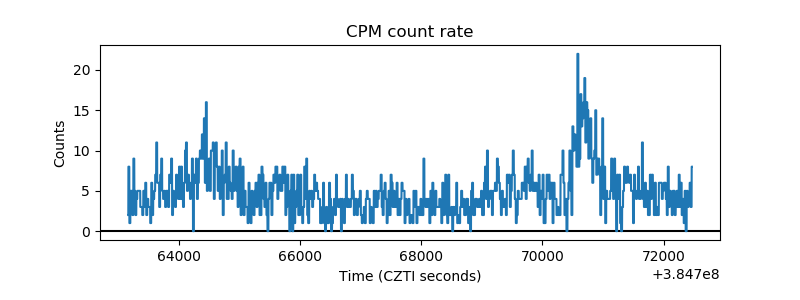 |
| CZT Counter | 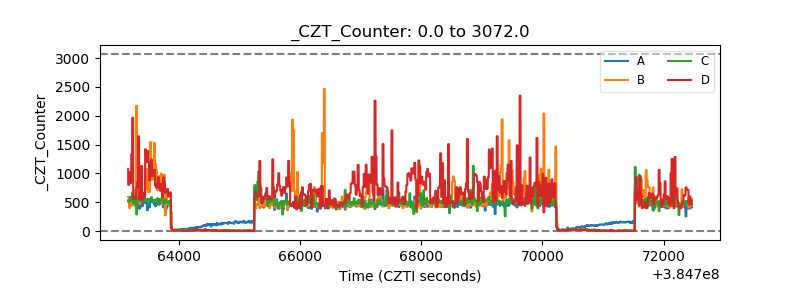 |
| +2.5 Volts monitor | 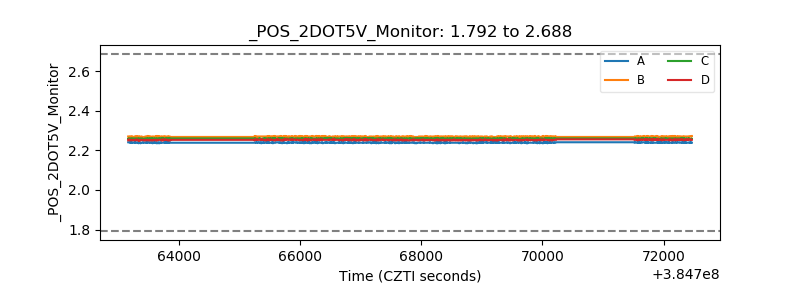 |
| +5 Volts monitor | 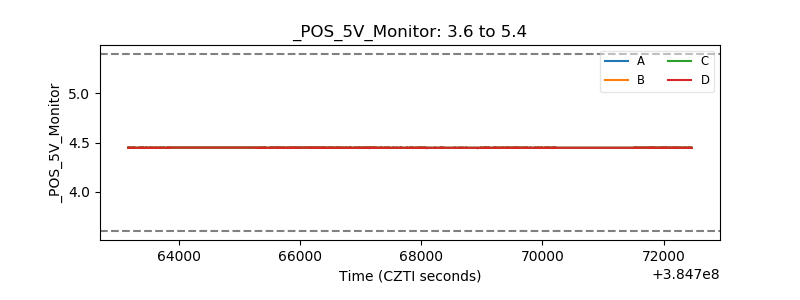 |
| _ROLL_ROT | 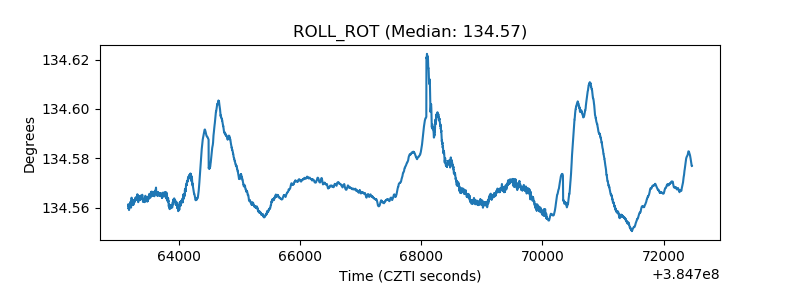 |
| _Roll_DEC | 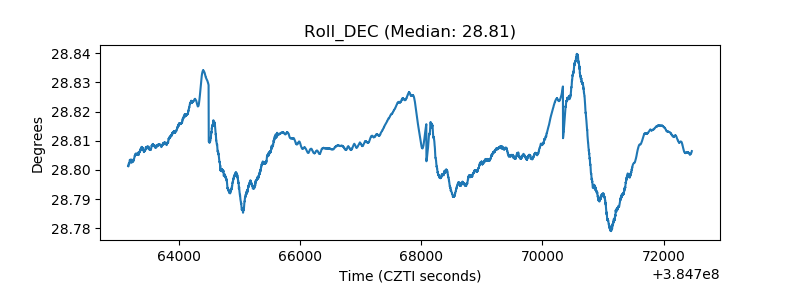 |
| _Roll_RA | 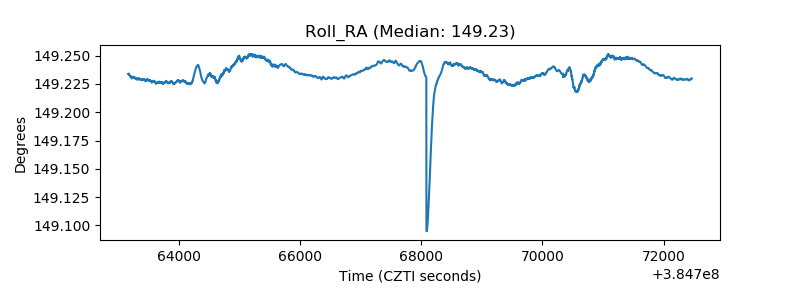 |
| Veto Counter | 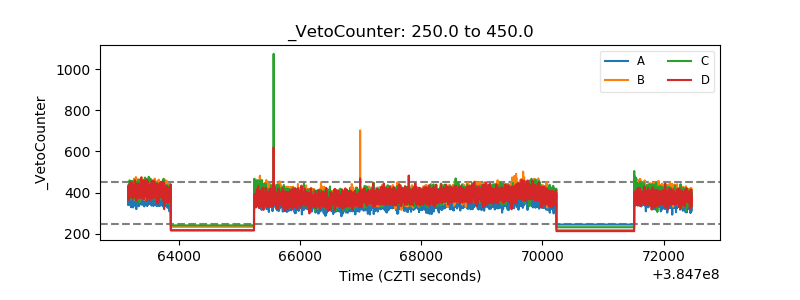 |