| Param | Original file | Final file |
|---|---|---|
| Filename | modeM0/AS1T04_077T01_9000004994_34889cztM0_level2.evt | modeM0/AS1T04_077T01_9000004994_34889cztM0_level2_quad_clean.evt |
| Size (bytes) | 420,154,560 | 54,645,120 |
| Size | 400.7 MB | 52.1 MB |
| Events in quadrant A | 2,545,729 | 324,463 |
| Events in quadrant B | 2,828,712 | 329,489 |
| Events in quadrant C | 2,891,472 | 316,778 |
| Events in quadrant D | 4,088,170 | 302,011 |
| Mode M9 | |||
|---|---|---|---|
| Quadrant | BADHDUFLAG | Total packets | Discarded packets |
| A | 0 | 24 | 0 |
| B | 0 | 24 | 0 |
| C | 0 | 24 | 0 |
| D | 0 | 25 | 0 |
| Mode M0 | |||
|---|---|---|---|
| Quadrant | BADHDUFLAG | Total packets | Discarded packets |
| A | 0 | 11036 | 3 |
| B | 0 | 11804 | 2 |
| C | 0 | 11683 | 2 |
| D | 0 | 15937 | 2 |
| Mode SS | |||
|---|---|---|---|
| Quadrant | BADHDUFLAG | Total packets | Discarded packets |
| A | 0 | 112 | 0 |
| B | 0 | 112 | 0 |
| C | 0 | 112 | 0 |
| D | 0 | 112 | 0 |
| Quadrant | Total seconds | Saturated seconds | Saturation percentage |
|---|---|---|---|
| A | 5447 | 5 | 0.091794% |
| B | 5447 | 25 | 0.458968% |
| C | 5447 | 55 | 1.009730% |
| D | 5447 | 62 | 1.138241% |
Noise dominated data is calculated using 1-second bins in cleaned event files. If a bin has >2000 counts, and if more than 50% of those come from <1% of pixels, then it is considered to be noise-dominated and hence unusable.
| Quadrant | # 1 sec bins | Bins with >0 counts | Bins with >2000 counts | High rate bins dominated by noise | Noise dominated (total time) | Noise dominated (detector-on time) | Marked lightcurve |
|---|---|---|---|---|---|---|---|
| A | 7090 | 5448 | 0 | 0 | 0.00% | 0.00% | 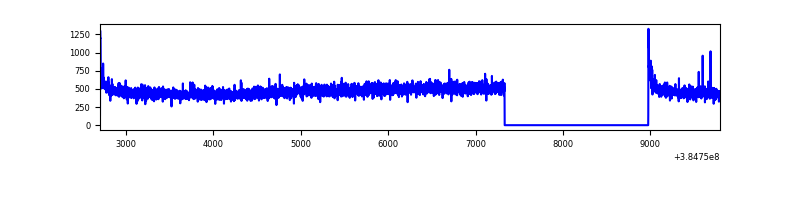 |
| B | 7090 | 5448 | 10 | 10 | 0.14% | 0.18% | 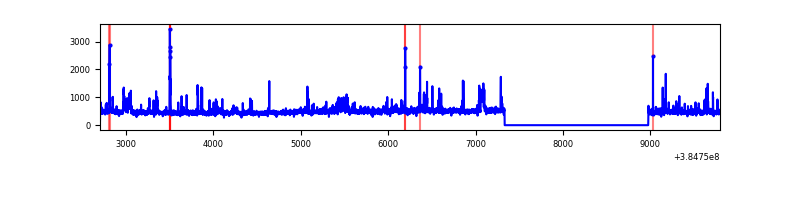 |
| C | 7090 | 5448 | 50 | 50 | 0.71% | 0.92% | 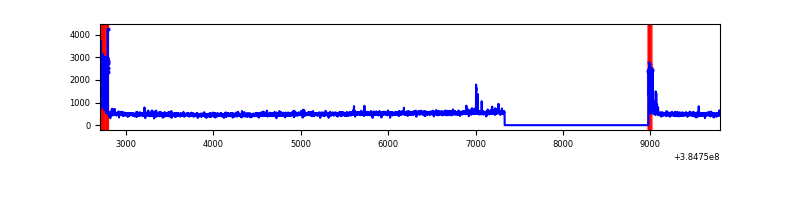 |
| D | 7090 | 5448 | 55 | 55 | 0.78% | 1.01% | 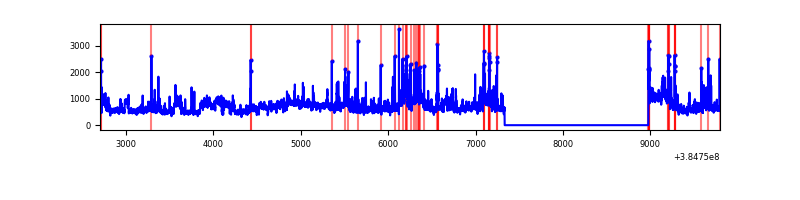 |
Top three noisy pixels from each quadrant. If the there are fewer than three noisy pixels in the level2.evt file, extra rows are filled as -1
| Pixel properties | Quadrant properties | ||||||
|---|---|---|---|---|---|---|---|
| Quadrant | DetID | PixID | Counts | Sigma | Mean | Median | Sigma |
| A | 10 | 83 | 59434 | 453.37 | 640 | 628 | 129.7 |
| A | 13 | 6 | 10625 | 77.07 | 640 | 628 | 129.7 |
| A | 13 | 254 | 7936 | 56.34 | 640 | 628 | 129.7 |
| B | 5 | 172 | 140875 | 1144.16 | 635 | 619 | 122.6 |
| B | 0 | 190 | 103281 | 837.48 | 635 | 619 | 122.6 |
| B | 5 | 255 | 22032 | 174.68 | 635 | 619 | 122.6 |
| C | 15 | 214 | 247668 | 1710.25 | 618 | 624 | 144.4 |
| C | 0 | 10 | 186928 | 1289.76 | 618 | 624 | 144.4 |
| C | 14 | 67 | 23291 | 156.92 | 618 | 624 | 144.4 |
| D | 8 | 195 | 919777 | 6118.18 | 615 | 599 | 150.2 |
| D | 2 | 31 | 279267 | 1854.85 | 615 | 599 | 150.2 |
| D | 1 | 47 | 94469 | 624.81 | 615 | 599 | 150.2 |
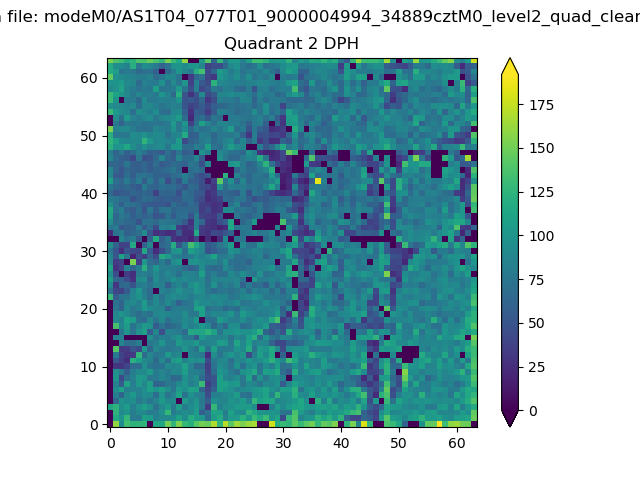
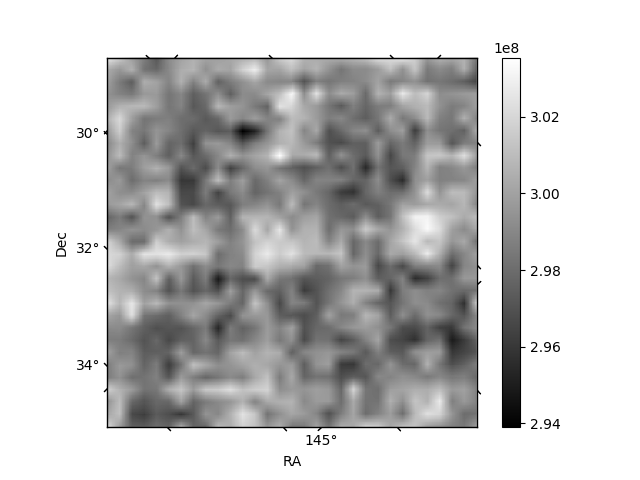
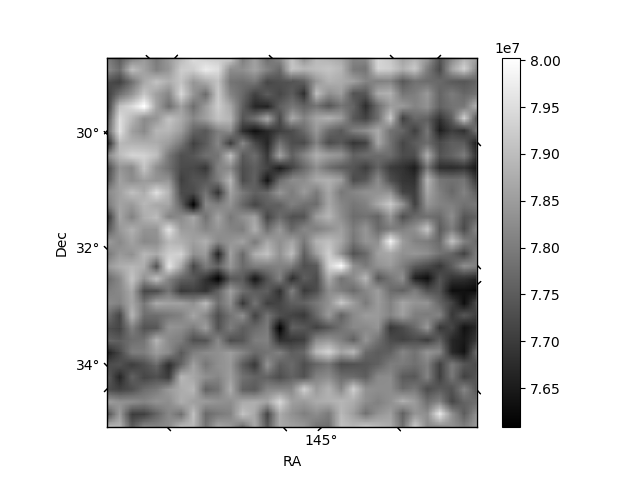
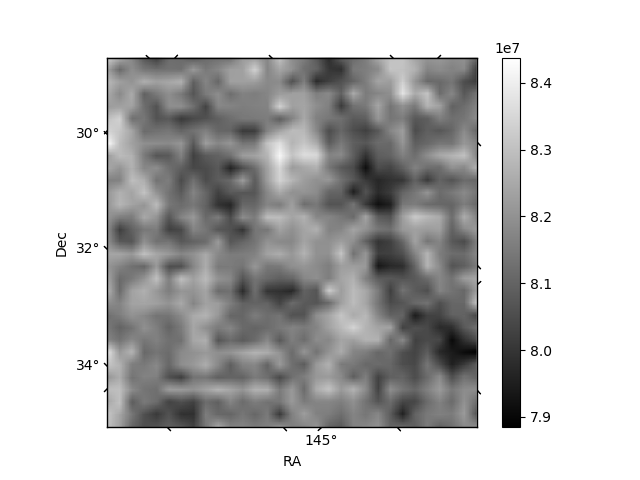
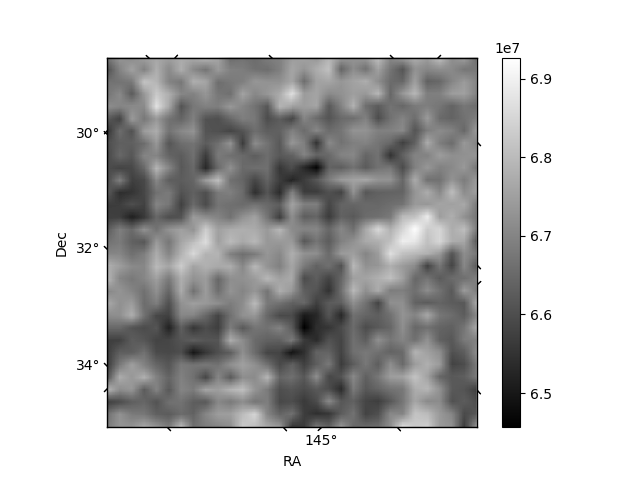
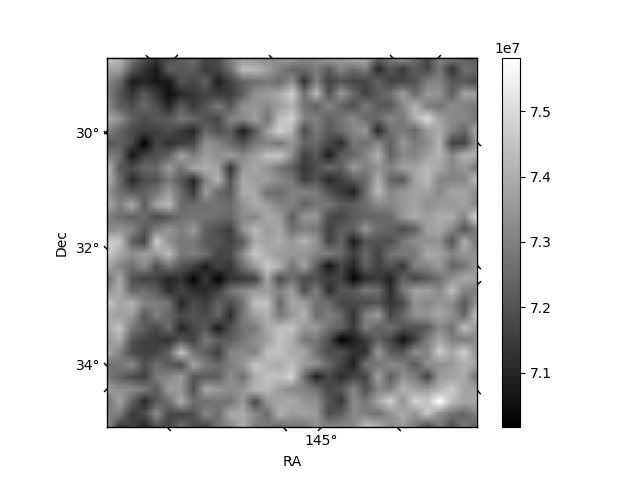
Histogram calculated using DETX and DETY for each event in the final _common_clean file
| Quadrant A | 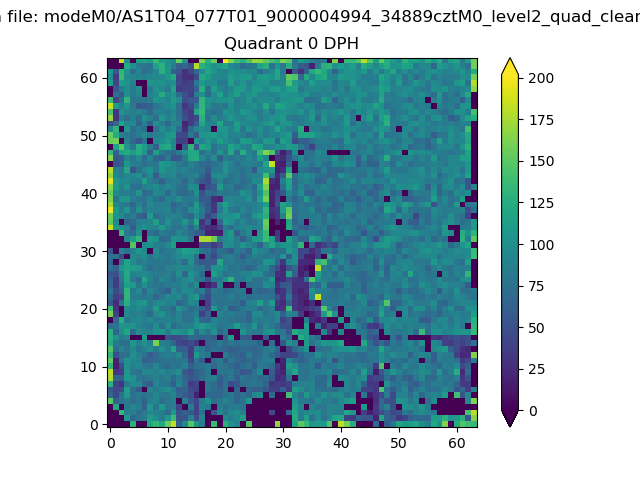 |
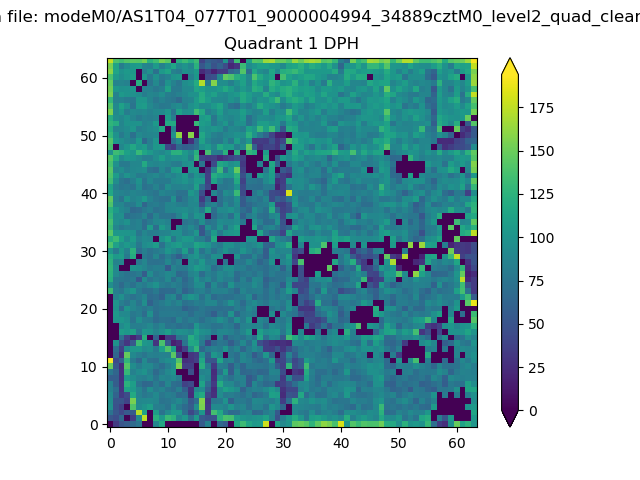 |
Quadrant B |
|---|---|---|---|
| Quadrant D | 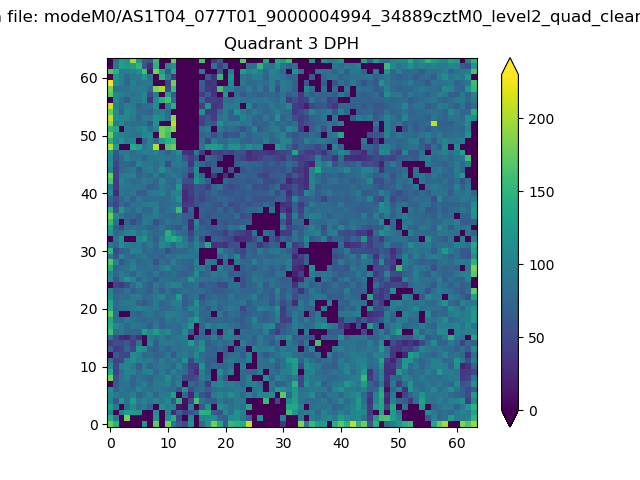 |
 |
Quadrant C |
| Plot type | Count rate plots | Images |
|---|---|---|
| Comparison with Poisson distribution Blue bars denote a histogram of data divided into 1 sec bins. Red curve is a Poisson curve with rate = median count rate of data. |
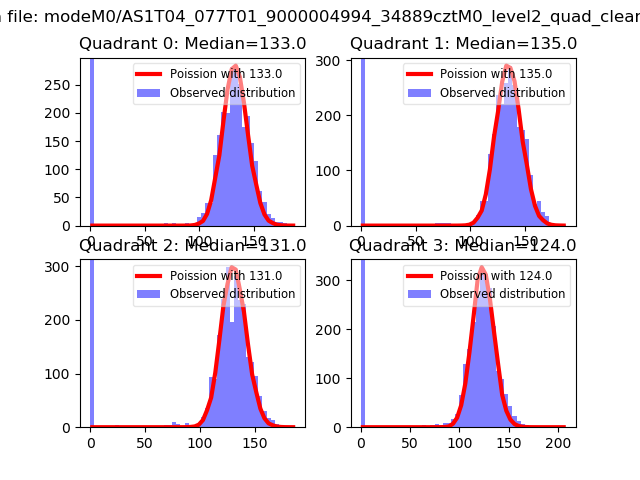 |
 |
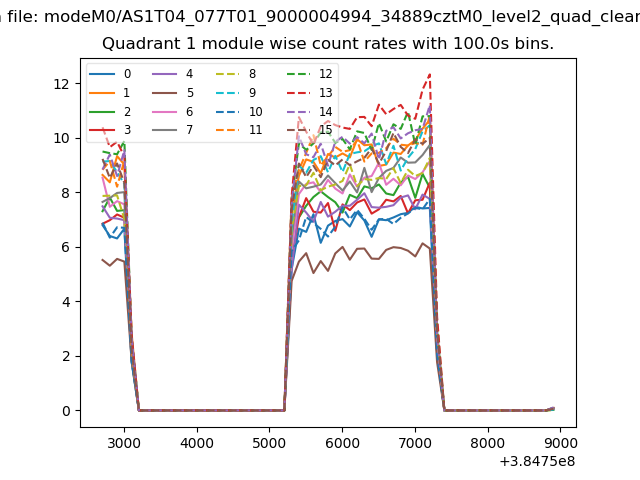
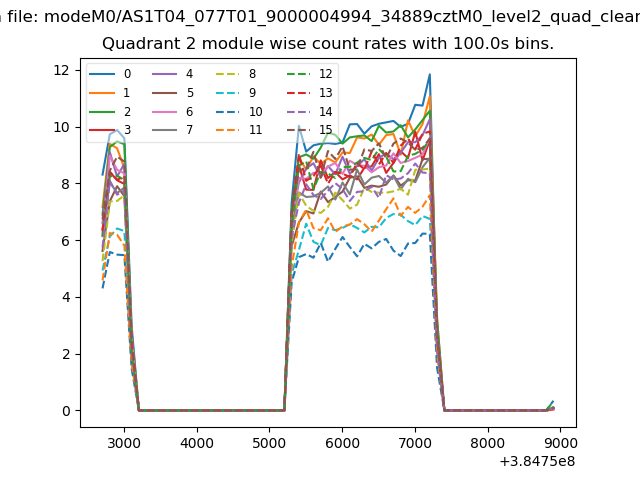
| Quadrant-wise count rates Data is divided into 100 sec bins |
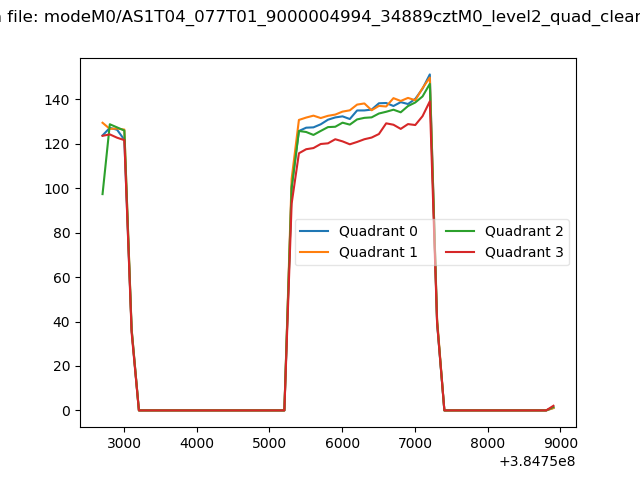 |
|
| Module-wise count rates for Quadrant A Data is divided into 100 sec bins |
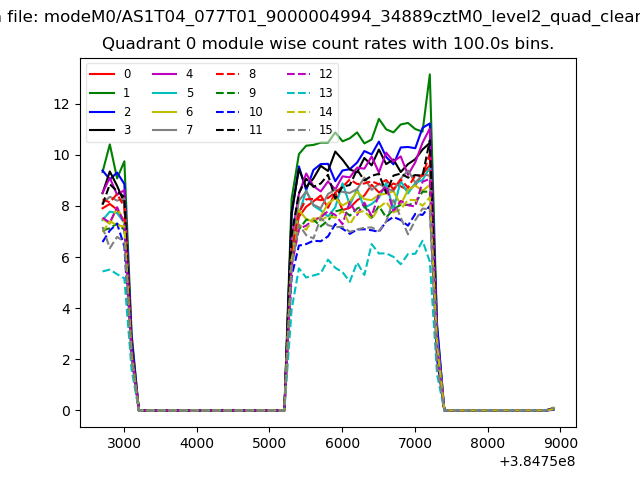 |
 |
| Module-wise count rates for Quadrant B Data is divided into 100 sec bins |
 |
 |
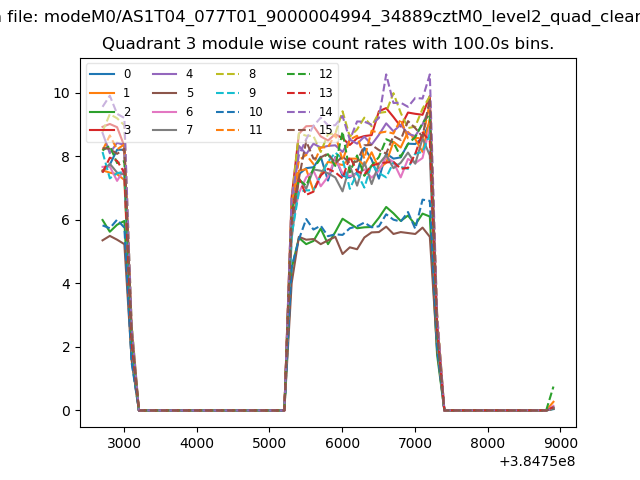
| Module-wise count rates for Quadrant C Data is divided into 100 sec bins |
 |
 |
| Module-wise count rates for Quadrant D Data is divided into 100 sec bins |
 |
 |
| Parameter | Plot |
|---|---|
| CZT HV Monitor | 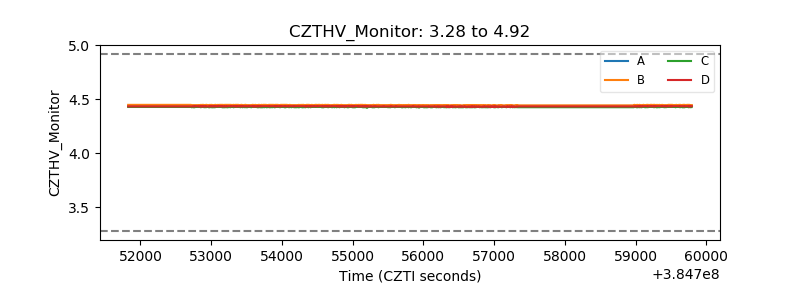 |
| D_VDD | 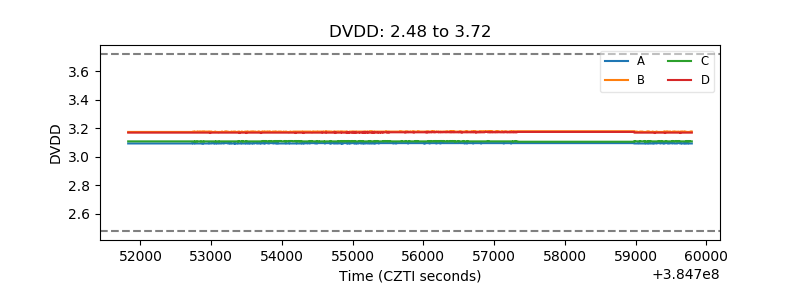 |
| Temperature 1 | 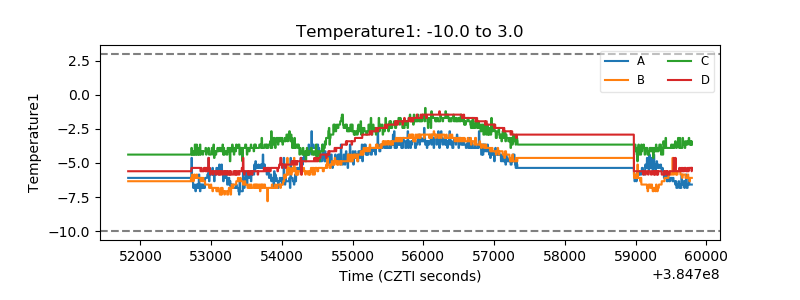 |
| Veto HV Monitor | 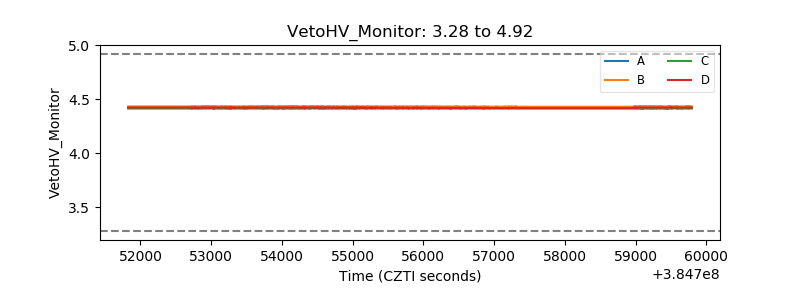 |
| Veto LLD | 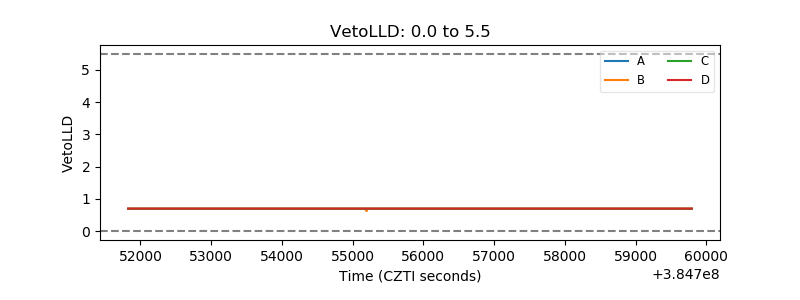 |
| Alpha Counter | 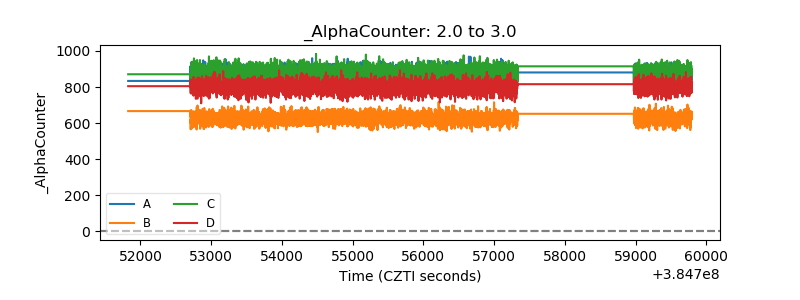 |
| _CPM_Rate | 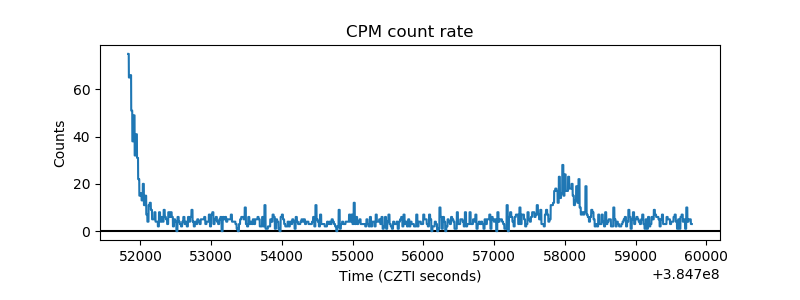 |
| CZT Counter | 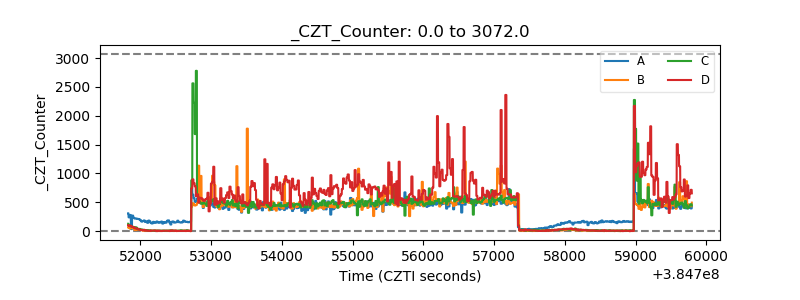 |
| +2.5 Volts monitor | 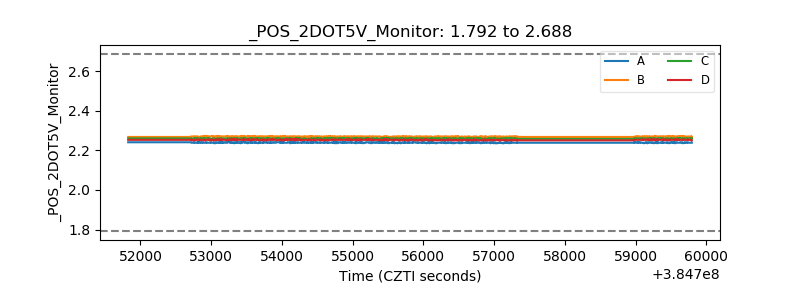 |
| +5 Volts monitor | 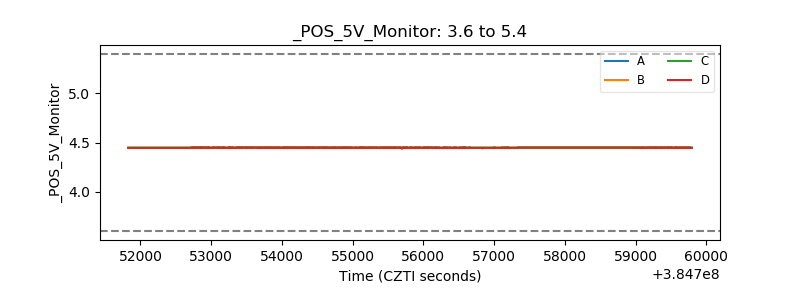 |
| _ROLL_ROT | 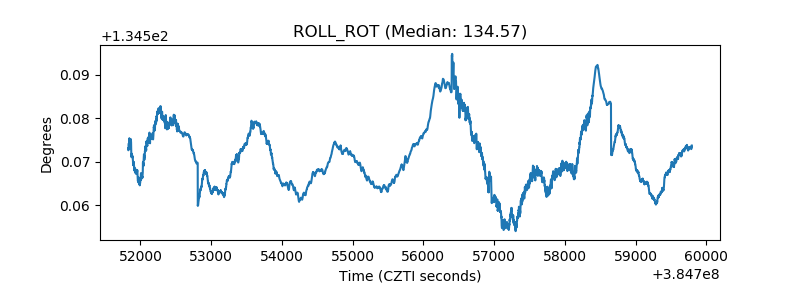 |
| _Roll_DEC | 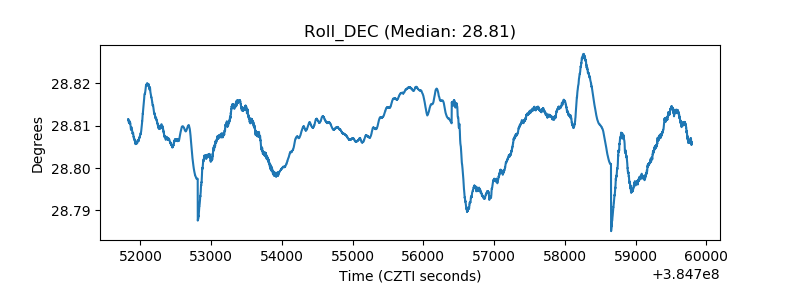 |
| _Roll_RA | 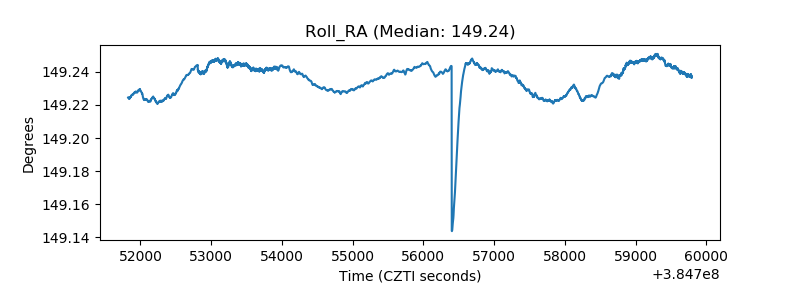 |
| Veto Counter | 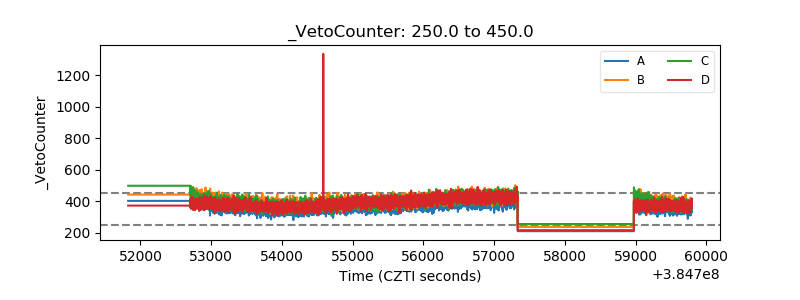 |