| Param | Original file | Final file |
|---|---|---|
| Filename | modeM0/AS1T04_077T01_9000004994cztM0_level2_bc.evt | modeM0/AS1T04_077T01_9000004994cztM0_level2_quad_clean.evt |
| Size (bytes) | 1,825,554,240 | 504,535,680 |
| Size | 1.7 GB | 481.2 MB |
| Events in quadrant A | 8,001,934 | 3,250,705 |
| Events in quadrant B | 12,328,798 | 3,212,525 |
| Events in quadrant C | 10,293,041 | 3,194,402 |
| Events in quadrant D | 22,016,571 | 2,953,458 |
| Mode M9 | |||
|---|---|---|---|
| Quadrant | BADHDUFLAG | Total packets | Discarded packets |
| A | 0 | 126 | 0 |
| B | 0 | 126 | 0 |
| C | 0 | 126 | 0 |
| D | 0 | 126 | 0 |
| Mode M0 | |||
|---|---|---|---|
| Quadrant | BADHDUFLAG | Total packets | Discarded packets |
| A | 0 | 78690 | 0 |
| B | 0 | 97638 | 0 |
| C | 0 | 82525 | 0 |
| D | 0 | 123912 | 0 |
| Mode SS | |||
|---|---|---|---|
| Quadrant | BADHDUFLAG | Total packets | Discarded packets |
| A | 0 | 794 | 0 |
| B | 0 | 794 | 0 |
| C | 0 | 794 | 0 |
| D | 0 | 794 | 0 |
| Quadrant | Total seconds | Saturated seconds | Saturation percentage |
|---|---|---|---|
| A | 38886 | 39 | 0.100293% |
| B | 38886 | 1378 | 3.543692% |
| C | 38886 | 223 | 0.573471% |
| D | 38886 | 1532 | 3.939721% |
Noise dominated data is calculated using 1-second bins in cleaned event files. If a bin has >2000 counts, and if more than 50% of those come from <1% of pixels, then it is considered to be noise-dominated and hence unusable.
| Quadrant | # 1 sec bins | Bins with >0 counts | Bins with >2000 counts | High rate bins dominated by noise | Noise dominated (total time) | Noise dominated (detector-on time) | Marked lightcurve |
|---|---|---|---|---|---|---|---|
| A | 51522 | 38891 | 0 | 0 | 0.00% | 0.00% | 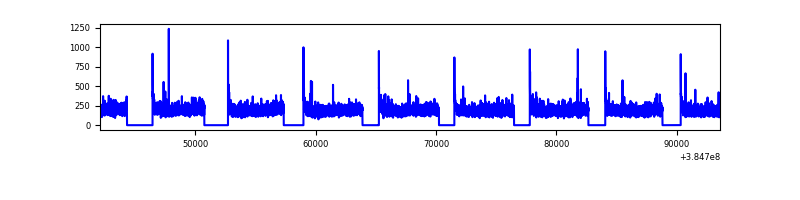 |
| B | 51522 | 38887 | 65 | 65 | 0.13% | 0.17% | 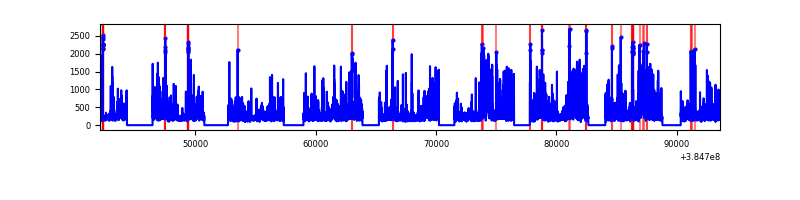 |
| C | 51522 | 38887 | 29 | 29 | 0.06% | 0.07% | 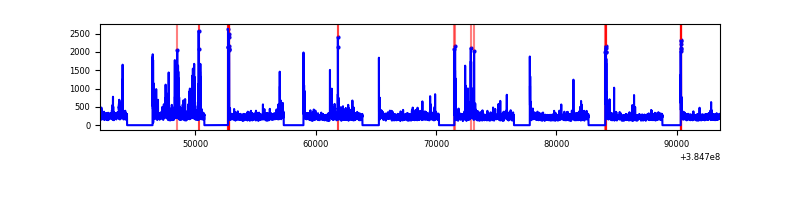 |
| D | 51522 | 38886 | 560 | 560 | 1.09% | 1.44% | 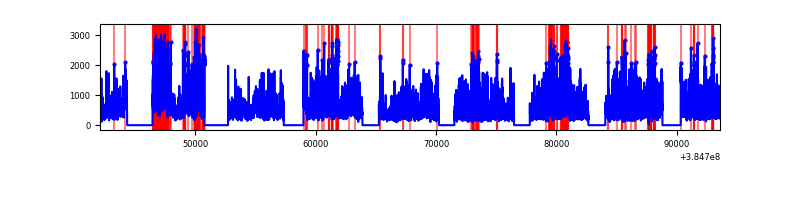 |
Top three noisy pixels from each quadrant. If the there are fewer than three noisy pixels in the level2.evt file, extra rows are filled as -1
| Pixel properties | Quadrant properties | ||||||
|---|---|---|---|---|---|---|---|
| Quadrant | DetID | PixID | Counts | Sigma | Mean | Median | Sigma |
| A | 10 | 83 | 273381 | 615.83 | 1975 | 1936 | 440.8 |
| A | 13 | 6 | 70789 | 156.21 | 1975 | 1936 | 440.8 |
| A | 13 | 254 | 57701 | 126.52 | 1975 | 1936 | 440.8 |
| B | 4 | 171 | 1615030 | 4150.8 | 1967 | 1922 | 388.6 |
| B | 5 | 172 | 1589333 | 4084.68 | 1967 | 1922 | 388.6 |
| B | 0 | 190 | 818566 | 2101.36 | 1967 | 1922 | 388.6 |
| C | 15 | 214 | 1657639 | 3752.21 | 1930 | 1911 | 441.3 |
| C | 0 | 207 | 470757 | 1062.5 | 1930 | 1911 | 441.3 |
| C | 0 | 10 | 416728 | 940.06 | 1930 | 1911 | 441.3 |
| D | 8 | 195 | 6915864 | 15094.24 | 1908 | 1846 | 458.1 |
| D | 1 | 52 | 2249896 | 4907.8 | 1908 | 1846 | 458.1 |
| D | 7 | 223 | 984782 | 2145.88 | 1908 | 1846 | 458.1 |
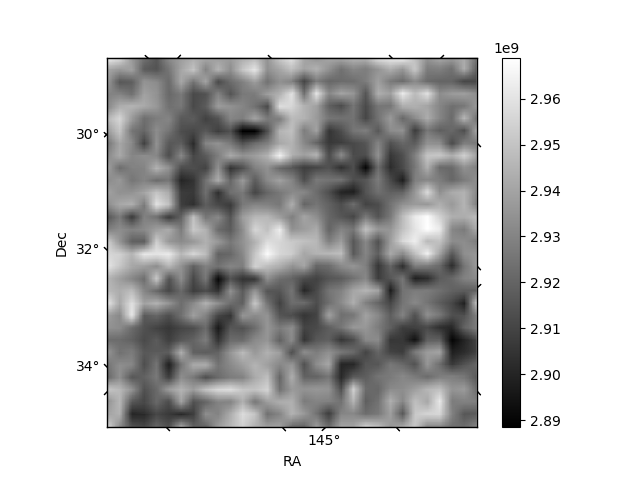
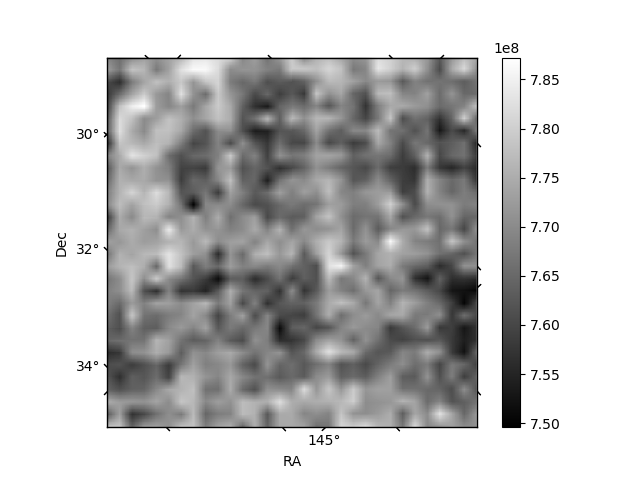
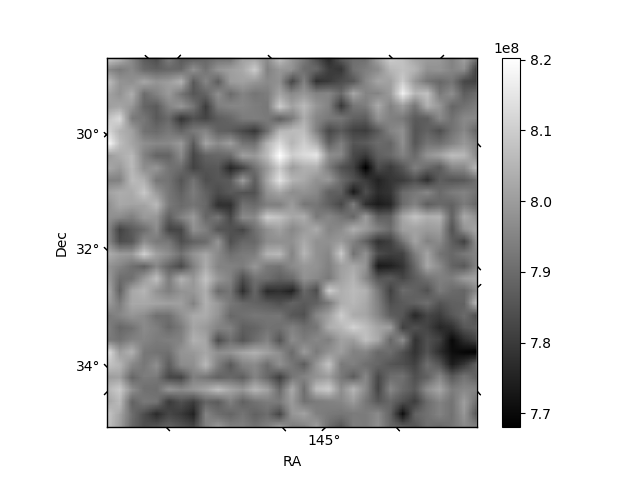
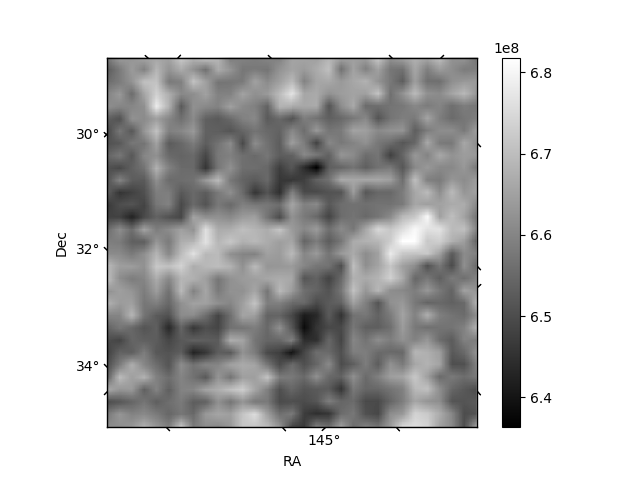
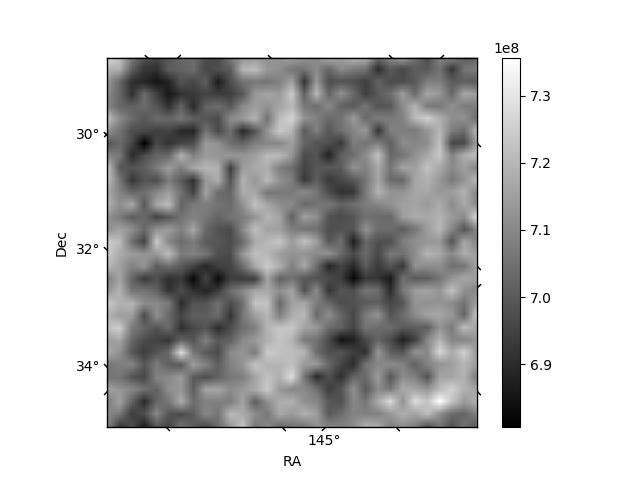
Histogram calculated using DETX and DETY for each event in the final _common_clean file
| Quadrant A | 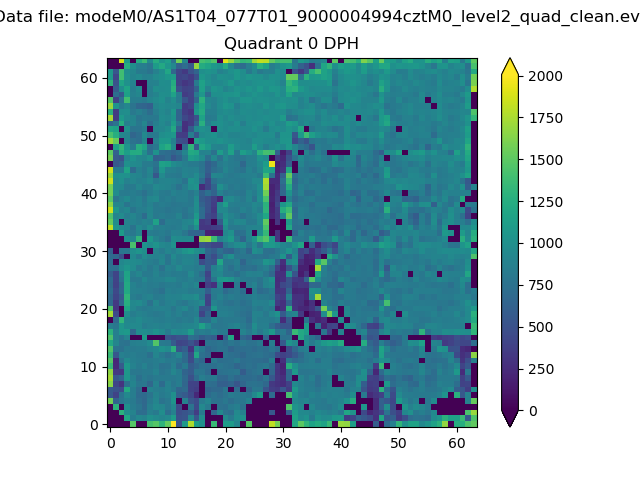 |
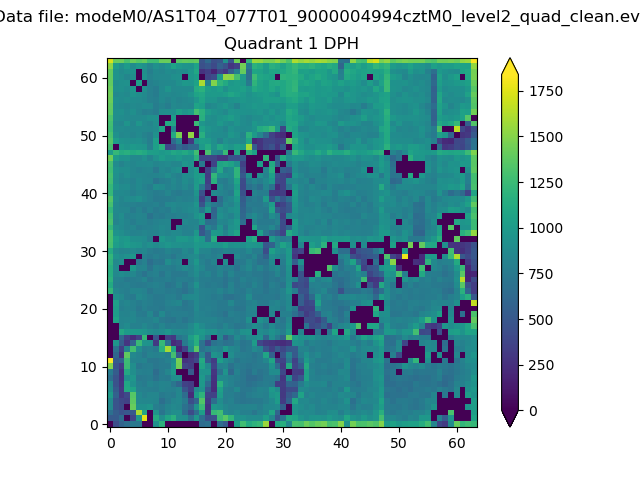 |
Quadrant B |
|---|---|---|---|
| Quadrant D | 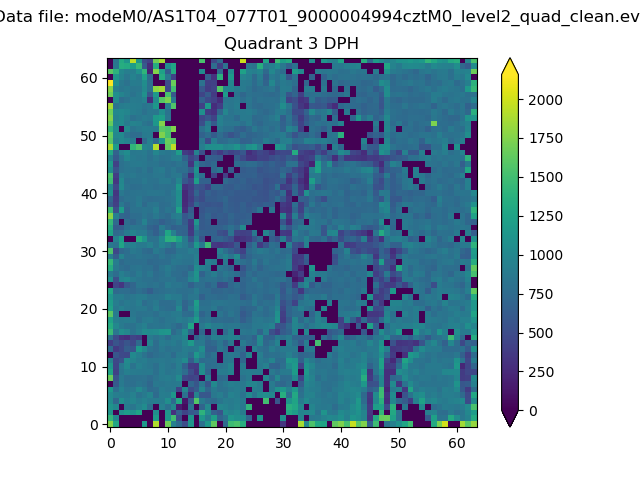 |
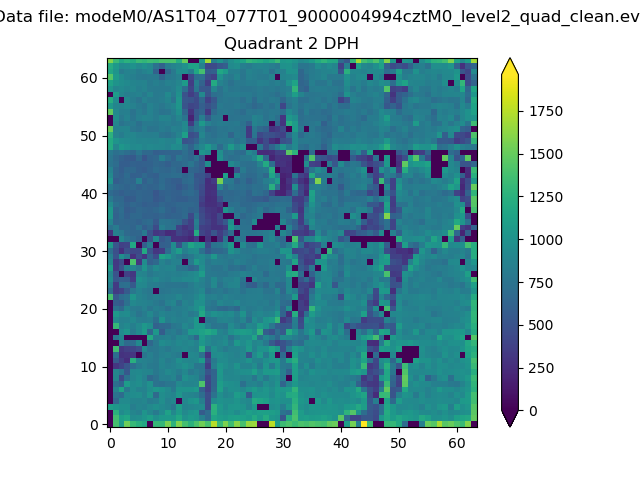 |
Quadrant C |
| Plot type | Count rate plots | Images |
|---|---|---|
| Comparison with Poisson distribution Blue bars denote a histogram of data divided into 1 sec bins. Red curve is a Poisson curve with rate = median count rate of data. |
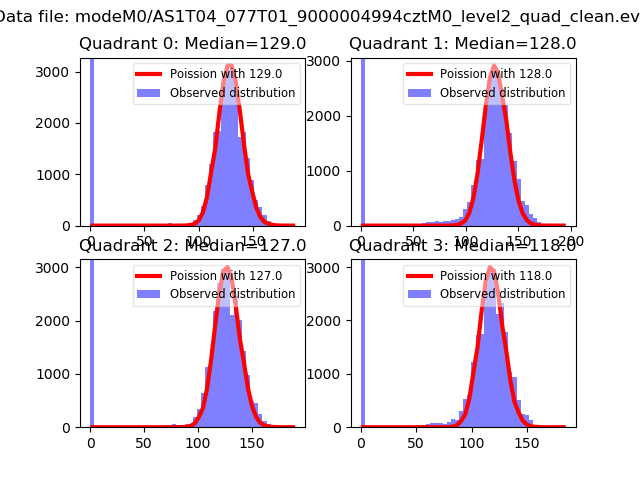 |
 |
| Quadrant-wise count rates Data is divided into 100 sec bins |
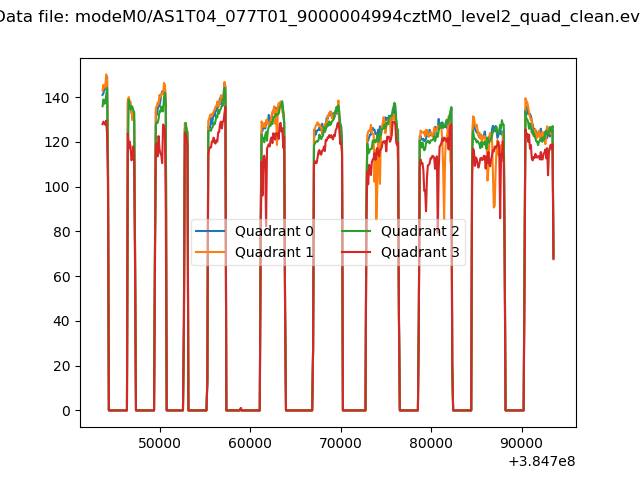 |
|
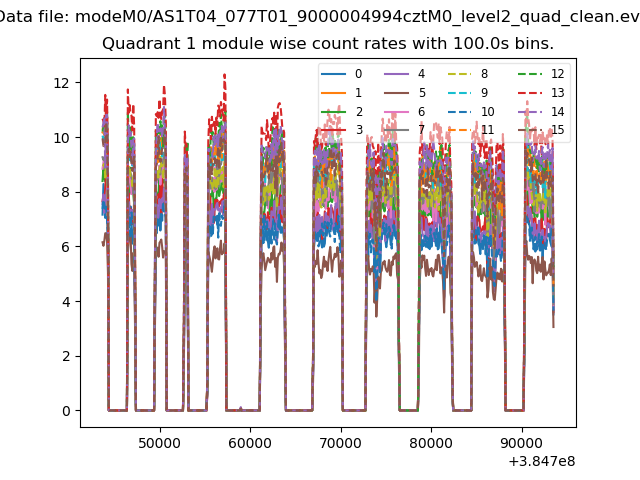
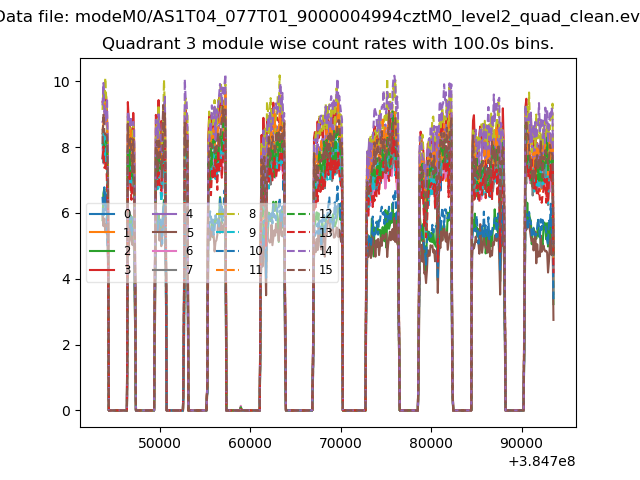
| Module-wise count rates for Quadrant A Data is divided into 100 sec bins |
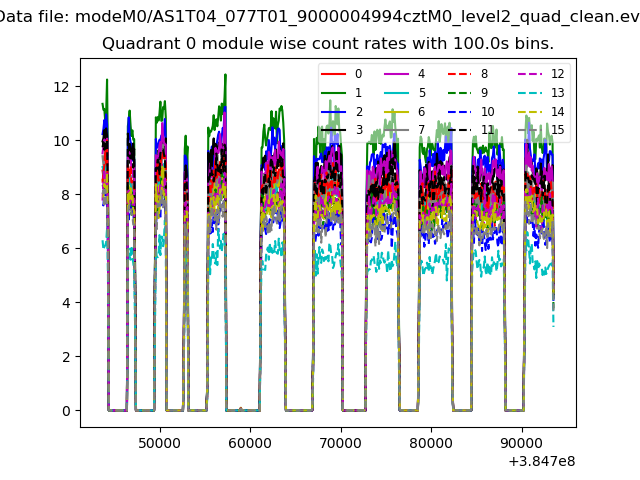 |
 |
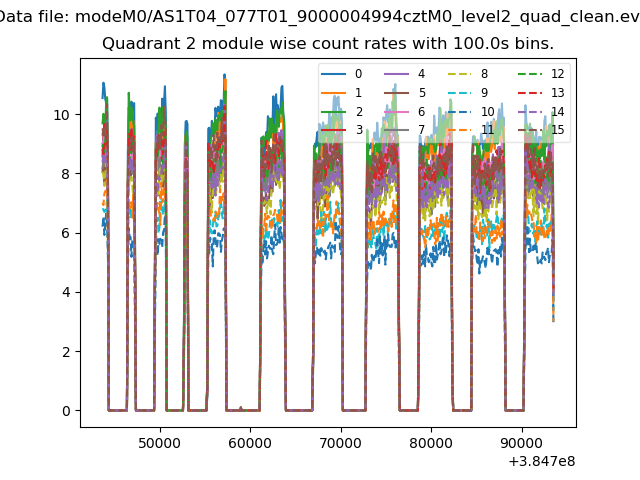
| Module-wise count rates for Quadrant B Data is divided into 100 sec bins |
 |
 |
| Module-wise count rates for Quadrant C Data is divided into 100 sec bins |
 |
 |
| Module-wise count rates for Quadrant D Data is divided into 100 sec bins |
 |
 |
| Parameter | Plot |
|---|---|
| CZT HV Monitor | 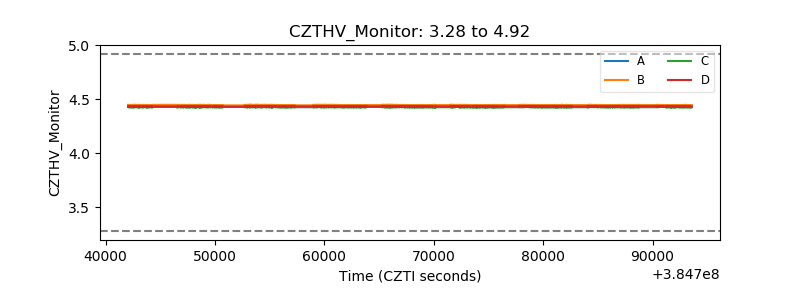 |
| D_VDD | 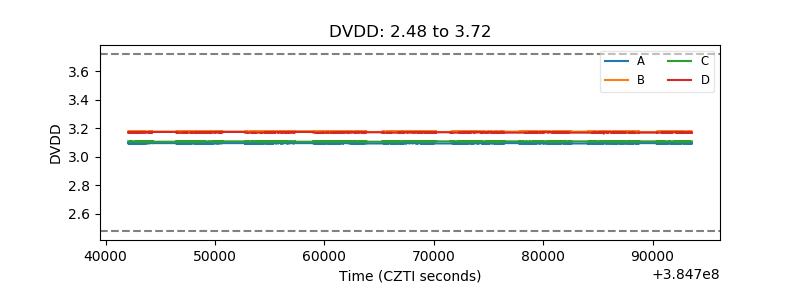 |
| Temperature 1 | 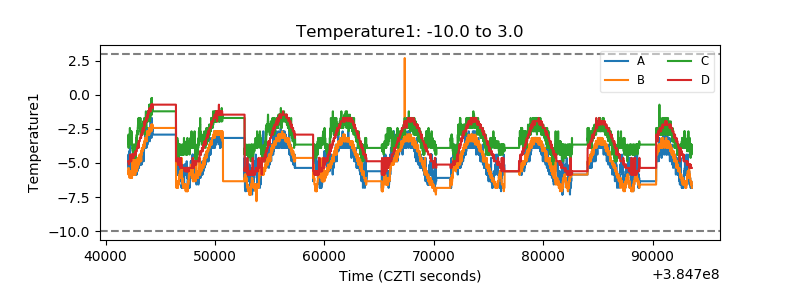 |
| Veto HV Monitor | 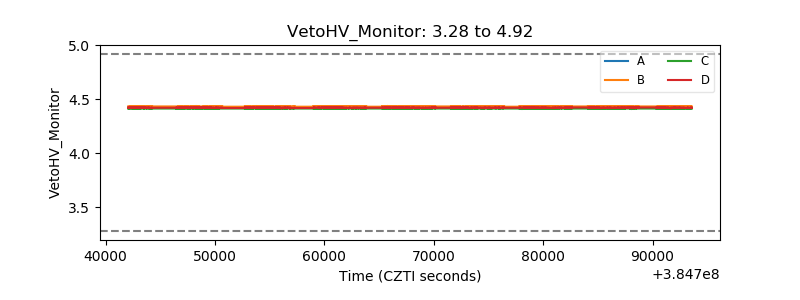 |
| Veto LLD | 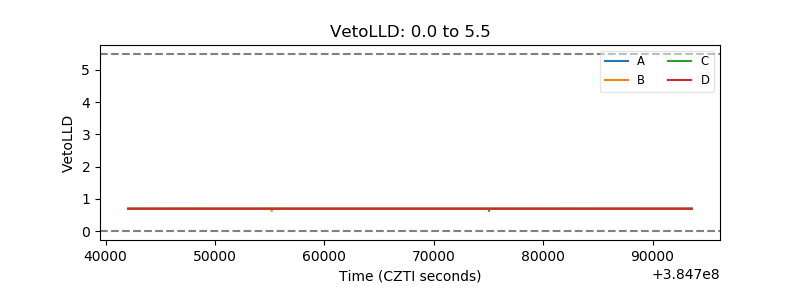 |
| Alpha Counter | 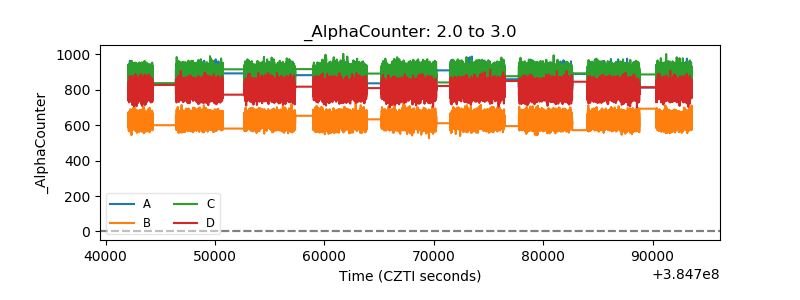 |
| _CPM_Rate | 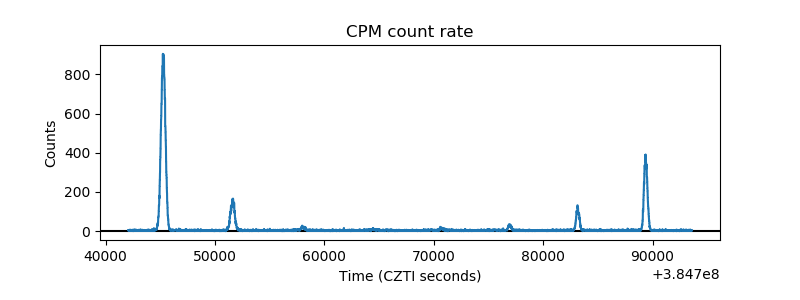 |
| CZT Counter | 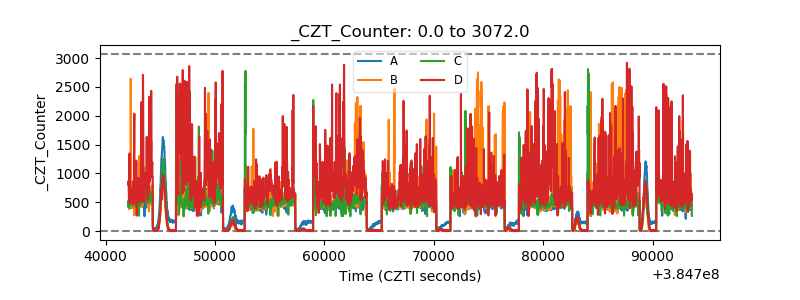 |
| +2.5 Volts monitor | 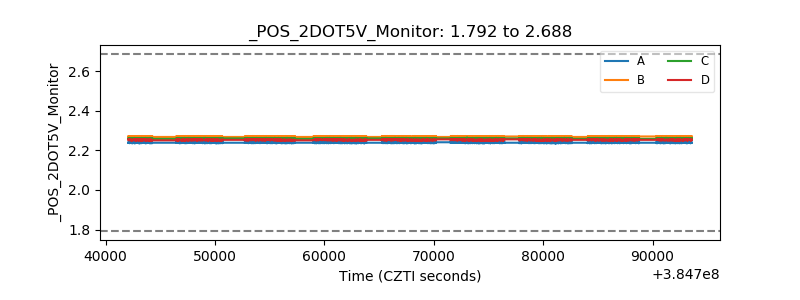 |
| +5 Volts monitor | 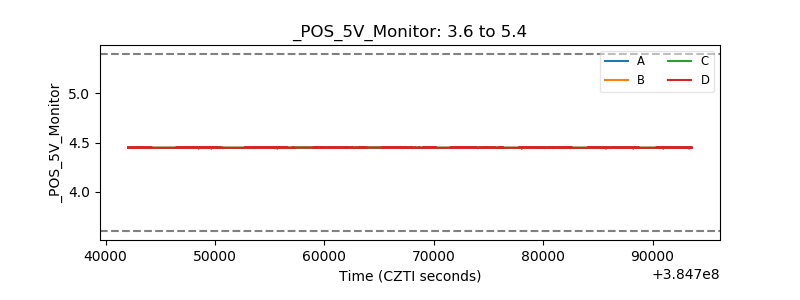 |
| _ROLL_ROT | 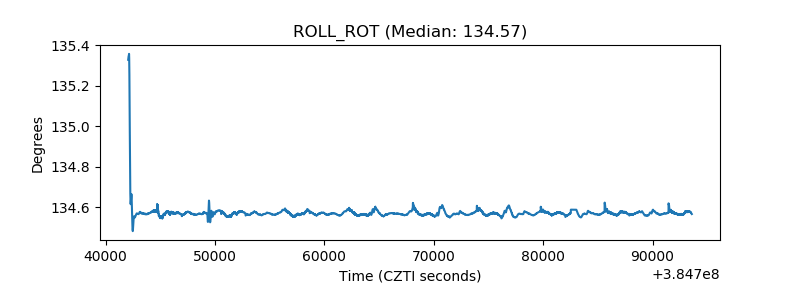 |
| _Roll_DEC | 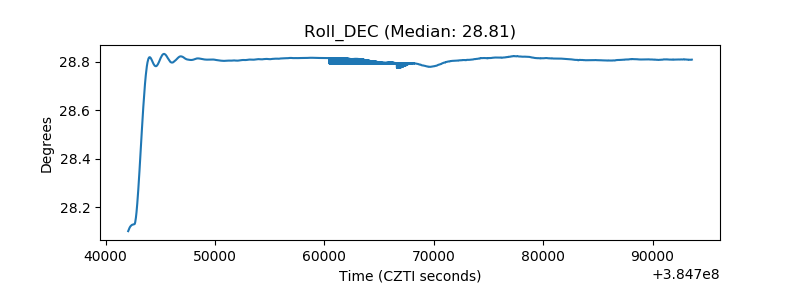 |
| _Roll_RA | 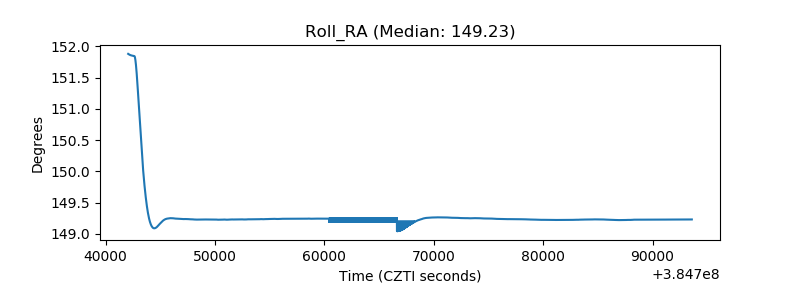 |
| Veto Counter | 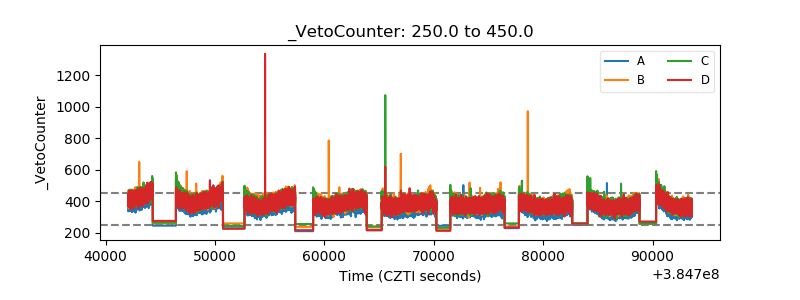 |