| Param | Original file | Final file |
|---|---|---|
| Filename | modeM0/AS1A11_053T01_9000004996_34897cztM0_level2.evt | modeM0/AS1A11_053T01_9000004996_34897cztM0_level2_quad_clean.evt |
| Size (bytes) | 441,144,000 | 89,130,240 |
| Size | 420.7 MB | 85.0 MB |
| Events in quadrant A | 2,499,411 | 587,349 |
| Events in quadrant B | 3,013,369 | 594,698 |
| Events in quadrant C | 2,874,813 | 598,633 |
| Events in quadrant D | 4,615,362 | 550,104 |
| Mode M9 | |||
|---|---|---|---|
| Quadrant | BADHDUFLAG | Total packets | Discarded packets |
| A | 0 | 29 | 0 |
| B | 0 | 29 | 0 |
| C | 0 | 29 | 0 |
| D | 0 | 30 | 0 |
| Mode SS | |||
|---|---|---|---|
| Quadrant | BADHDUFLAG | Total packets | Discarded packets |
| A | 0 | 108 | 0 |
| B | 0 | 108 | 0 |
| C | 0 | 108 | 0 |
| D | 0 | 108 | 0 |
| Mode M0 | |||
|---|---|---|---|
| Quadrant | BADHDUFLAG | Total packets | Discarded packets |
| A | 0 | 11005 | 3 |
| B | 0 | 12471 | 2 |
| C | 0 | 11732 | 2 |
| D | 0 | 17312 | 2 |
| Quadrant | Total seconds | Saturated seconds | Saturation percentage |
|---|---|---|---|
| A | 5256 | 6 | 0.114155% |
| B | 5256 | 87 | 1.655251% |
| C | 5256 | 85 | 1.617199% |
| D | 5256 | 472 | 8.980213% |
Noise dominated data is calculated using 1-second bins in cleaned event files. If a bin has >2000 counts, and if more than 50% of those come from <1% of pixels, then it is considered to be noise-dominated and hence unusable.
| Quadrant | # 1 sec bins | Bins with >0 counts | Bins with >2000 counts | High rate bins dominated by noise | Noise dominated (total time) | Noise dominated (detector-on time) | Marked lightcurve |
|---|---|---|---|---|---|---|---|
| A | 7049 | 5257 | 0 | 0 | 0.00% | 0.00% | 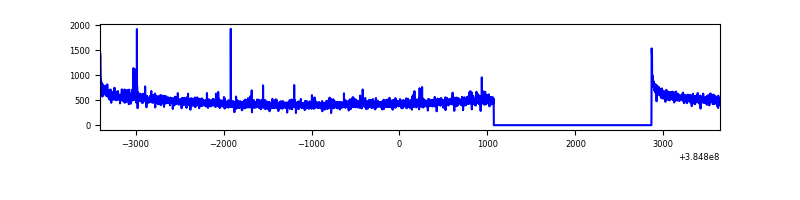 |
| B | 7049 | 5257 | 67 | 67 | 0.95% | 1.27% | 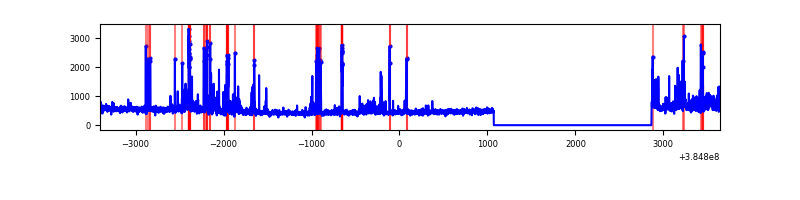 |
| C | 7049 | 5257 | 61 | 61 | 0.87% | 1.16% | 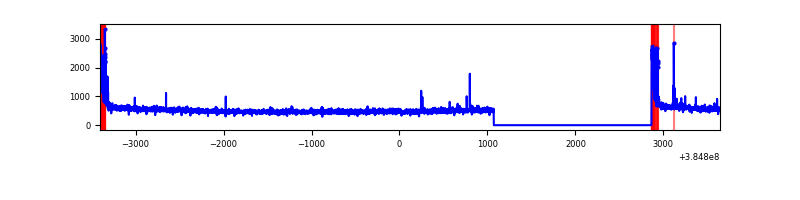 |
| D | 7049 | 5257 | 387 | 387 | 5.49% | 7.36% | 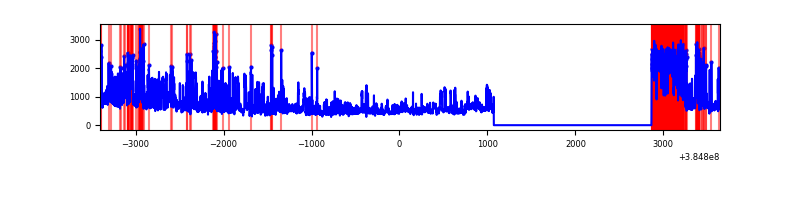 |
Top three noisy pixels from each quadrant. If the there are fewer than three noisy pixels in the level2.evt file, extra rows are filled as -1
| Pixel properties | Quadrant properties | ||||||
|---|---|---|---|---|---|---|---|
| Quadrant | DetID | PixID | Counts | Sigma | Mean | Median | Sigma |
| A | 10 | 83 | 62556 | 495.09 | 622 | 609 | 125.1 |
| A | 7 | 16 | 13779 | 105.26 | 622 | 609 | 125.1 |
| A | 13 | 254 | 10243 | 77.0 | 622 | 609 | 125.1 |
| B | 5 | 172 | 229508 | 1931.88 | 620 | 605 | 118.5 |
| B | 0 | 190 | 144462 | 1214.11 | 620 | 605 | 118.5 |
| B | 4 | 232 | 73710 | 616.99 | 620 | 605 | 118.5 |
| C | 15 | 214 | 237212 | 1668.15 | 611 | 617 | 141.8 |
| C | 0 | 10 | 193880 | 1362.63 | 611 | 617 | 141.8 |
| C | 14 | 67 | 23828 | 163.65 | 611 | 617 | 141.8 |
| D | 8 | 195 | 1020649 | 7173.79 | 585 | 567 | 142.2 |
| D | 10 | 118 | 665568 | 4676.66 | 585 | 567 | 142.2 |
| D | 7 | 223 | 188390 | 1320.88 | 585 | 567 | 142.2 |
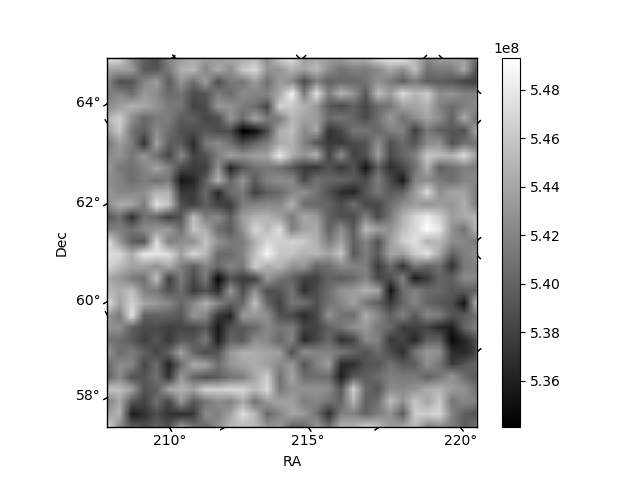
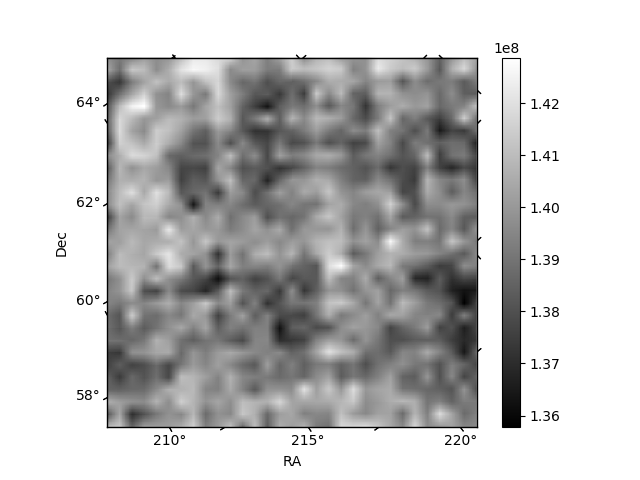
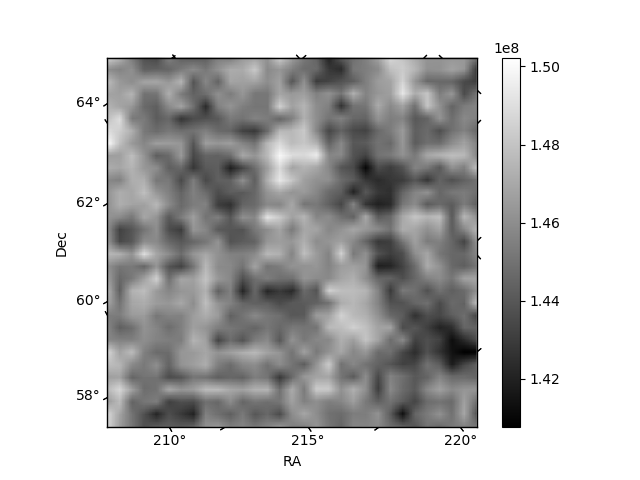
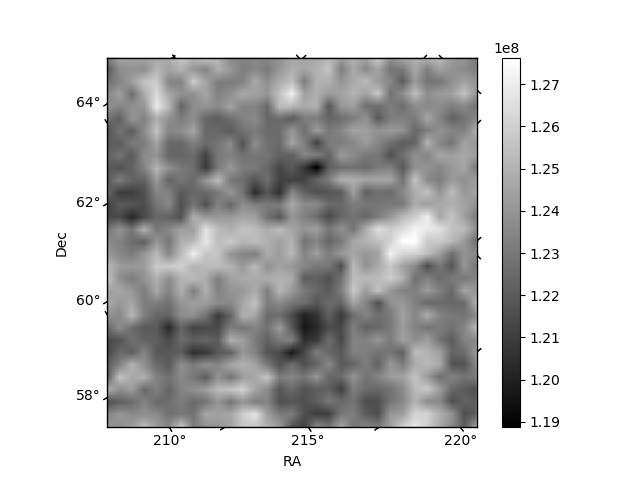
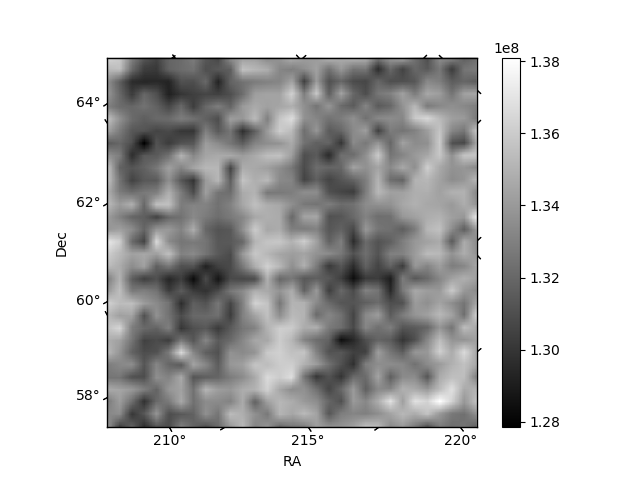
Histogram calculated using DETX and DETY for each event in the final _common_clean file
| Quadrant A | 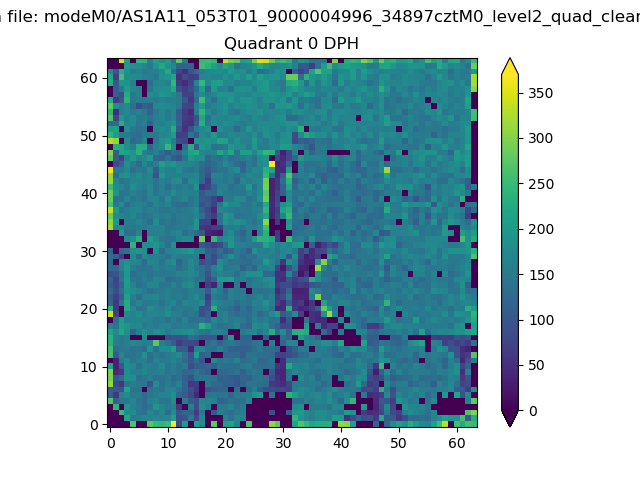 |
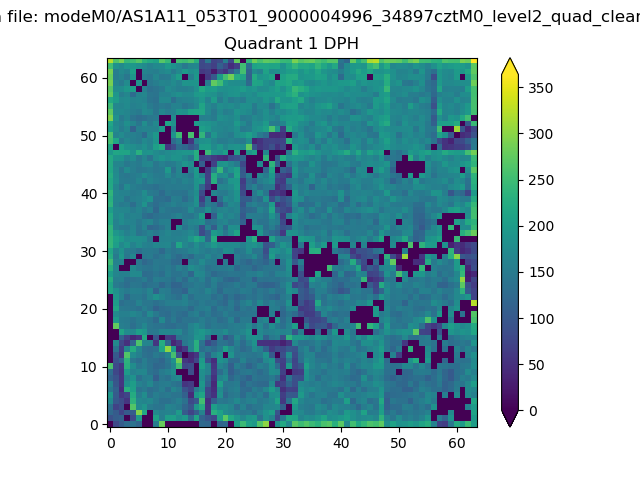 |
Quadrant B |
|---|---|---|---|
| Quadrant D |  |
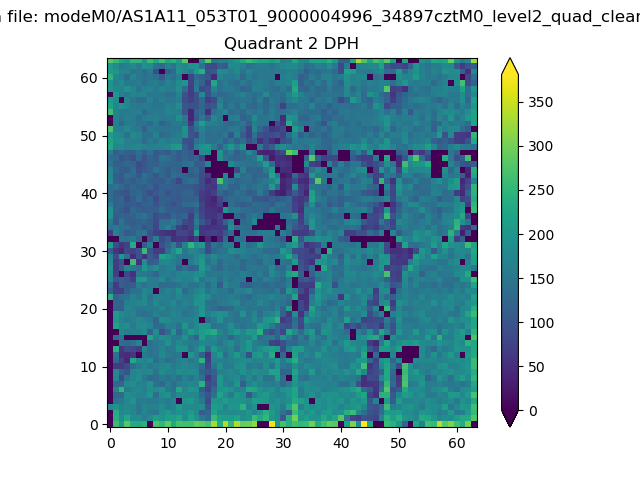 |
Quadrant C |
| Plot type | Count rate plots | Images |
|---|---|---|
| Comparison with Poisson distribution Blue bars denote a histogram of data divided into 1 sec bins. Red curve is a Poisson curve with rate = median count rate of data. |
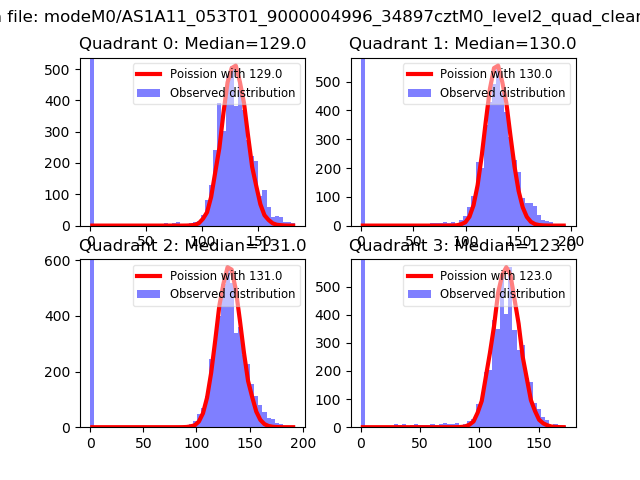 |
 |
| Quadrant-wise count rates Data is divided into 100 sec bins |
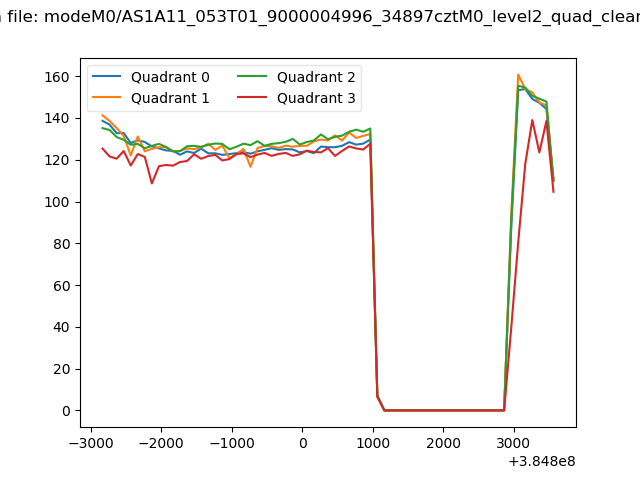 |
|
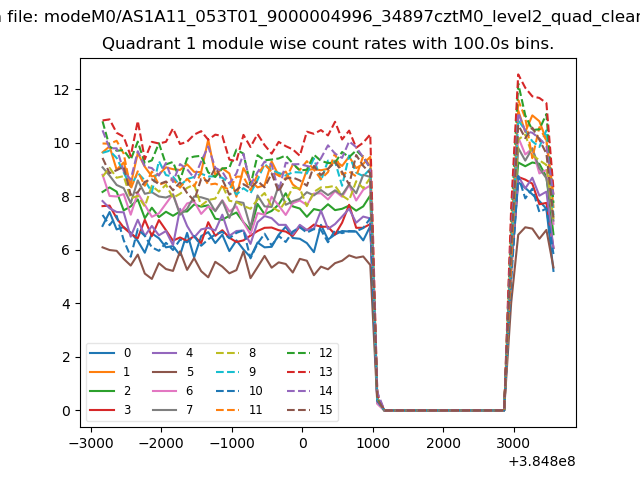
| Module-wise count rates for Quadrant A Data is divided into 100 sec bins |
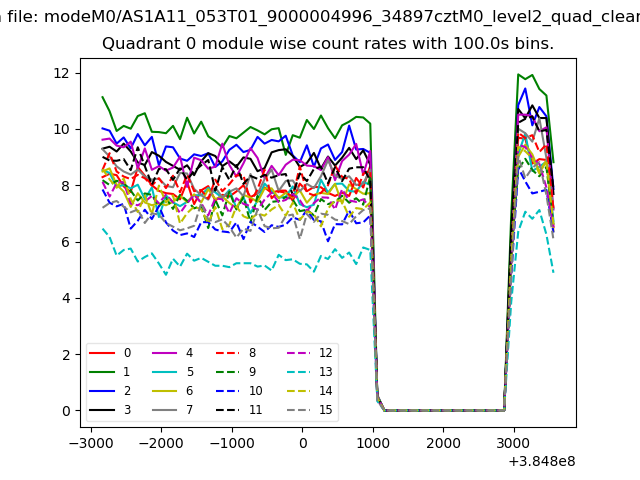 |
 |
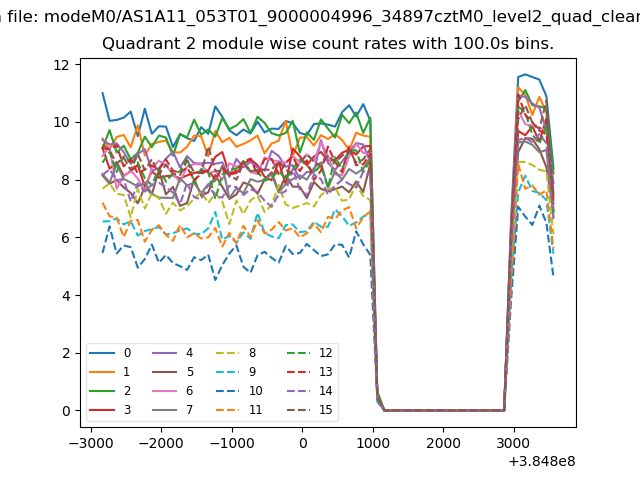
| Module-wise count rates for Quadrant B Data is divided into 100 sec bins |
 |
 |
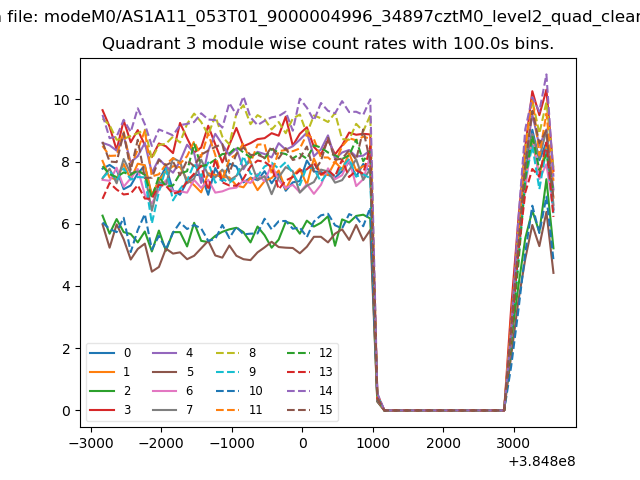
| Module-wise count rates for Quadrant C Data is divided into 100 sec bins |
 |
 |
| Module-wise count rates for Quadrant D Data is divided into 100 sec bins |
 |
 |
| Parameter | Plot |
|---|---|
| CZT HV Monitor |  |
| D_VDD |  |
| Temperature 1 | 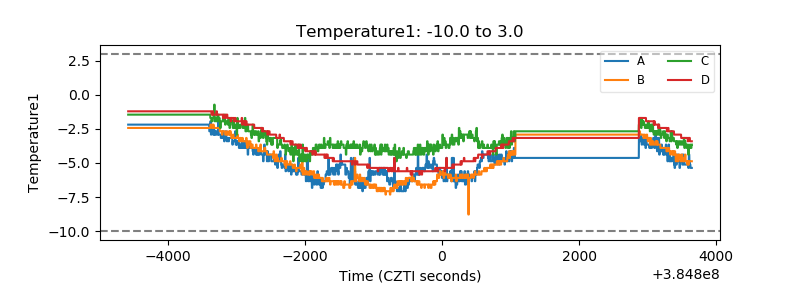 |
| Veto HV Monitor | 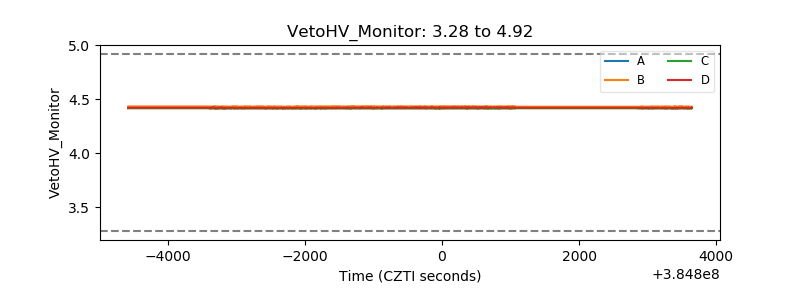 |
| Veto LLD | 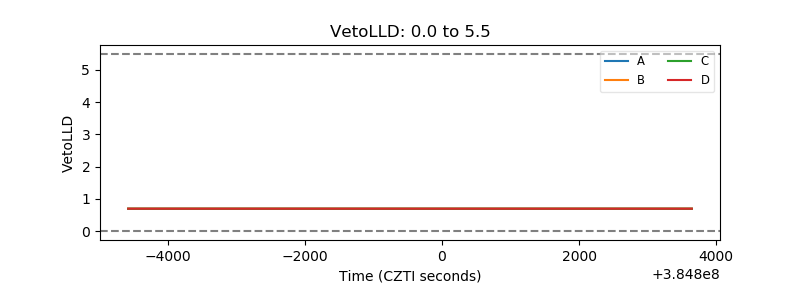 |
| Alpha Counter | 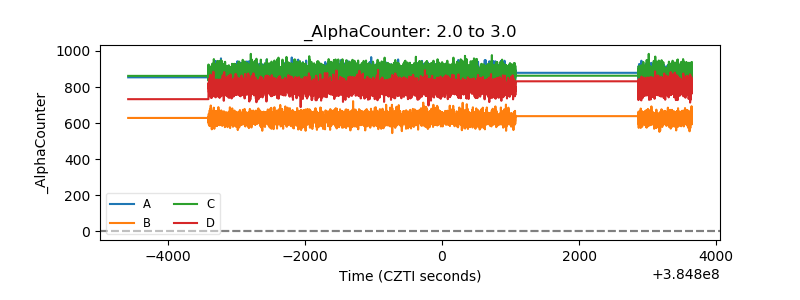 |
| _CPM_Rate | 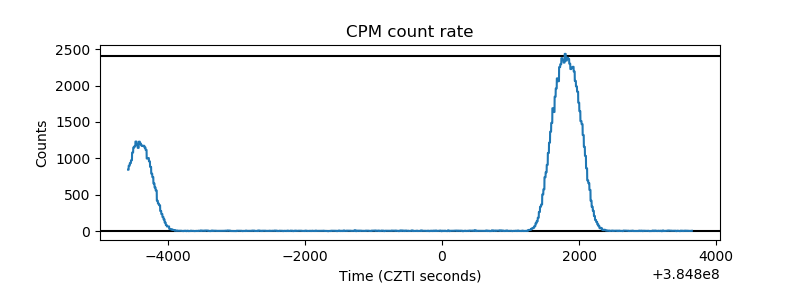 |
| CZT Counter | 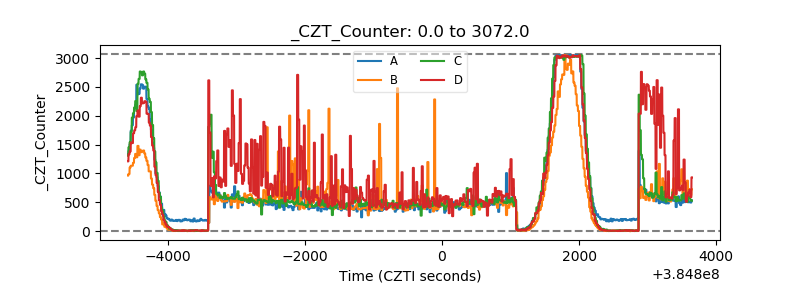 |
| +2.5 Volts monitor | 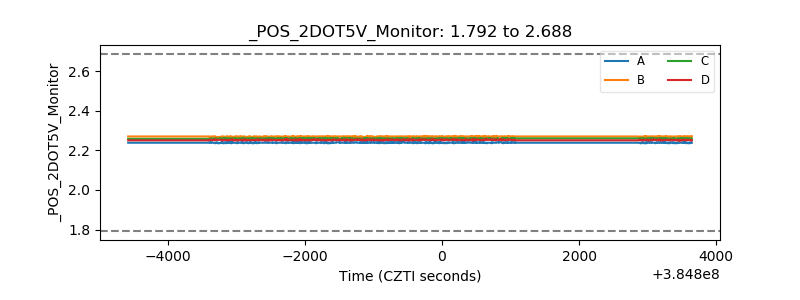 |
| +5 Volts monitor | 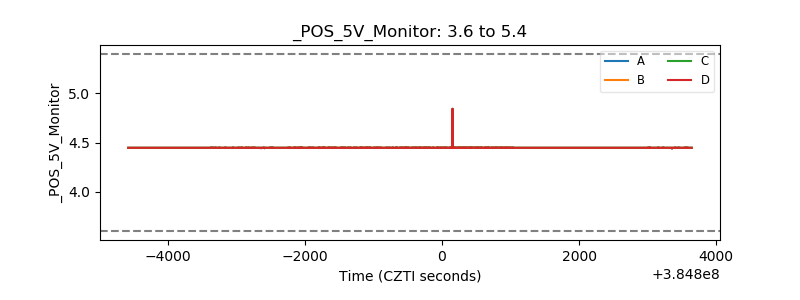 |
| _ROLL_ROT | 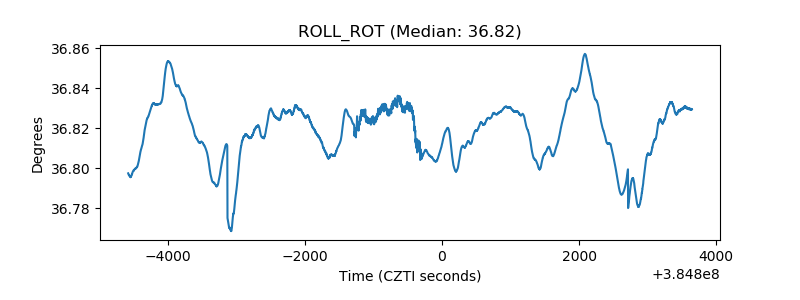 |
| _Roll_DEC | 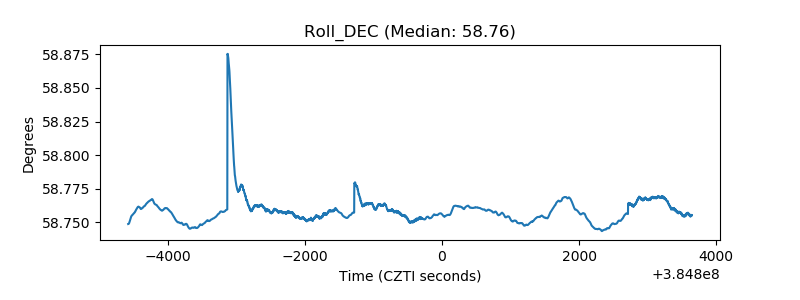 |
| _Roll_RA | 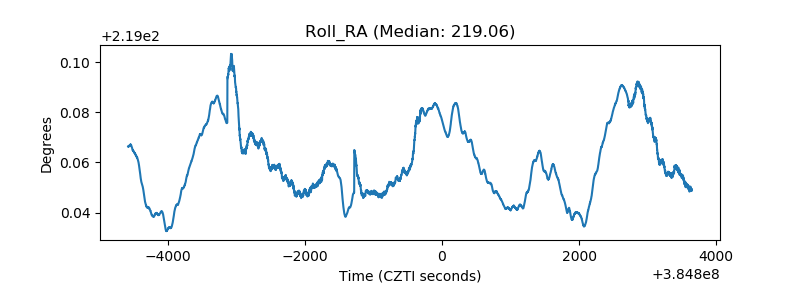 |
| Veto Counter | 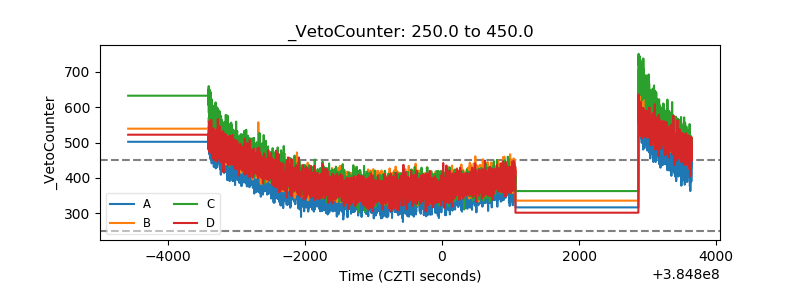 |