| Param | Original file | Final file |
|---|---|---|
| Filename | modeM0/AS1C07_005T01_9000004992_34885cztM0_level2.evt | modeM0/AS1C07_005T01_9000004992_34885cztM0_level2_quad_clean.evt |
| Size (bytes) | 434,424,960 | 78,393,600 |
| Size | 414.3 MB | 74.8 MB |
| Events in quadrant A | 2,623,400 | 517,384 |
| Events in quadrant B | 3,092,367 | 529,251 |
| Events in quadrant C | 2,914,677 | 507,660 |
| Events in quadrant D | 4,188,579 | 470,724 |
| Mode M9 | |||
|---|---|---|---|
| Quadrant | BADHDUFLAG | Total packets | Discarded packets |
| A | 0 | 35 | 0 |
| B | 0 | 35 | 0 |
| C | 0 | 35 | 0 |
| D | 0 | 36 | 0 |
| Mode M0 | |||
|---|---|---|---|
| Quadrant | BADHDUFLAG | Total packets | Discarded packets |
| A | 0 | 10768 | 3 |
| B | 0 | 12327 | 2 |
| C | 0 | 11530 | 2 |
| D | 0 | 15992 | 2 |
| Mode SS | |||
|---|---|---|---|
| Quadrant | BADHDUFLAG | Total packets | Discarded packets |
| A | 0 | 102 | 0 |
| B | 0 | 102 | 0 |
| C | 0 | 102 | 0 |
| D | 0 | 102 | 0 |
| Quadrant | Total seconds | Saturated seconds | Saturation percentage |
|---|---|---|---|
| A | 4973 | 64 | 1.286950% |
| B | 4973 | 65 | 1.307058% |
| C | 4973 | 59 | 1.186407% |
| D | 4973 | 215 | 4.323346% |
Noise dominated data is calculated using 1-second bins in cleaned event files. If a bin has >2000 counts, and if more than 50% of those come from <1% of pixels, then it is considered to be noise-dominated and hence unusable.
| Quadrant | # 1 sec bins | Bins with >0 counts | Bins with >2000 counts | High rate bins dominated by noise | Noise dominated (total time) | Noise dominated (detector-on time) | Marked lightcurve |
|---|---|---|---|---|---|---|---|
| A | 7036 | 4974 | 42 | 42 | 0.60% | 0.84% | 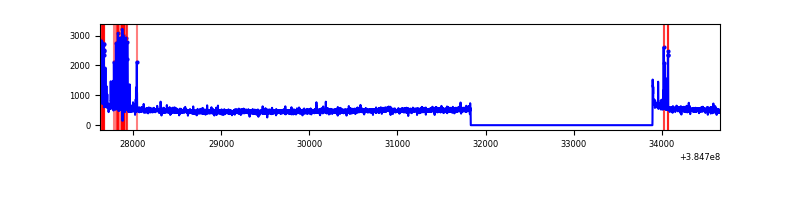 |
| B | 7036 | 4974 | 42 | 42 | 0.60% | 0.84% | 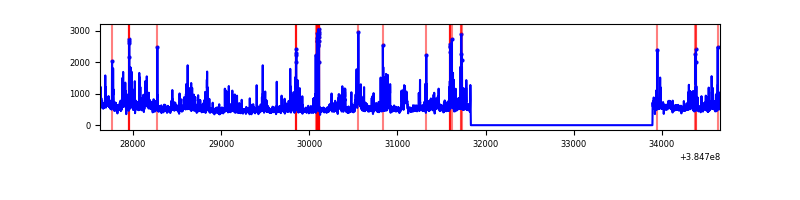 |
| C | 7036 | 4974 | 54 | 54 | 0.77% | 1.09% | 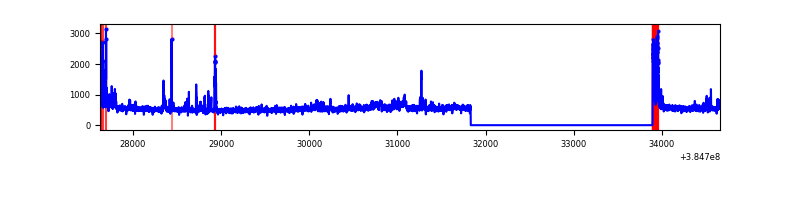 |
| D | 7036 | 4974 | 198 | 198 | 2.81% | 3.98% | 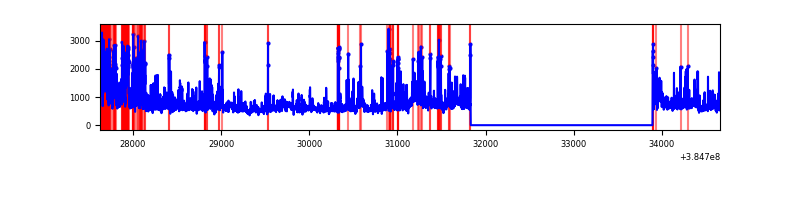 |
Top three noisy pixels from each quadrant. If the there are fewer than three noisy pixels in the level2.evt file, extra rows are filled as -1
| Pixel properties | Quadrant properties | ||||||
|---|---|---|---|---|---|---|---|
| Quadrant | DetID | PixID | Counts | Sigma | Mean | Median | Sigma |
| A | 15 | 237 | 163745 | 1346.21 | 614 | 604 | 121.2 |
| A | 10 | 83 | 57434 | 468.95 | 614 | 604 | 121.2 |
| A | 13 | 6 | 14186 | 112.08 | 614 | 604 | 121.2 |
| B | 5 | 172 | 258486 | 2264.98 | 617 | 603 | 113.9 |
| B | 0 | 190 | 130079 | 1137.18 | 617 | 603 | 113.9 |
| B | 4 | 171 | 73984 | 644.5 | 617 | 603 | 113.9 |
| C | 15 | 214 | 223993 | 1635.43 | 596 | 600 | 136.6 |
| C | 0 | 10 | 158510 | 1156.04 | 596 | 600 | 136.6 |
| C | 0 | 207 | 118019 | 859.61 | 596 | 600 | 136.6 |
| D | 8 | 195 | 784958 | 5011.51 | 582 | 570 | 156.5 |
| D | 1 | 47 | 294715 | 1879.31 | 582 | 570 | 156.5 |
| D | 2 | 31 | 283233 | 1805.95 | 582 | 570 | 156.5 |
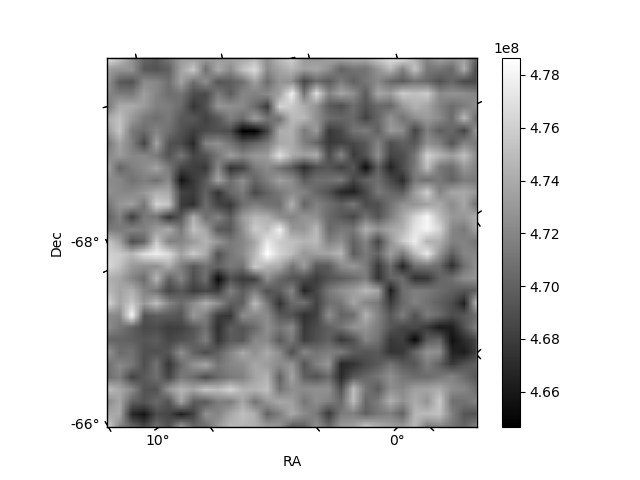
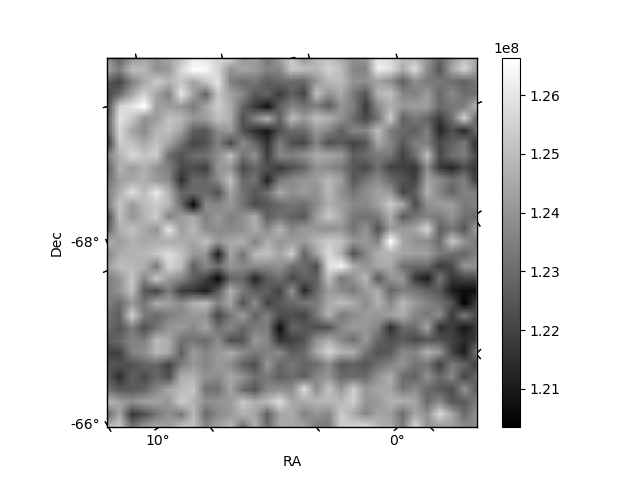
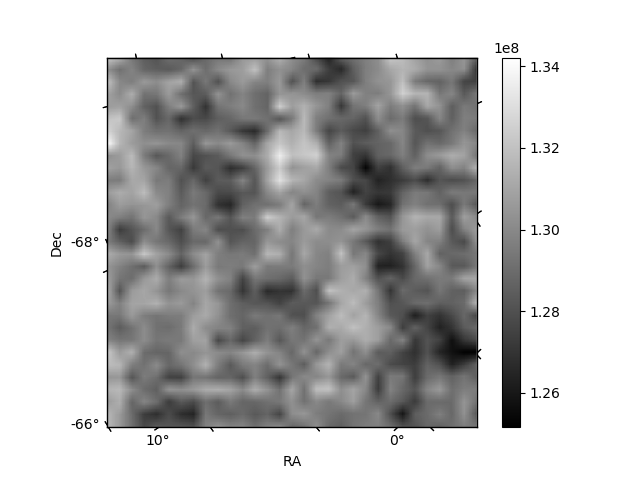
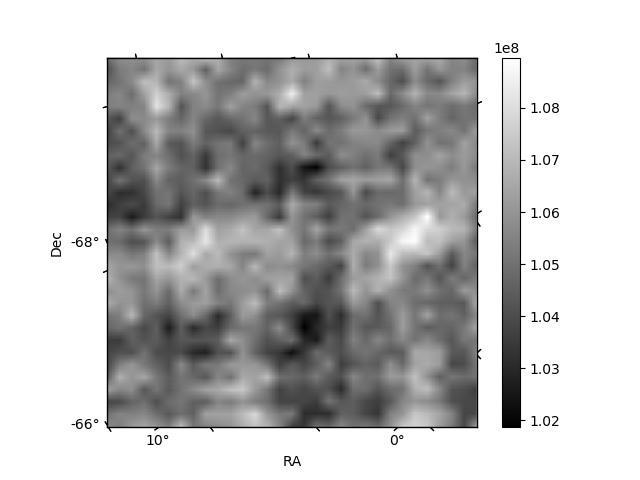
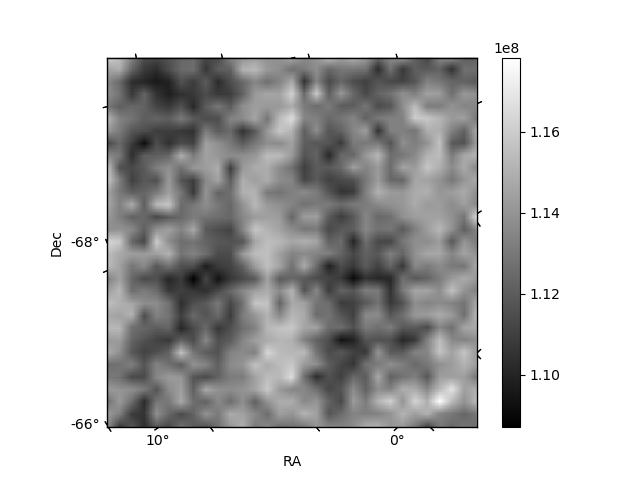
Histogram calculated using DETX and DETY for each event in the final _common_clean file
| Quadrant A | 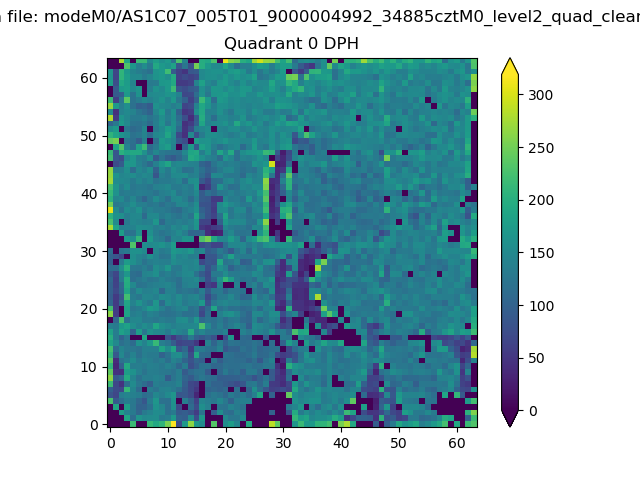 |
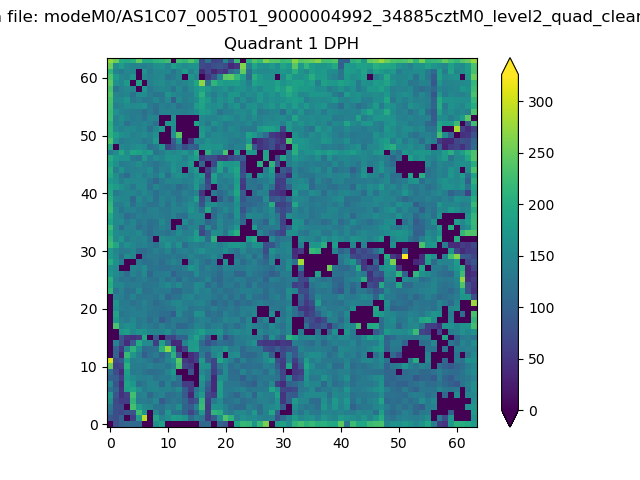 |
Quadrant B |
|---|---|---|---|
| Quadrant D | 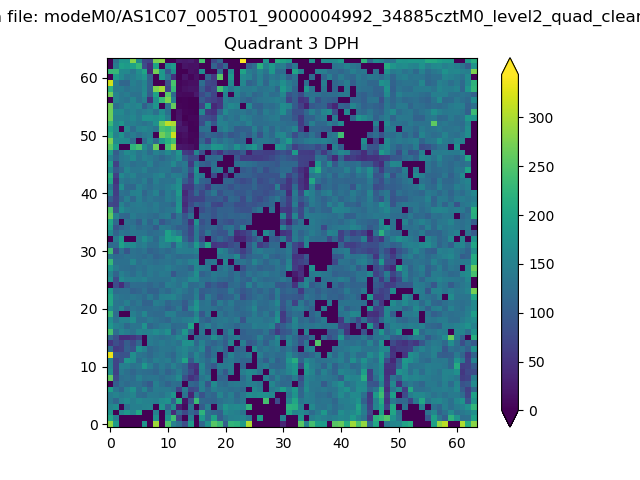 |
 |
Quadrant C |
| Plot type | Count rate plots | Images |
|---|---|---|
| Comparison with Poisson distribution Blue bars denote a histogram of data divided into 1 sec bins. Red curve is a Poisson curve with rate = median count rate of data. |
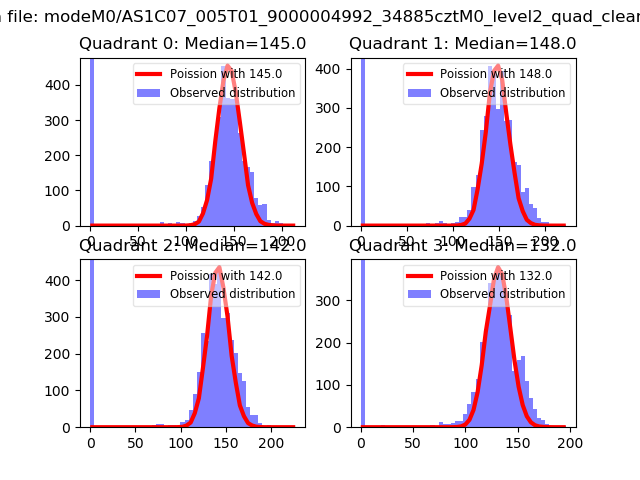 |
 |
| Quadrant-wise count rates Data is divided into 100 sec bins |
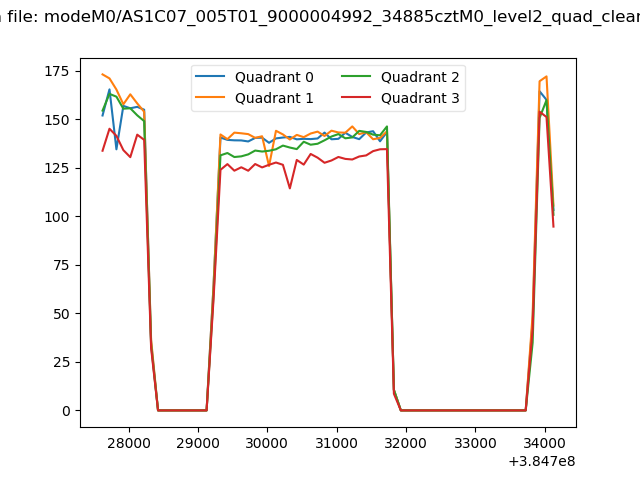 |
|
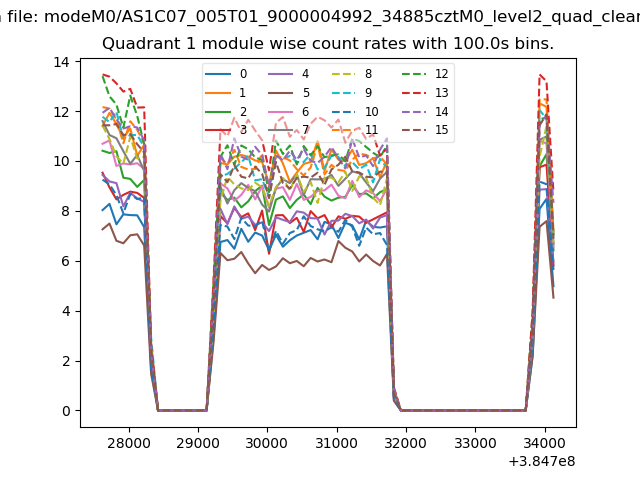
| Module-wise count rates for Quadrant A Data is divided into 100 sec bins |
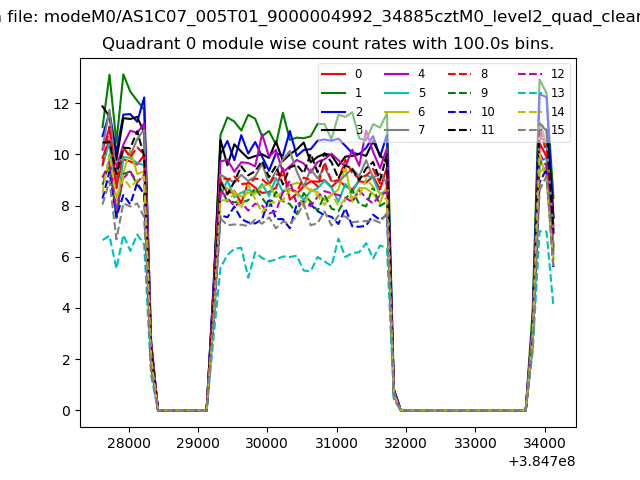 |
 |
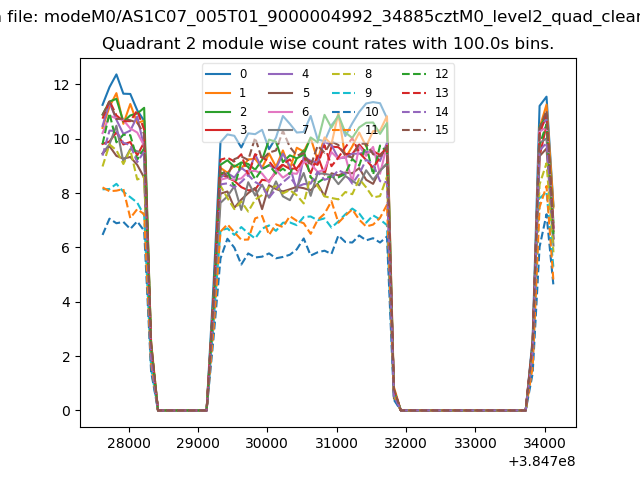
| Module-wise count rates for Quadrant B Data is divided into 100 sec bins |
 |
 |
| Module-wise count rates for Quadrant C Data is divided into 100 sec bins |
 |
 |
| Module-wise count rates for Quadrant D Data is divided into 100 sec bins |
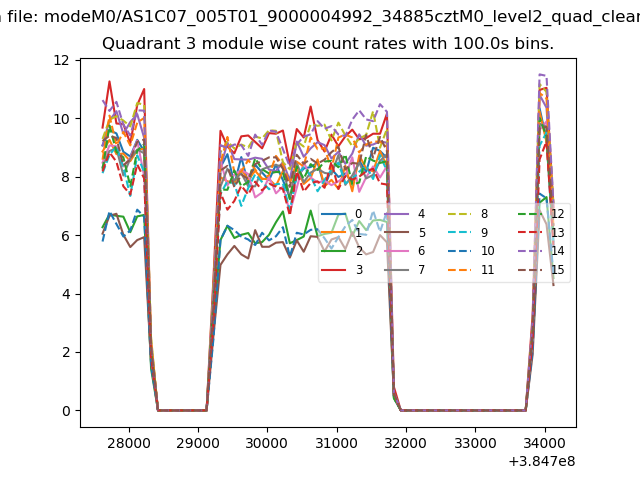 |
 |
| Parameter | Plot |
|---|---|
| CZT HV Monitor | 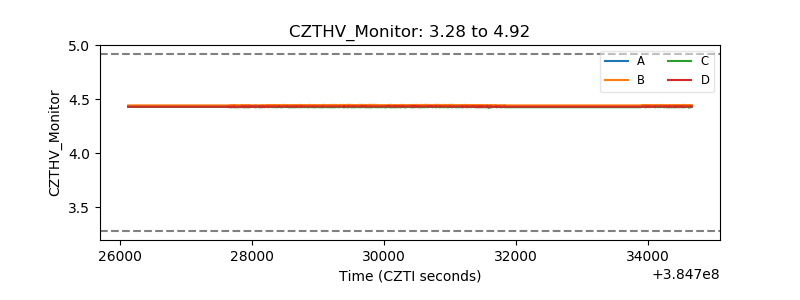 |
| D_VDD | 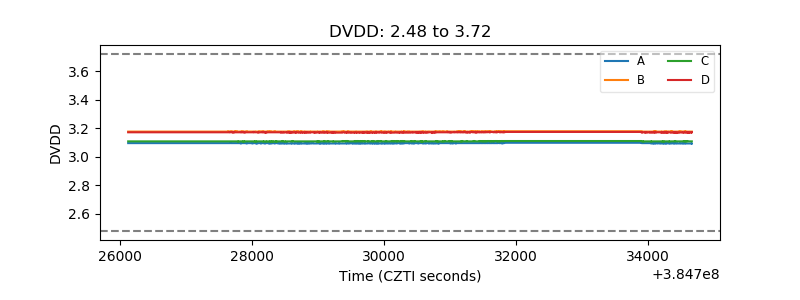 |
| Temperature 1 | 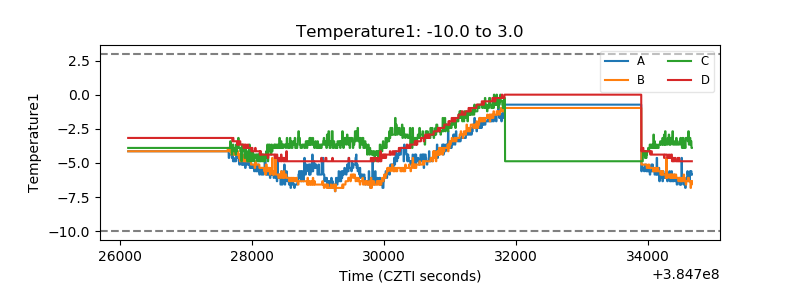 |
| Veto HV Monitor | 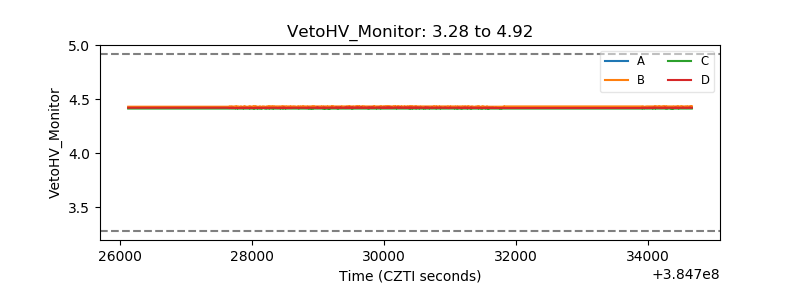 |
| Veto LLD | 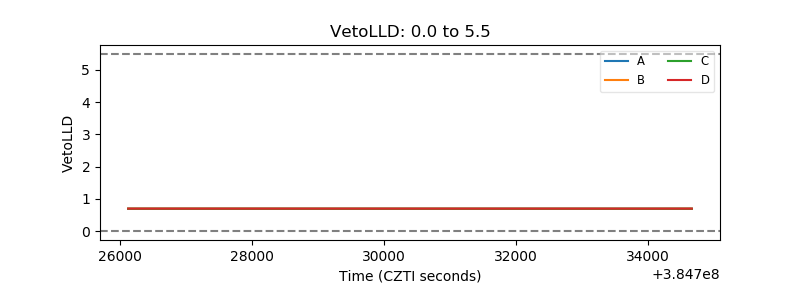 |
| Alpha Counter | 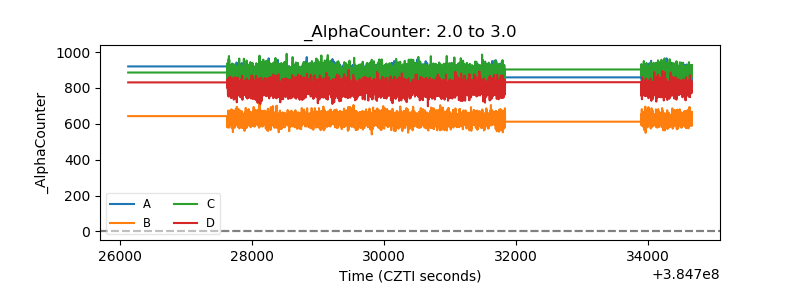 |
| _CPM_Rate | 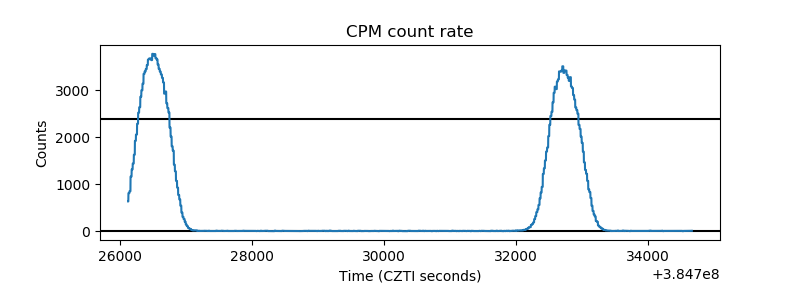 |
| CZT Counter | 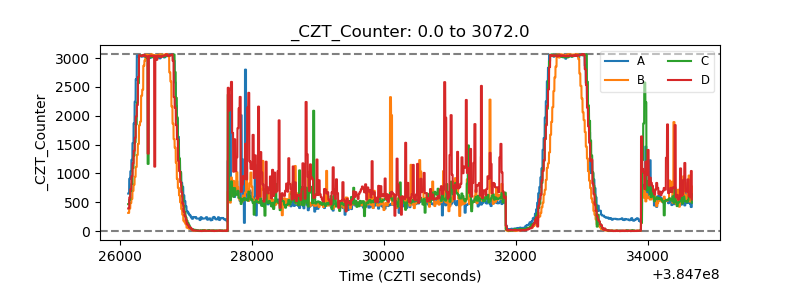 |
| +2.5 Volts monitor | 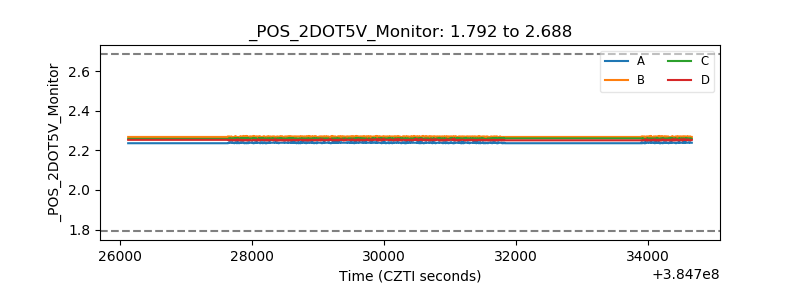 |
| +5 Volts monitor | 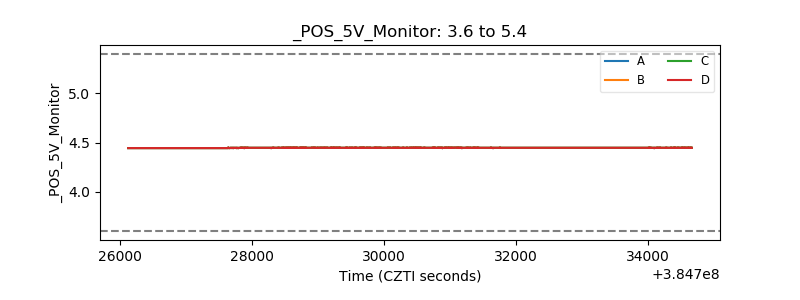 |
| _ROLL_ROT | 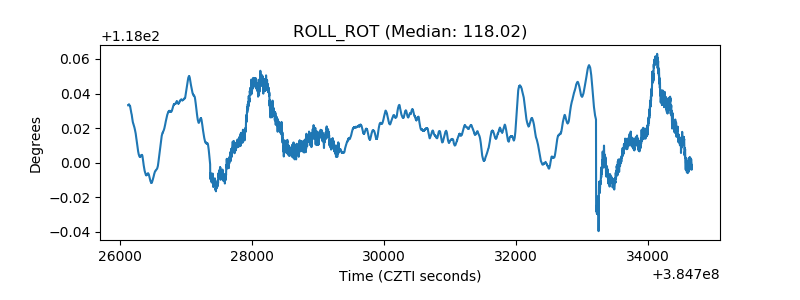 |
| _Roll_DEC | 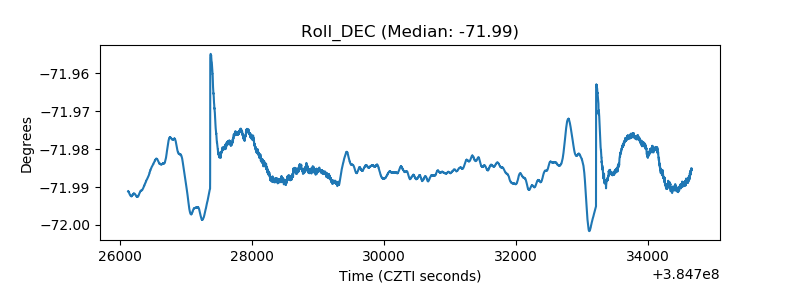 |
| _Roll_RA | 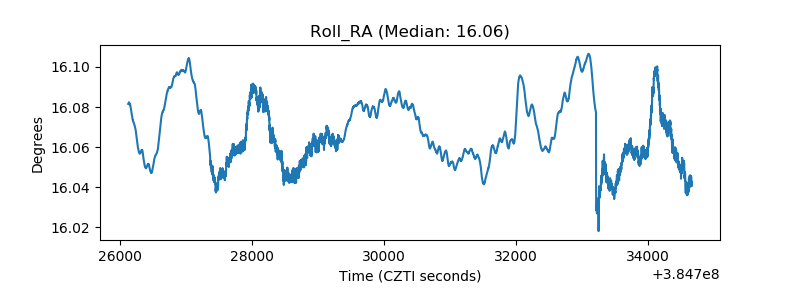 |
| Veto Counter | 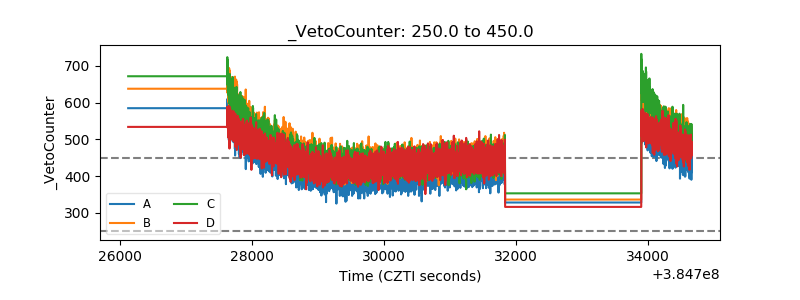 |