| Param | Original file | Final file |
|---|---|---|
| Filename | modeM0/AS1C07_005T01_9000004992_34879cztM0_level2.evt | modeM0/AS1C07_005T01_9000004992_34879cztM0_level2_quad_clean.evt |
| Size (bytes) | 1,329,863,040 | 242,326,080 |
| Size | 1.2 GB | 231.1 MB |
| Events in quadrant A | 7,985,972 | 1,593,648 |
| Events in quadrant B | 10,172,316 | 1,577,347 |
| Events in quadrant C | 9,047,244 | 1,579,470 |
| Events in quadrant D | 12,010,129 | 1,505,147 |
| Mode M9 | |||
|---|---|---|---|
| Quadrant | BADHDUFLAG | Total packets | Discarded packets |
| A | 0 | 44 | 0 |
| B | 0 | 44 | 0 |
| C | 0 | 44 | 0 |
| D | 0 | 45 | 0 |
| Mode M0 | |||
|---|---|---|---|
| Quadrant | BADHDUFLAG | Total packets | Discarded packets |
| A | 0 | 33954 | 5 |
| B | 0 | 40377 | 4 |
| C | 0 | 36651 | 4 |
| D | 0 | 46913 | 4 |
| Mode SS | |||
|---|---|---|---|
| Quadrant | BADHDUFLAG | Total packets | Discarded packets |
| A | 0 | 320 | 0 |
| B | 0 | 320 | 0 |
| C | 0 | 320 | 0 |
| D | 0 | 320 | 0 |
| Quadrant | Total seconds | Saturated seconds | Saturation percentage |
|---|---|---|---|
| A | 15711 | 190 | 1.209344% |
| B | 15711 | 781 | 4.971039% |
| C | 15711 | 364 | 2.316848% |
| D | 15711 | 507 | 3.227038% |
Noise dominated data is calculated using 1-second bins in cleaned event files. If a bin has >2000 counts, and if more than 50% of those come from <1% of pixels, then it is considered to be noise-dominated and hence unusable.
| Quadrant | # 1 sec bins | Bins with >0 counts | Bins with >2000 counts | High rate bins dominated by noise | Noise dominated (total time) | Noise dominated (detector-on time) | Marked lightcurve |
|---|---|---|---|---|---|---|---|
| A | 19800 | 15714 | 153 | 153 | 0.77% | 0.97% | 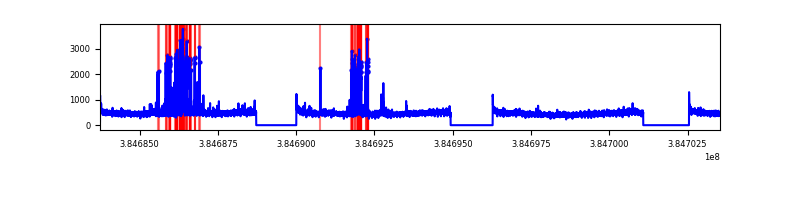 |
| B | 19800 | 15714 | 594 | 594 | 3.00% | 3.78% | 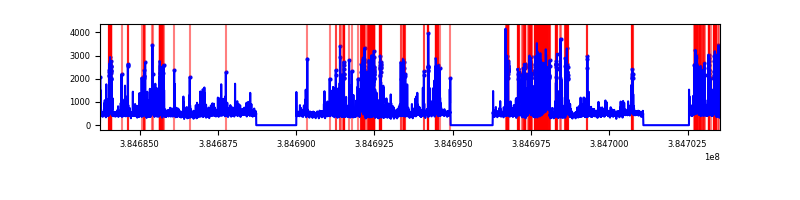 |
| C | 19800 | 15713 | 314 | 314 | 1.59% | 2.00% | 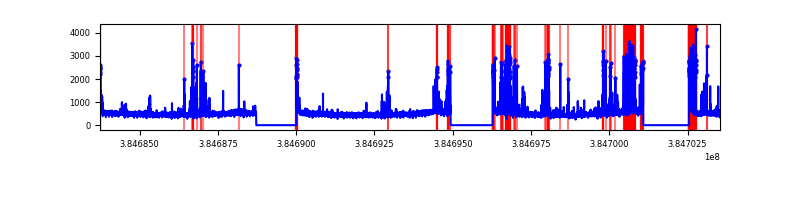 |
| D | 19800 | 15714 | 438 | 438 | 2.21% | 2.79% | 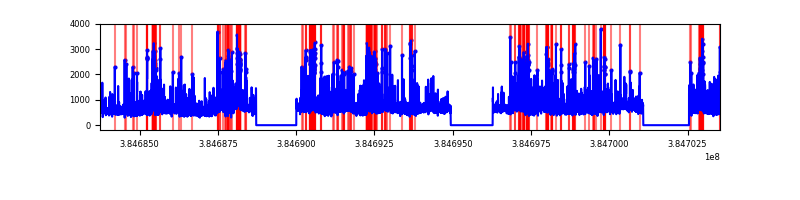 |
Top three noisy pixels from each quadrant. If the there are fewer than three noisy pixels in the level2.evt file, extra rows are filled as -1
| Pixel properties | Quadrant properties | ||||||
|---|---|---|---|---|---|---|---|
| Quadrant | DetID | PixID | Counts | Sigma | Mean | Median | Sigma |
| A | 15 | 237 | 685761 | 1899.08 | 1793 | 1757 | 360.2 |
| A | 15 | 169 | 130238 | 356.72 | 1793 | 1757 | 360.2 |
| A | 10 | 83 | 129267 | 354.02 | 1793 | 1757 | 360.2 |
| B | 5 | 172 | 2318195 | 6908.01 | 1759 | 1714 | 335.3 |
| B | 0 | 190 | 362360 | 1075.49 | 1759 | 1714 | 335.3 |
| B | 5 | 200 | 152887 | 450.81 | 1759 | 1714 | 335.3 |
| C | 0 | 207 | 1193021 | 3007.26 | 1722 | 1735 | 396.1 |
| C | 15 | 214 | 705341 | 1776.17 | 1722 | 1735 | 396.1 |
| C | 0 | 10 | 217640 | 545.03 | 1722 | 1735 | 396.1 |
| D | 8 | 195 | 2460971 | 5842.95 | 1724 | 1678 | 420.9 |
| D | 10 | 118 | 746952 | 1770.67 | 1724 | 1678 | 420.9 |
| D | 2 | 31 | 663429 | 1572.23 | 1724 | 1678 | 420.9 |
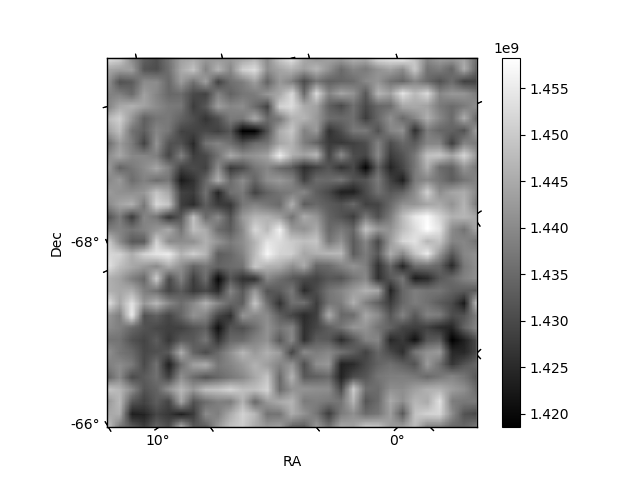
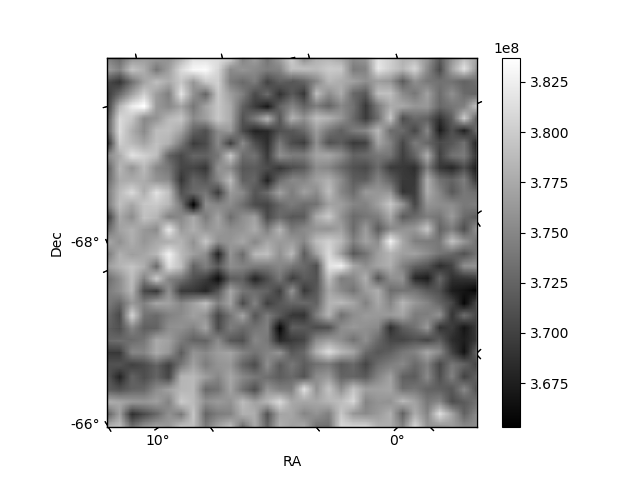
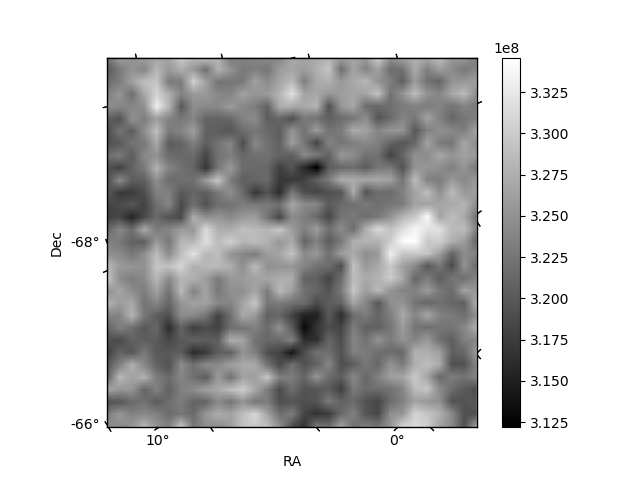
Histogram calculated using DETX and DETY for each event in the final _common_clean file
| Quadrant A | 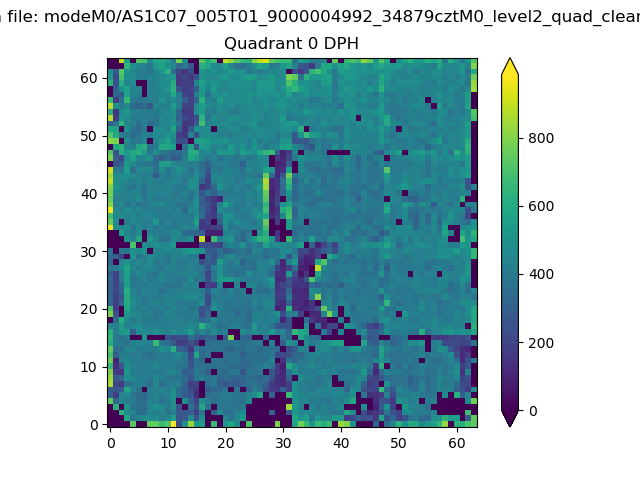 |
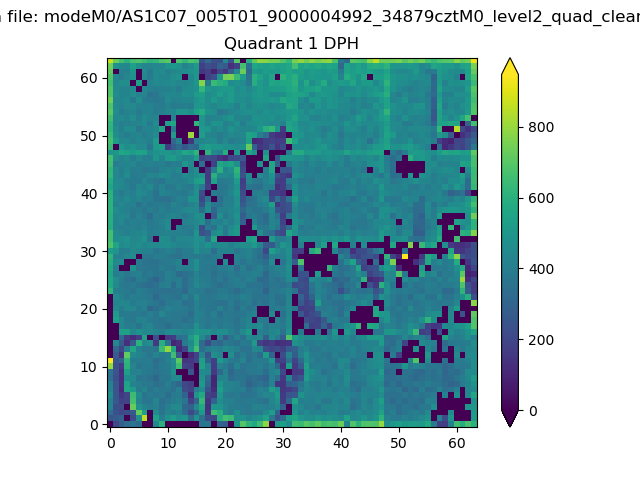 |
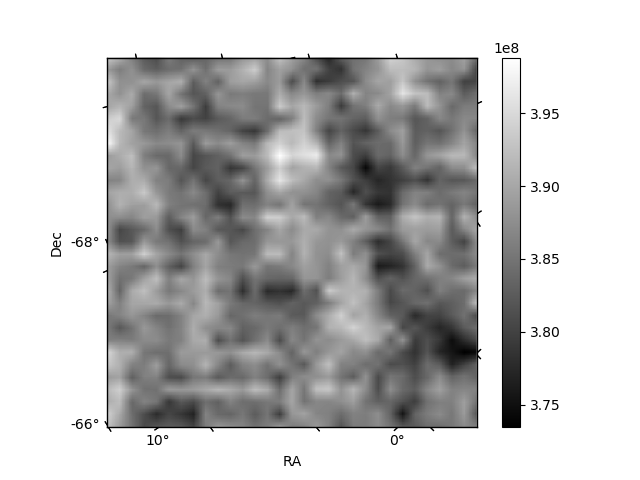
Quadrant B |
|---|---|---|---|
| Quadrant D | 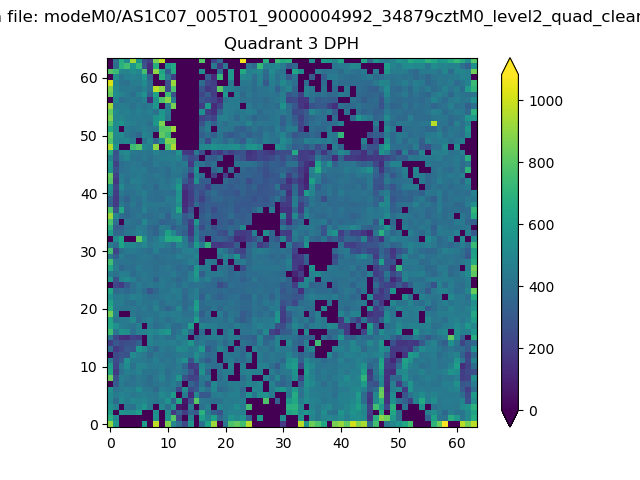 |
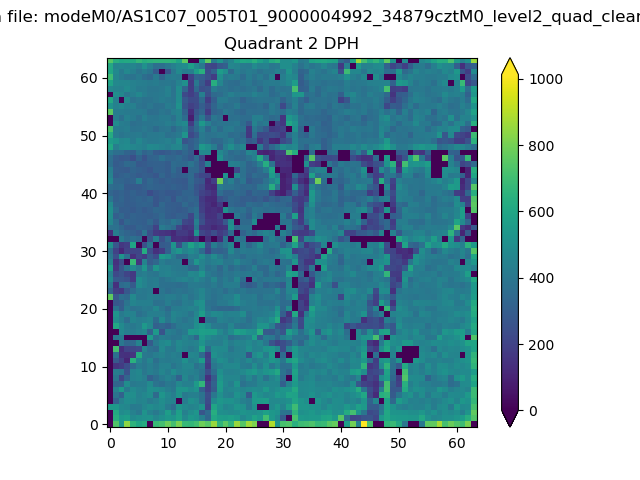 |
Quadrant C |
| Plot type | Count rate plots | Images |
|---|---|---|
| Comparison with Poisson distribution Blue bars denote a histogram of data divided into 1 sec bins. Red curve is a Poisson curve with rate = median count rate of data. |
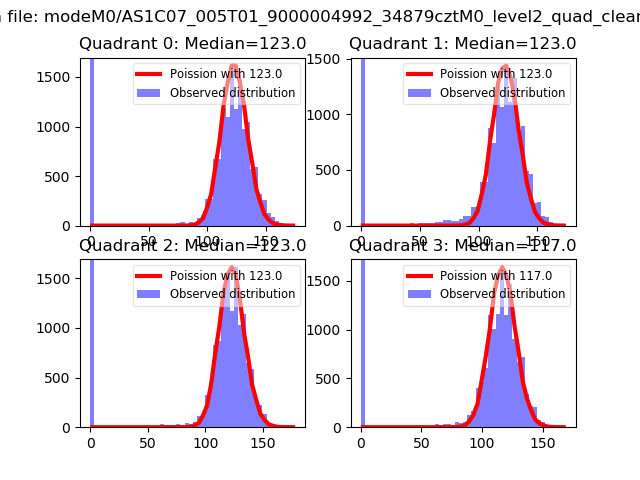 |
 |
| Quadrant-wise count rates Data is divided into 100 sec bins |
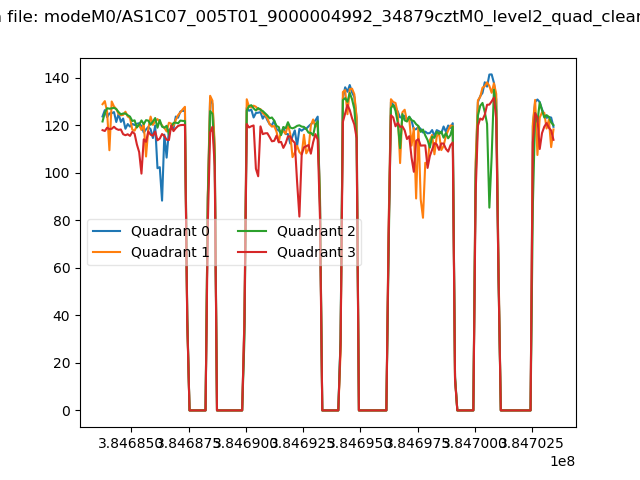 |
|
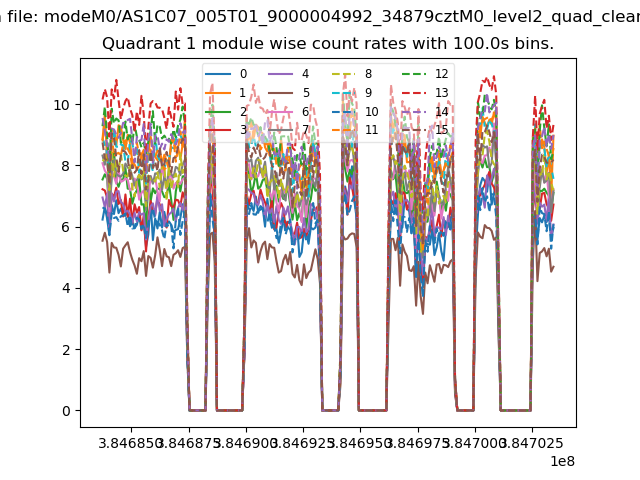
| Module-wise count rates for Quadrant A Data is divided into 100 sec bins |
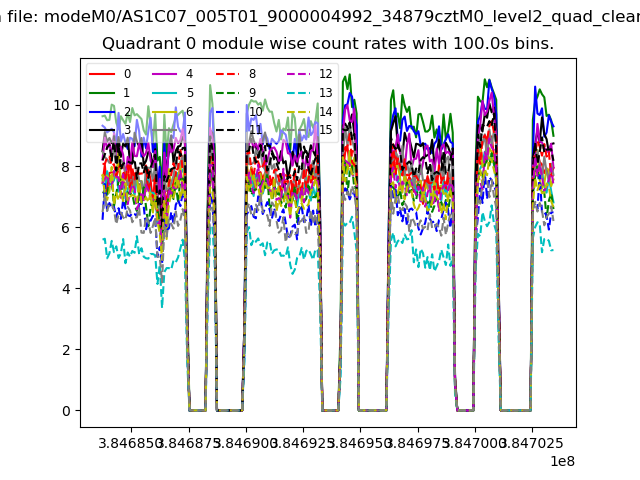 |
 |
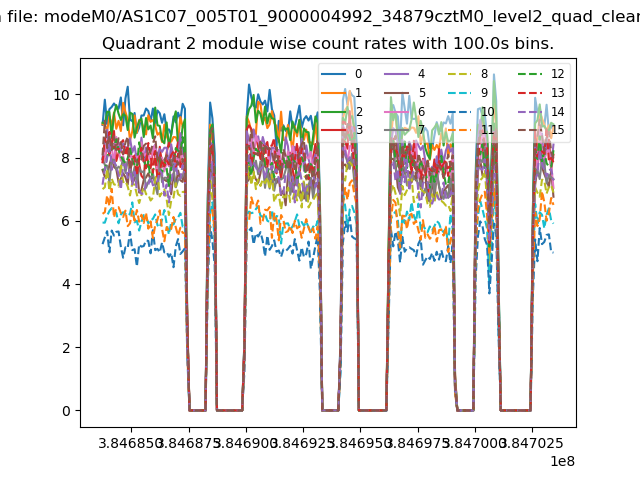
| Module-wise count rates for Quadrant B Data is divided into 100 sec bins |
 |
 |
| Module-wise count rates for Quadrant C Data is divided into 100 sec bins |
 |
 |
| Module-wise count rates for Quadrant D Data is divided into 100 sec bins |
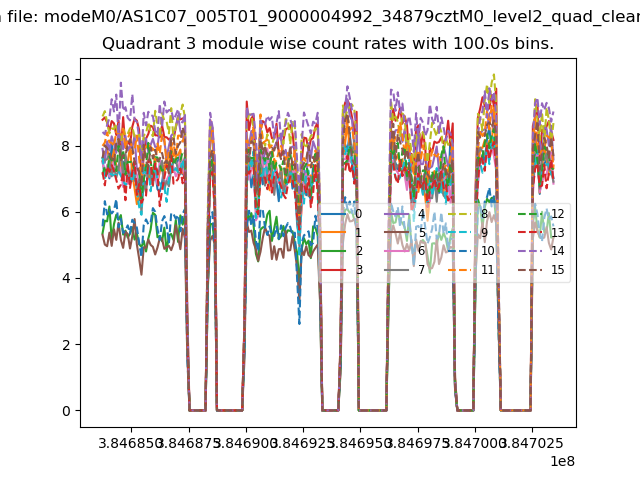 |
 |
| Parameter | Plot |
|---|---|
| CZT HV Monitor | 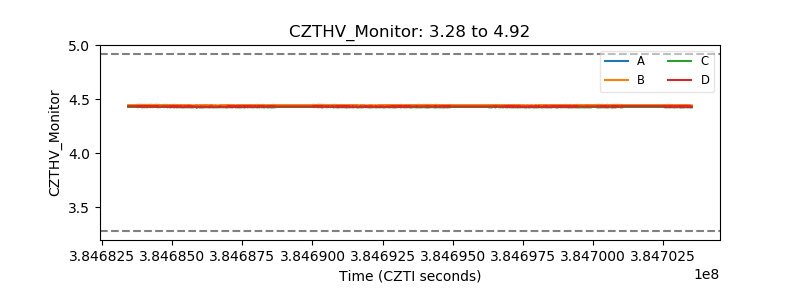 |
| D_VDD | 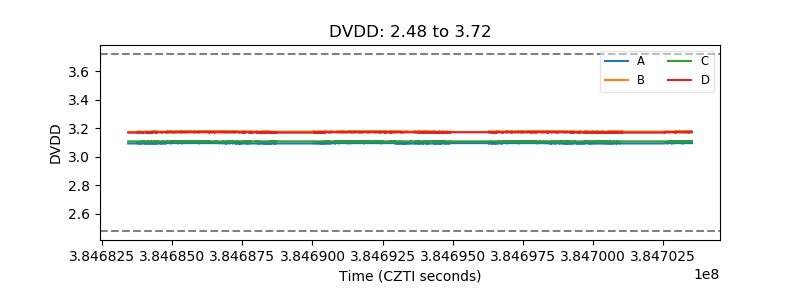 |
| Temperature 1 | 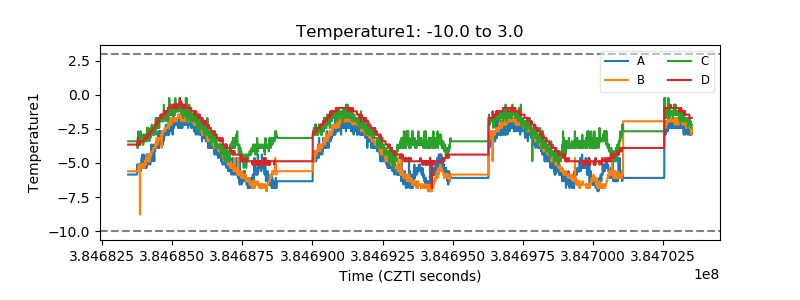 |
| Veto HV Monitor | 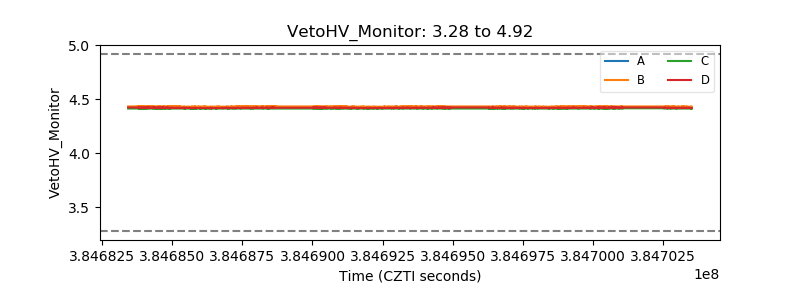 |
| Veto LLD | 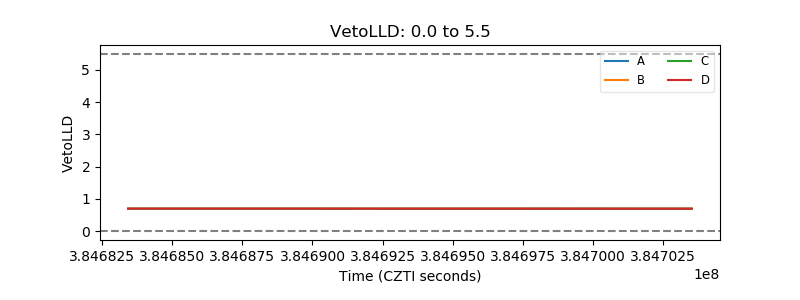 |
| Alpha Counter | 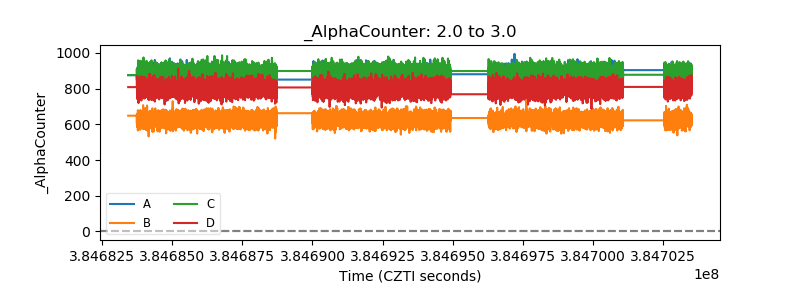 |
| _CPM_Rate | 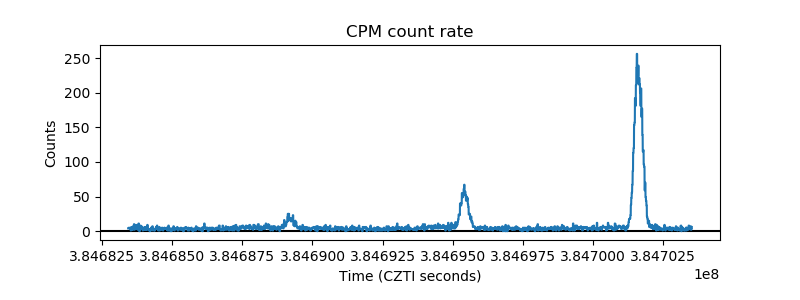 |
| CZT Counter | 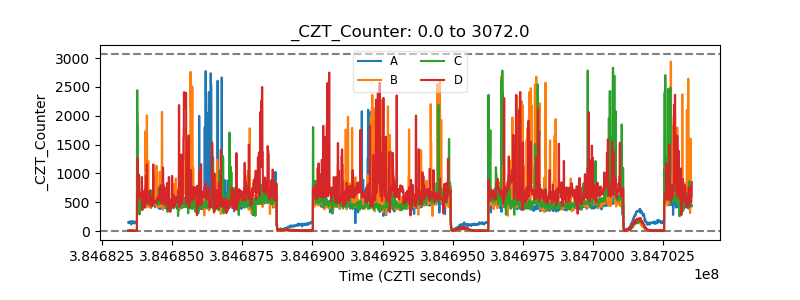 |
| +2.5 Volts monitor | 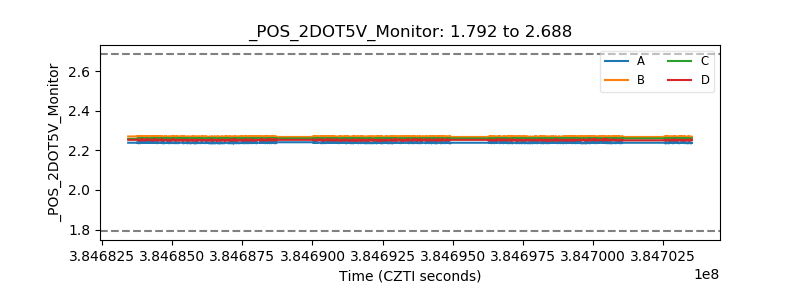 |
| +5 Volts monitor | 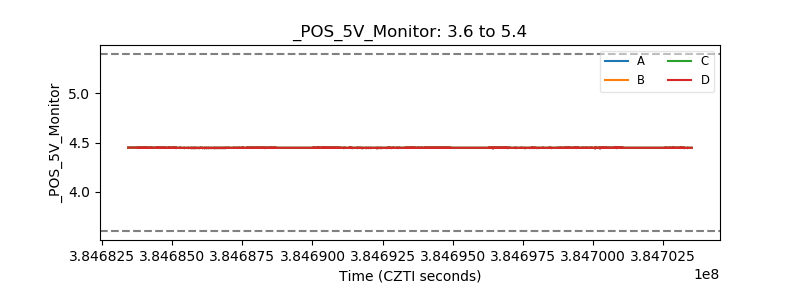 |
| _ROLL_ROT | 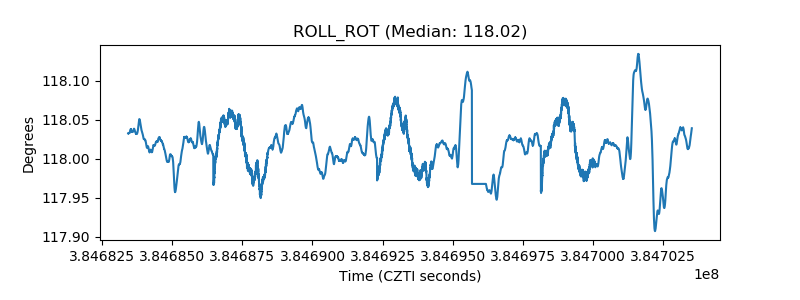 |
| _Roll_DEC | 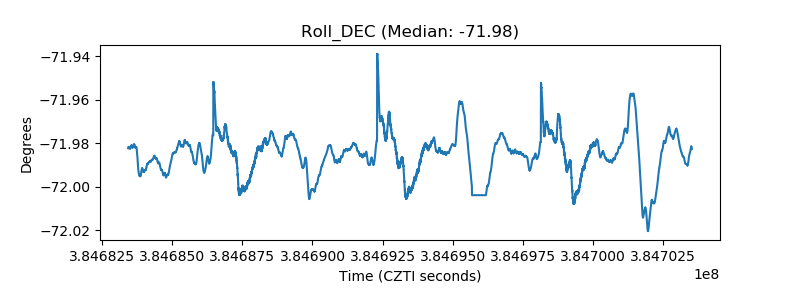 |
| _Roll_RA | 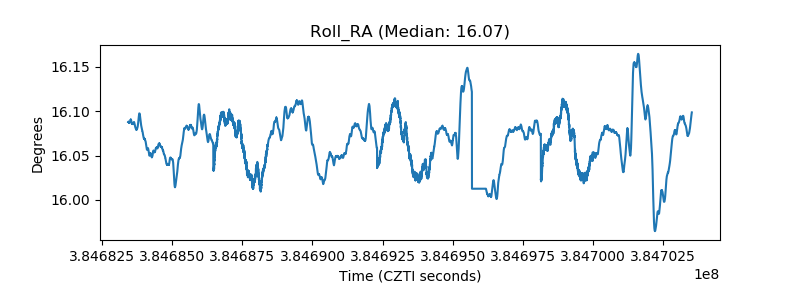 |
| Veto Counter | 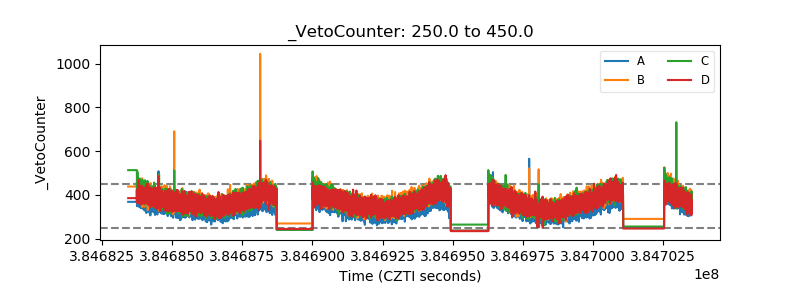 |