| Param | Original file | Final file |
|---|---|---|
| Filename | modeM0/AS1C07_005T01_9000004992_34875cztM0_level2.evt | modeM0/AS1C07_005T01_9000004992_34875cztM0_level2_quad_clean.evt |
| Size (bytes) | 469,601,280 | 101,082,240 |
| Size | 447.8 MB | 96.4 MB |
| Events in quadrant A | 3,111,193 | 674,509 |
| Events in quadrant B | 3,265,836 | 682,638 |
| Events in quadrant C | 3,110,104 | 678,618 |
| Events in quadrant D | 4,353,570 | 632,669 |
| Mode M9 | |||
|---|---|---|---|
| Quadrant | BADHDUFLAG | Total packets | Discarded packets |
| A | 0 | 18 | 0 |
| B | 0 | 18 | 0 |
| C | 0 | 18 | 0 |
| D | 0 | 19 | 0 |
| Mode M0 | |||
|---|---|---|---|
| Quadrant | BADHDUFLAG | Total packets | Discarded packets |
| A | 0 | 12900 | 3 |
| B | 0 | 13329 | 2 |
| C | 0 | 12503 | 2 |
| D | 0 | 16516 | 2 |
| Mode SS | |||
|---|---|---|---|
| Quadrant | BADHDUFLAG | Total packets | Discarded packets |
| A | 0 | 112 | 0 |
| B | 0 | 112 | 0 |
| C | 0 | 112 | 0 |
| D | 0 | 112 | 0 |
| Quadrant | Total seconds | Saturated seconds | Saturation percentage |
|---|---|---|---|
| A | 5623 | 136 | 2.418638% |
| B | 5623 | 159 | 2.827672% |
| C | 5623 | 76 | 1.351592% |
| D | 5623 | 206 | 3.663525% |
Noise dominated data is calculated using 1-second bins in cleaned event files. If a bin has >2000 counts, and if more than 50% of those come from <1% of pixels, then it is considered to be noise-dominated and hence unusable.
| Quadrant | # 1 sec bins | Bins with >0 counts | Bins with >2000 counts | High rate bins dominated by noise | Noise dominated (total time) | Noise dominated (detector-on time) | Marked lightcurve |
|---|---|---|---|---|---|---|---|
| A | 7086 | 5624 | 93 | 93 | 1.31% | 1.65% | 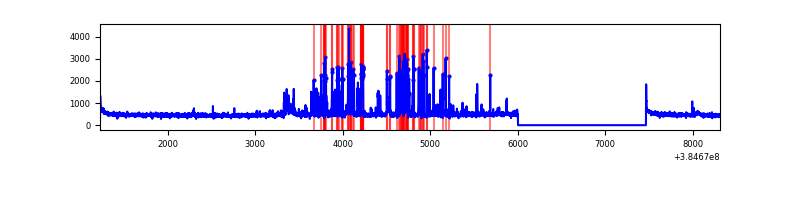 |
| B | 7086 | 5624 | 74 | 74 | 1.04% | 1.32% | 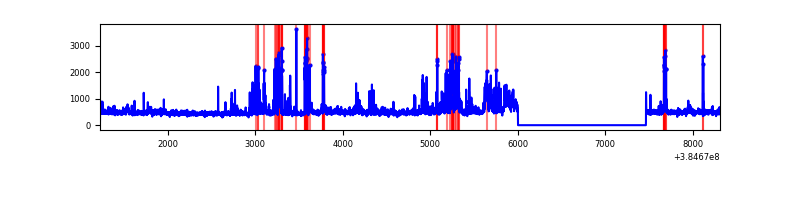 |
| C | 7086 | 5624 | 64 | 64 | 0.90% | 1.14% | 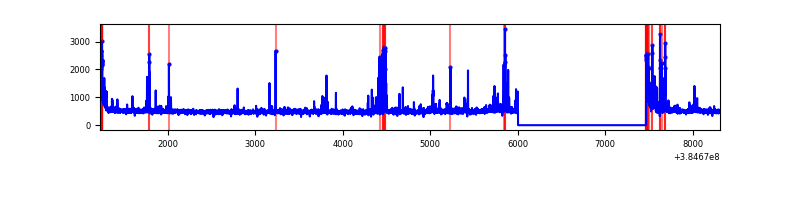 |
| D | 7086 | 5624 | 187 | 187 | 2.64% | 3.33% | 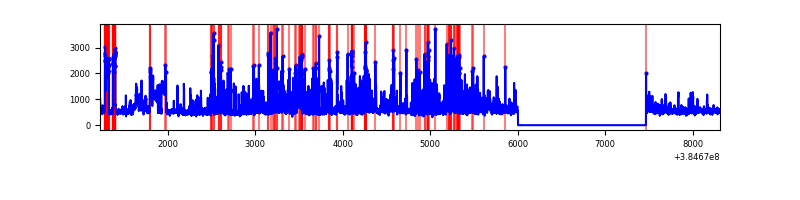 |
Top three noisy pixels from each quadrant. If the there are fewer than three noisy pixels in the level2.evt file, extra rows are filled as -1
| Pixel properties | Quadrant properties | ||||||
|---|---|---|---|---|---|---|---|
| Quadrant | DetID | PixID | Counts | Sigma | Mean | Median | Sigma |
| A | 15 | 237 | 467261 | 3642.36 | 640 | 627 | 128.1 |
| A | 15 | 169 | 80770 | 625.56 | 640 | 627 | 128.1 |
| A | 10 | 83 | 57025 | 440.22 | 640 | 627 | 128.1 |
| B | 5 | 172 | 334148 | 2780.11 | 636 | 620 | 120.0 |
| B | 0 | 190 | 121738 | 1009.58 | 636 | 620 | 120.0 |
| B | 0 | 246 | 101864 | 843.92 | 636 | 620 | 120.0 |
| C | 15 | 214 | 259939 | 1785.84 | 627 | 631 | 145.2 |
| C | 0 | 207 | 254492 | 1748.33 | 627 | 631 | 145.2 |
| C | 0 | 10 | 131302 | 899.92 | 627 | 631 | 145.2 |
| D | 8 | 195 | 923376 | 6117.54 | 619 | 603 | 150.8 |
| D | 13 | 249 | 501842 | 3322.97 | 619 | 603 | 150.8 |
| D | 12 | 6 | 100376 | 661.45 | 619 | 603 | 150.8 |
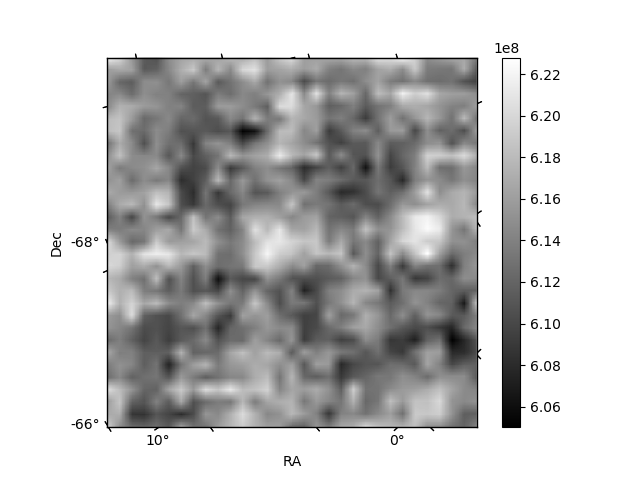
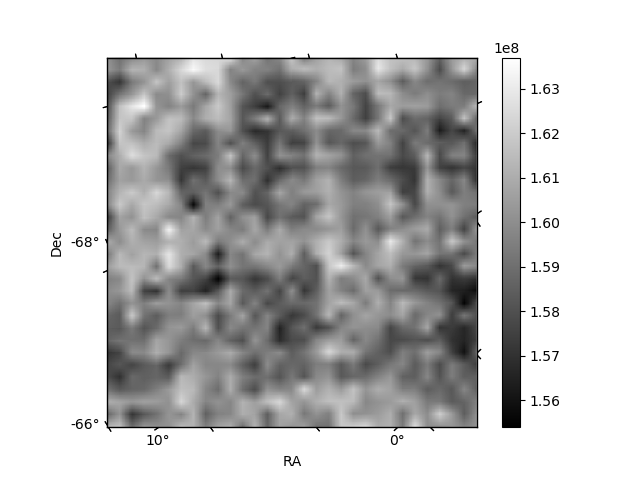
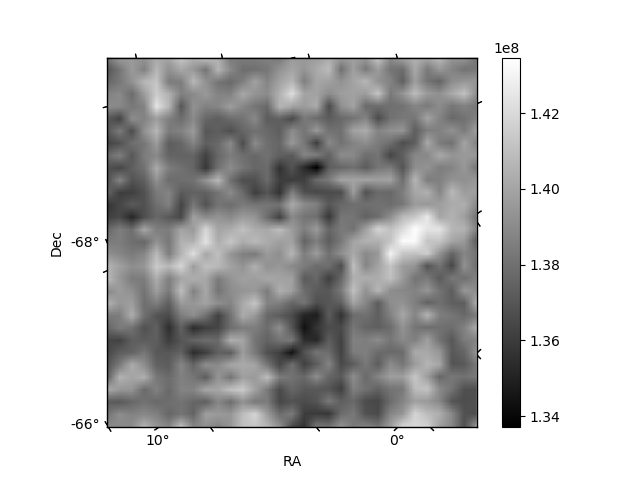
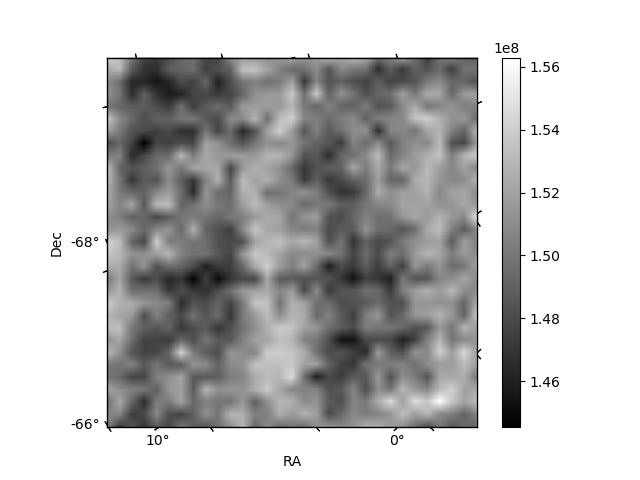
Histogram calculated using DETX and DETY for each event in the final _common_clean file
| Quadrant A | 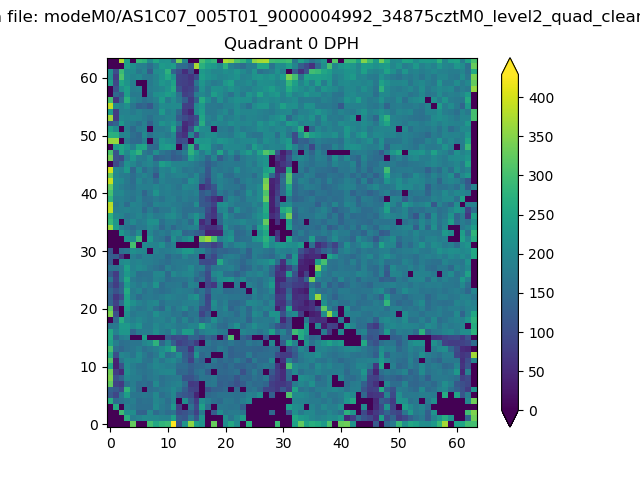 |
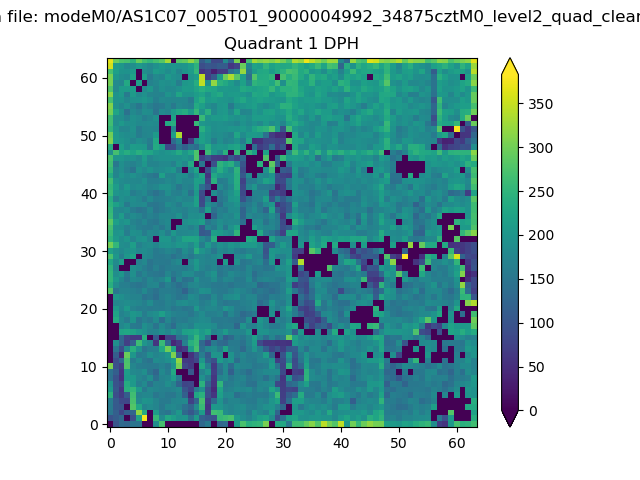 |
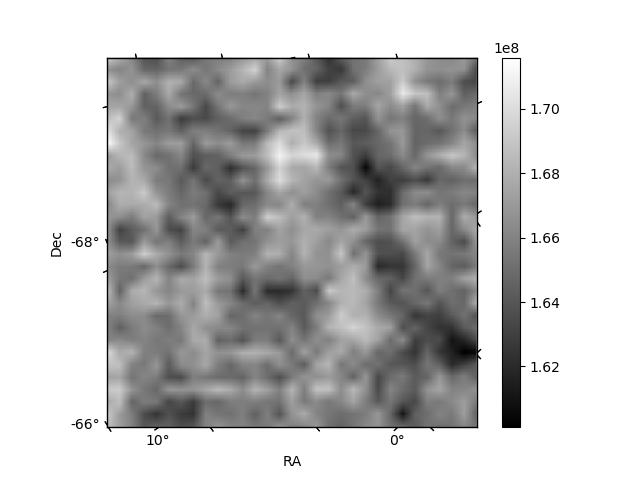
Quadrant B |
|---|---|---|---|
| Quadrant D | 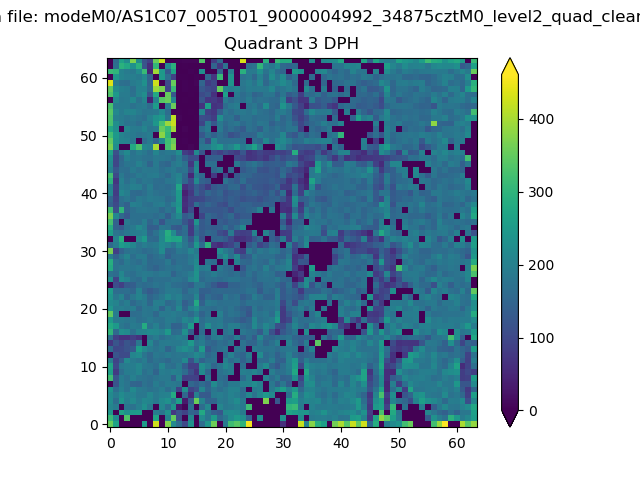 |
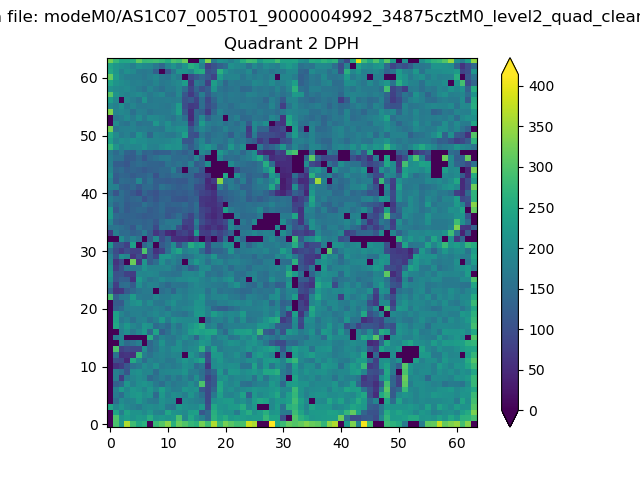 |
Quadrant C |
| Plot type | Count rate plots | Images |
|---|---|---|
| Comparison with Poisson distribution Blue bars denote a histogram of data divided into 1 sec bins. Red curve is a Poisson curve with rate = median count rate of data. |
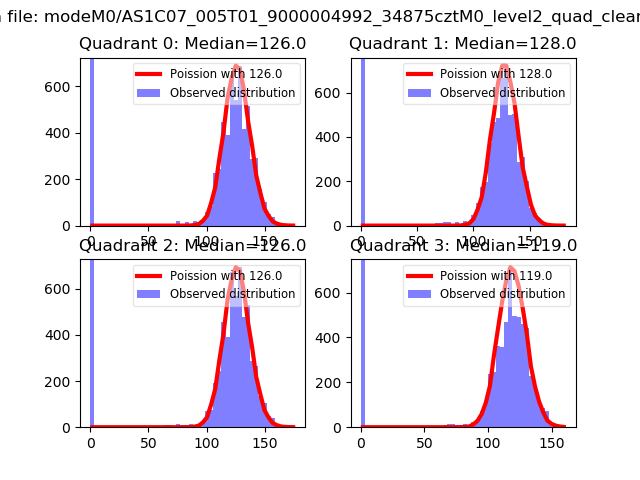 |
 |
| Quadrant-wise count rates Data is divided into 100 sec bins |
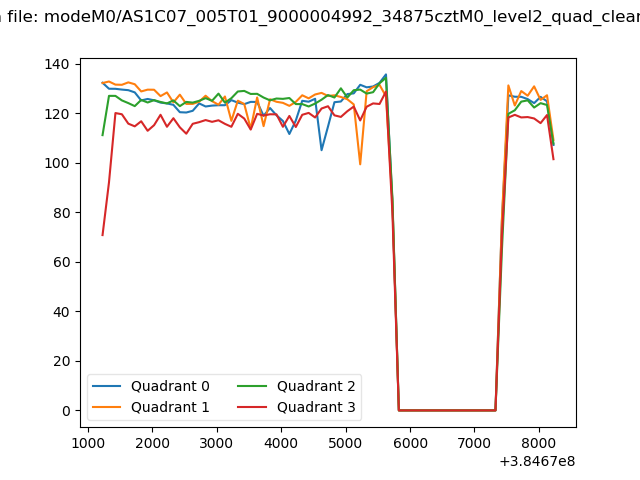 |
|
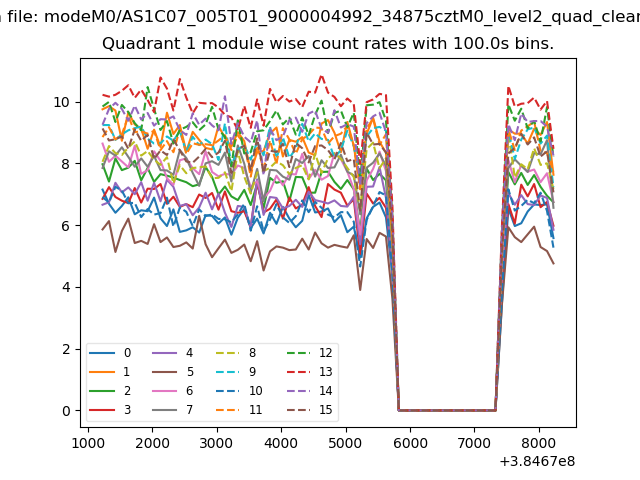
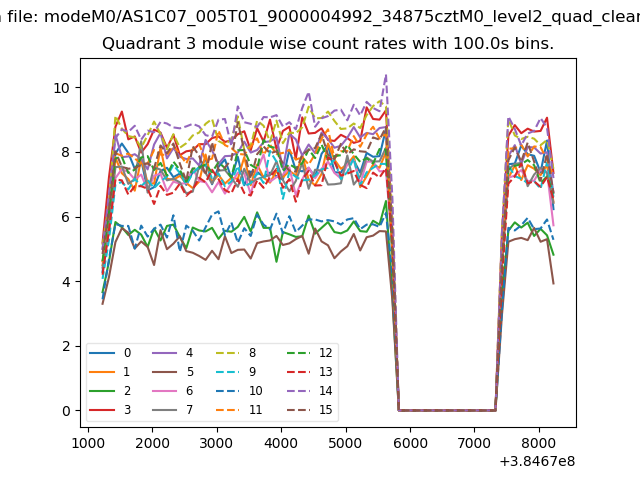
| Module-wise count rates for Quadrant A Data is divided into 100 sec bins |
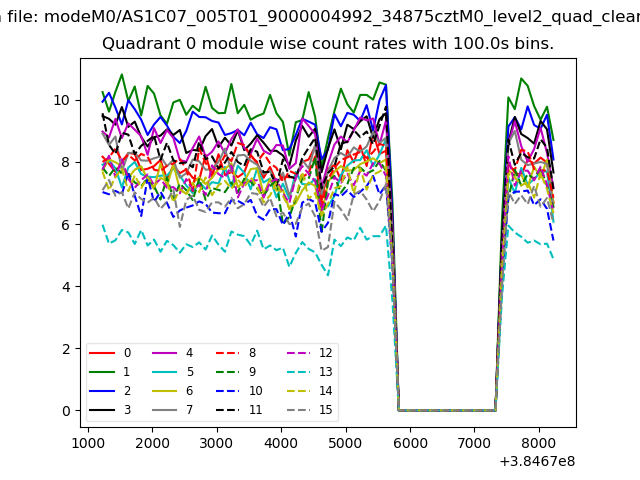 |
 |
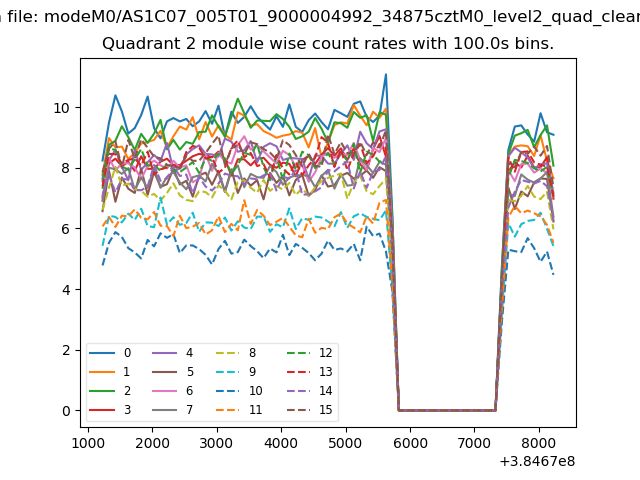
| Module-wise count rates for Quadrant B Data is divided into 100 sec bins |
 |
 |
| Module-wise count rates for Quadrant C Data is divided into 100 sec bins |
 |
 |
| Module-wise count rates for Quadrant D Data is divided into 100 sec bins |
 |
 |
| Parameter | Plot |
|---|---|
| CZT HV Monitor |  |
| D_VDD | 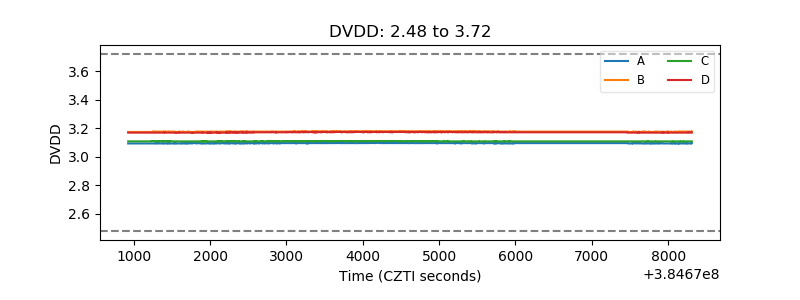 |
| Temperature 1 | 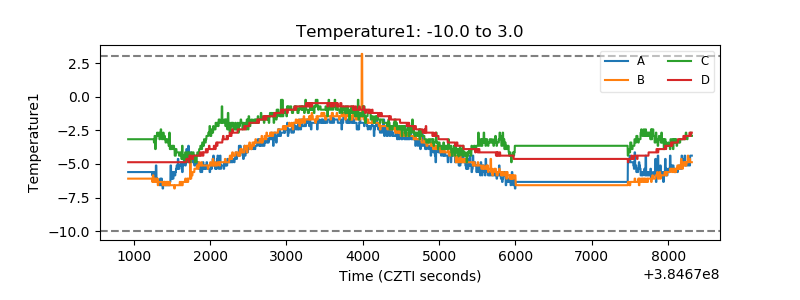 |
| Veto HV Monitor | 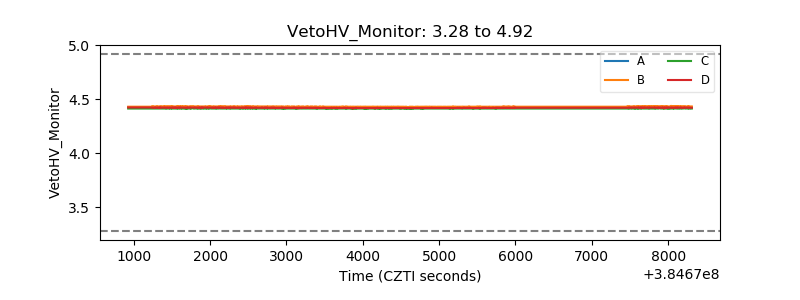 |
| Veto LLD | 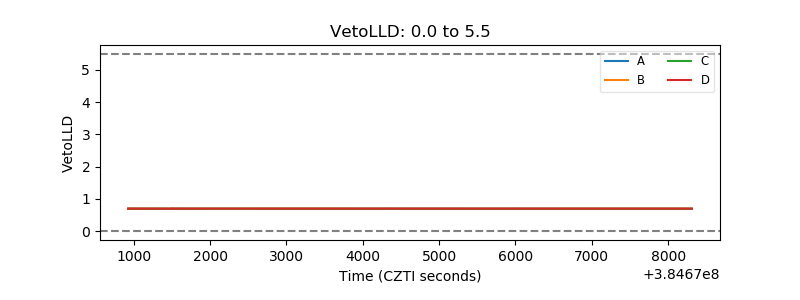 |
| Alpha Counter | 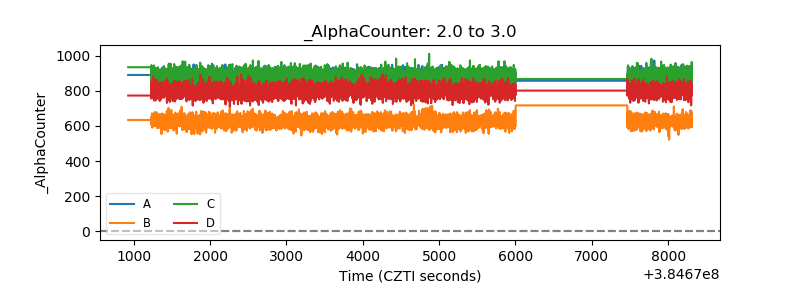 |
| _CPM_Rate | 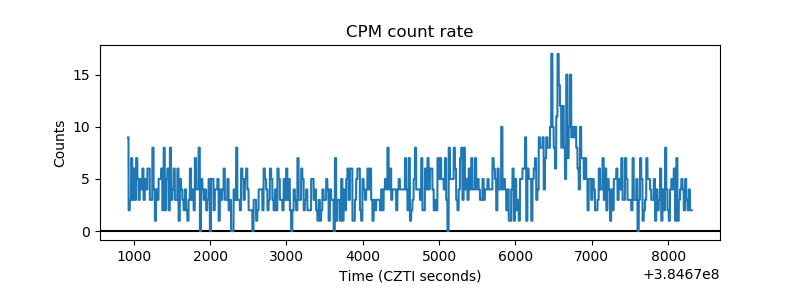 |
| CZT Counter | 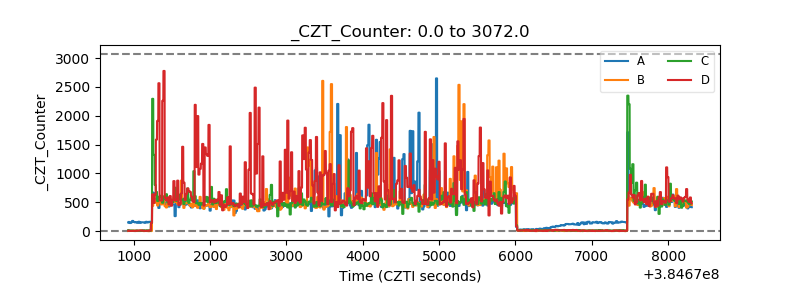 |
| +2.5 Volts monitor | 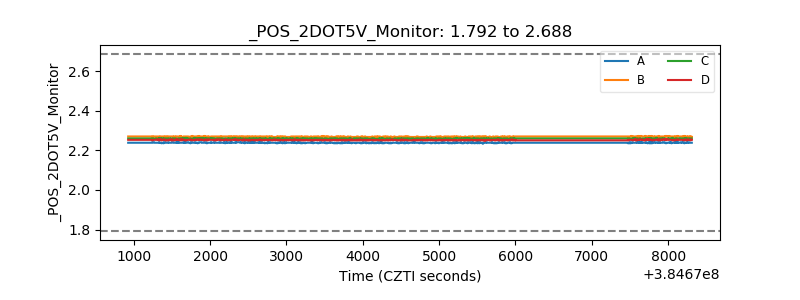 |
| +5 Volts monitor | 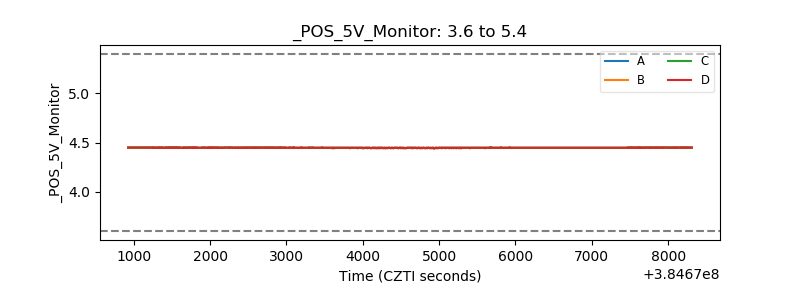 |
| _ROLL_ROT | 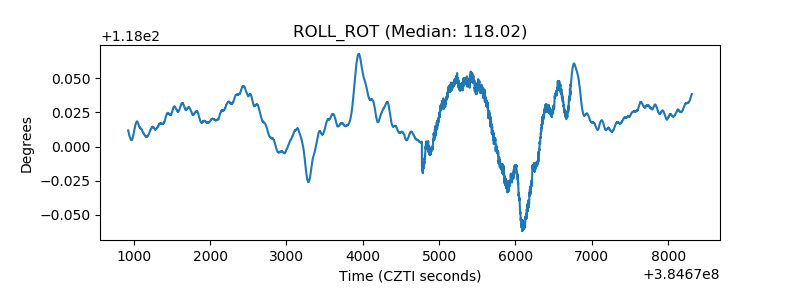 |
| _Roll_DEC | 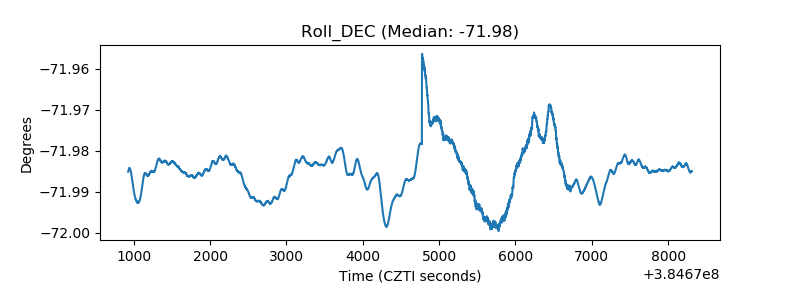 |
| _Roll_RA | 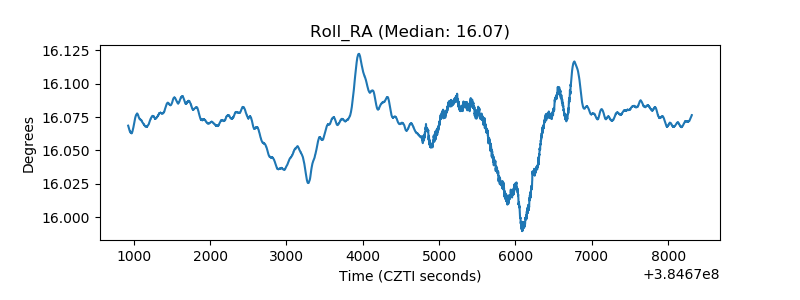 |
| Veto Counter | 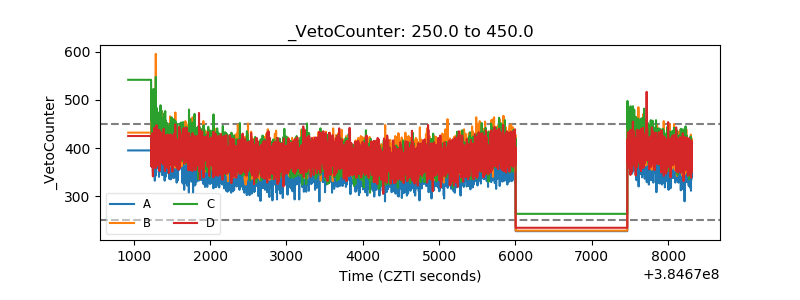 |