| Param | Original file | Final file |
|---|---|---|
| Filename | modeM0/AS1C07_005T01_9000004992_34860cztM0_level2.evt | modeM0/AS1C07_005T01_9000004992_34860cztM0_level2_quad_clean.evt |
| Size (bytes) | 1,079,406,720 | 82,157,760 |
| Size | 1.0 GB | 78.4 MB |
| Events in quadrant A | 9,809,563 | 566,711 |
| Events in quadrant B | 14,107,580 | 236,030 |
| Events in quadrant C | 4,369,189 | 653,455 |
| Events in quadrant D | 4,039,905 | 647,604 |
| Mode M9 | |||
|---|---|---|---|
| Quadrant | BADHDUFLAG | Total packets | Discarded packets |
| A | 0 | 16 | 0 |
| B | 0 | 16 | 0 |
| C | 0 | 16 | 0 |
| D | 0 | 17 | 0 |
| Mode M0 | |||
|---|---|---|---|
| Quadrant | BADHDUFLAG | Total packets | Discarded packets |
| A | 0 | 32875 | 3 |
| B | 0 | 45606 | 2 |
| C | 0 | 16234 | 2 |
| D | 0 | 15654 | 2 |
| Mode SS | |||
|---|---|---|---|
| Quadrant | BADHDUFLAG | Total packets | Discarded packets |
| A | 0 | 110 | 0 |
| B | 0 | 110 | 0 |
| C | 0 | 110 | 0 |
| D | 0 | 110 | 0 |
| Quadrant | Total seconds | Saturated seconds | Saturation percentage |
|---|---|---|---|
| A | 5431 | 2545 | 46.860615% |
| B | 5431 | 5379 | 99.042534% |
| C | 5431 | 523 | 9.629902% |
| D | 5431 | 207 | 3.811453% |
Noise dominated data is calculated using 1-second bins in cleaned event files. If a bin has >2000 counts, and if more than 50% of those come from <1% of pixels, then it is considered to be noise-dominated and hence unusable.
| Quadrant | # 1 sec bins | Bins with >0 counts | Bins with >2000 counts | High rate bins dominated by noise | Noise dominated (total time) | Noise dominated (detector-on time) | Marked lightcurve |
|---|---|---|---|---|---|---|---|
| A | 7074 | 5432 | 2182 | 2182 | 30.85% | 40.17% | 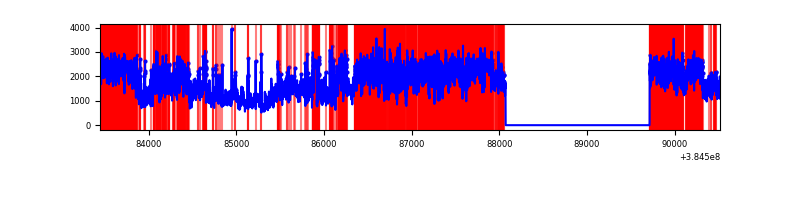 |
| B | 7073 | 5430 | 5255 | 5255 | 74.30% | 96.78% | 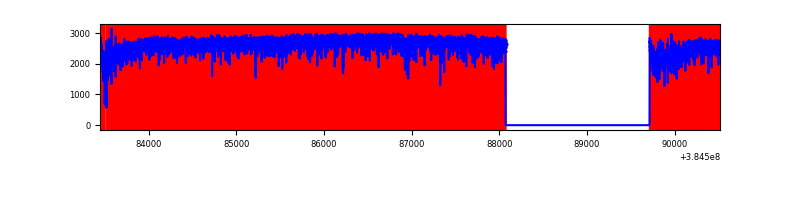 |
| C | 7074 | 5432 | 500 | 500 | 7.07% | 9.20% | 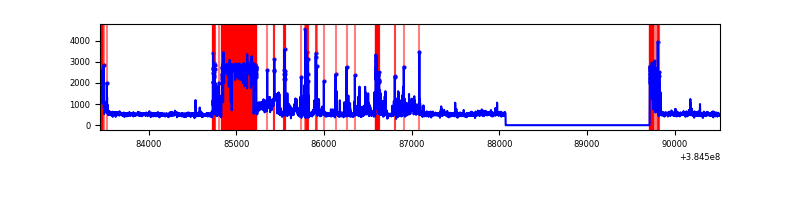 |
| D | 7074 | 5432 | 191 | 191 | 2.70% | 3.52% | 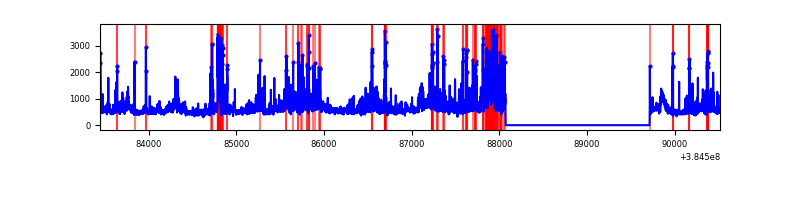 |
Top three noisy pixels from each quadrant. If the there are fewer than three noisy pixels in the level2.evt file, extra rows are filled as -1
| Pixel properties | Quadrant properties | ||||||
|---|---|---|---|---|---|---|---|
| Quadrant | DetID | PixID | Counts | Sigma | Mean | Median | Sigma |
| A | 15 | 169 | 7579680 | 69460.15 | 541 | 531 | 109.1 |
| A | 15 | 237 | 76647 | 697.58 | 541 | 531 | 109.1 |
| A | 10 | 83 | 41384 | 374.4 | 541 | 531 | 109.1 |
| B | 5 | 31 | 5259321 | 113202.41 | 238 | 233 | 46.5 |
| B | 5 | 15 | 5089938 | 109556.42 | 238 | 233 | 46.5 |
| B | 5 | 14 | 2362642 | 50851.1 | 238 | 233 | 46.5 |
| C | 0 | 207 | 1288271 | 9570.24 | 581 | 584 | 134.6 |
| C | 8 | 111 | 304478 | 2258.58 | 581 | 584 | 134.6 |
| C | 15 | 214 | 240144 | 1780.44 | 581 | 584 | 134.6 |
| D | 8 | 195 | 512271 | 3466.01 | 604 | 589 | 147.6 |
| D | 12 | 6 | 351626 | 2377.84 | 604 | 589 | 147.6 |
| D | 12 | 227 | 171202 | 1155.69 | 604 | 589 | 147.6 |
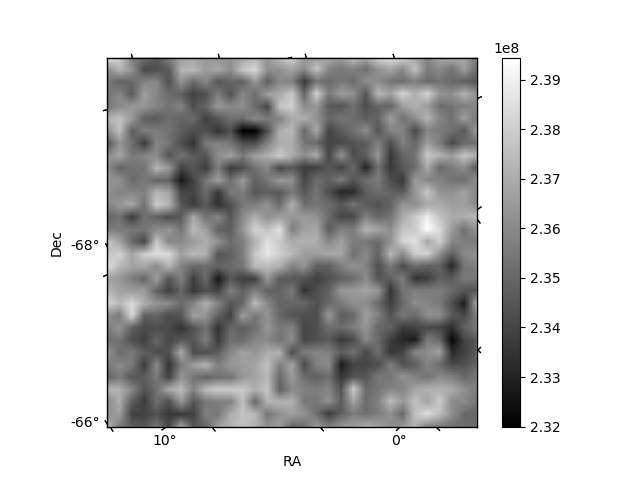
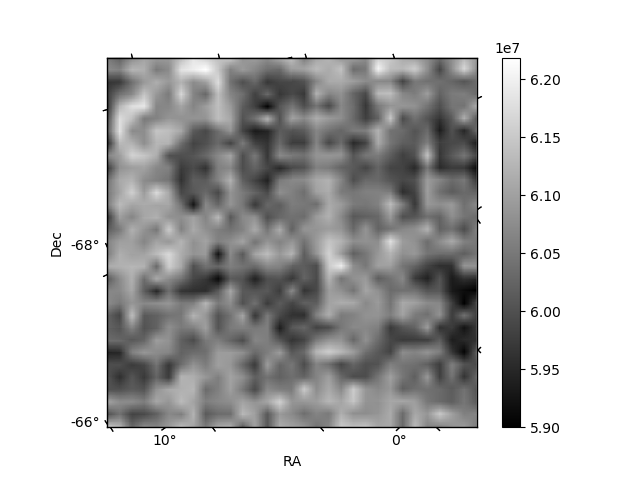
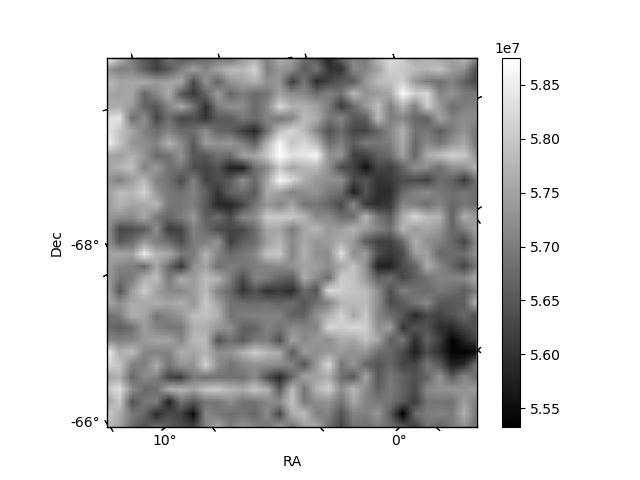
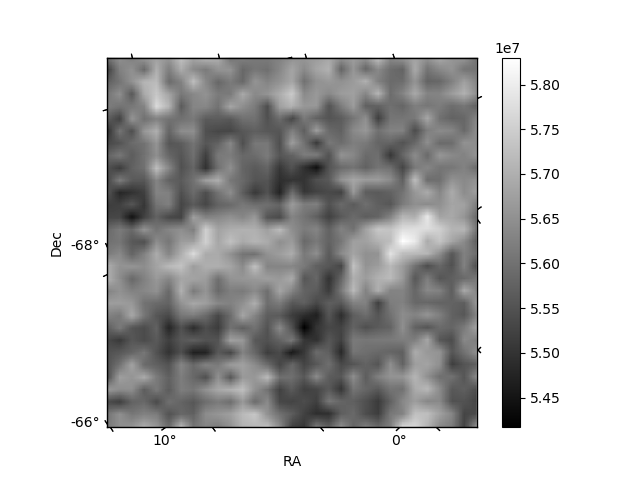
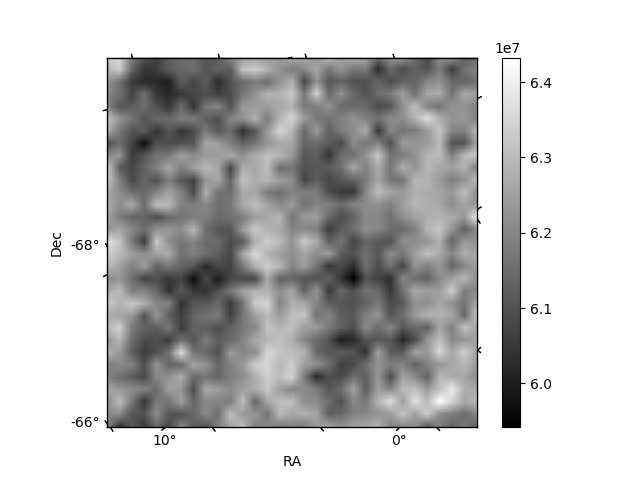
Histogram calculated using DETX and DETY for each event in the final _common_clean file
| Quadrant A | 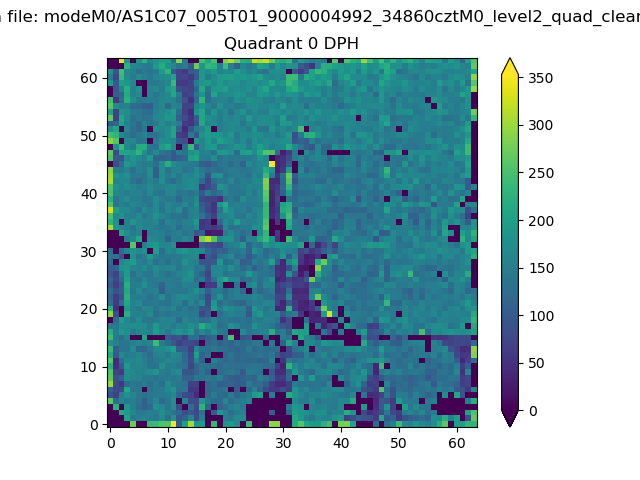 |
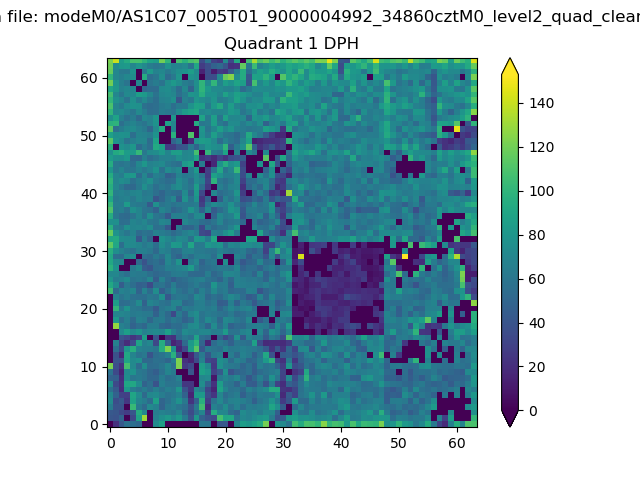 |
Quadrant B |
|---|---|---|---|
| Quadrant D | 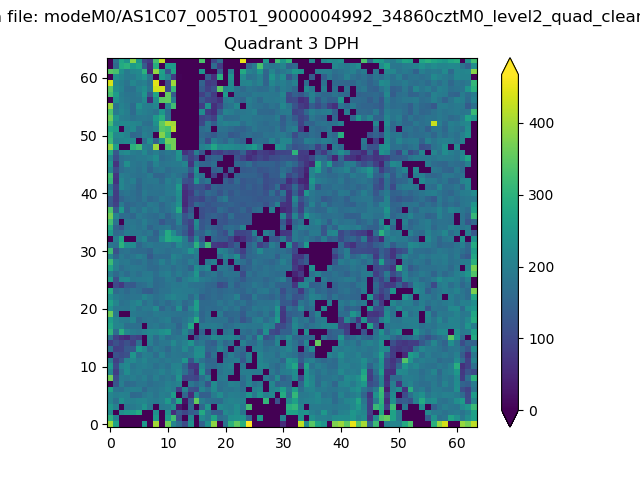 |
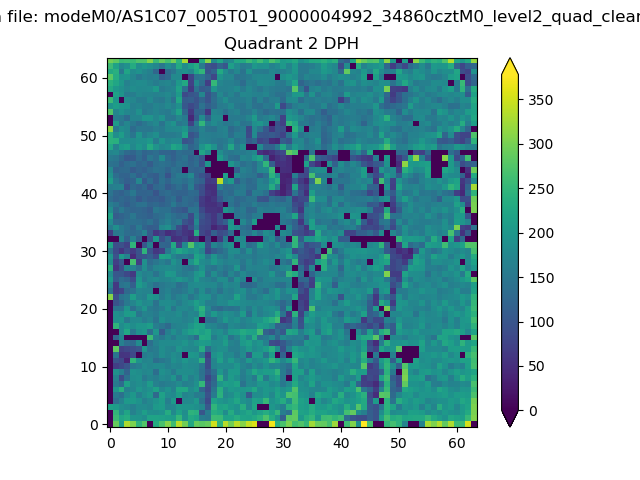 |
Quadrant C |
| Plot type | Count rate plots | Images |
|---|---|---|
| Comparison with Poisson distribution Blue bars denote a histogram of data divided into 1 sec bins. Red curve is a Poisson curve with rate = median count rate of data. |
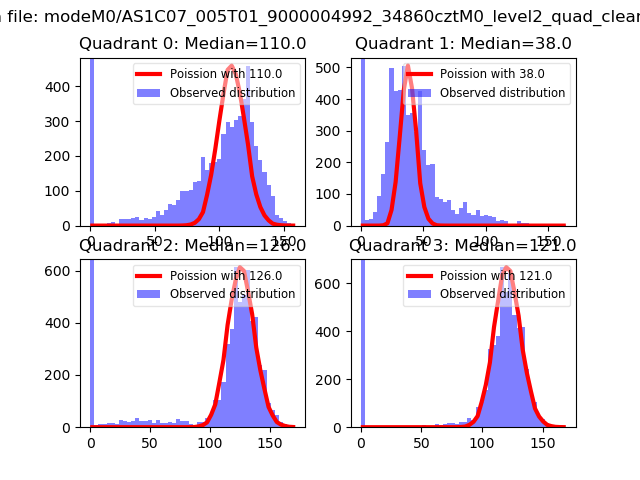 |
 |
| Quadrant-wise count rates Data is divided into 100 sec bins |
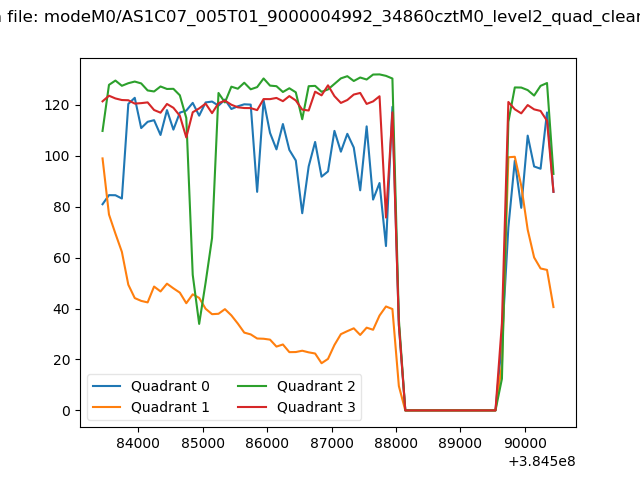 |
|
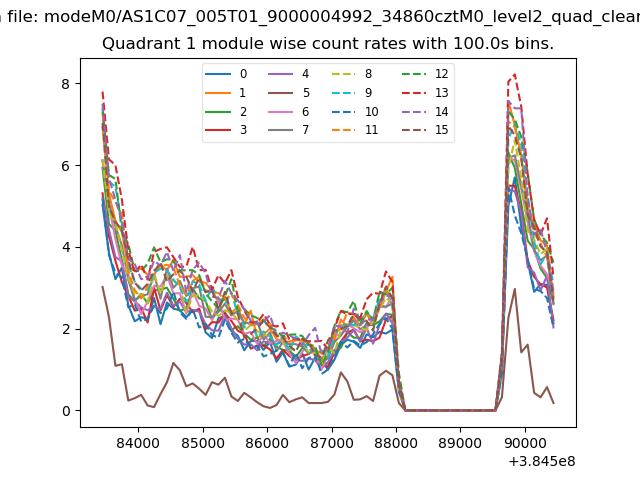
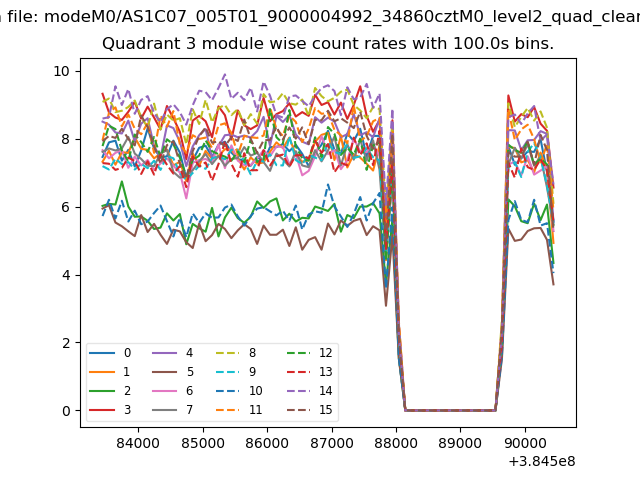
| Module-wise count rates for Quadrant A Data is divided into 100 sec bins |
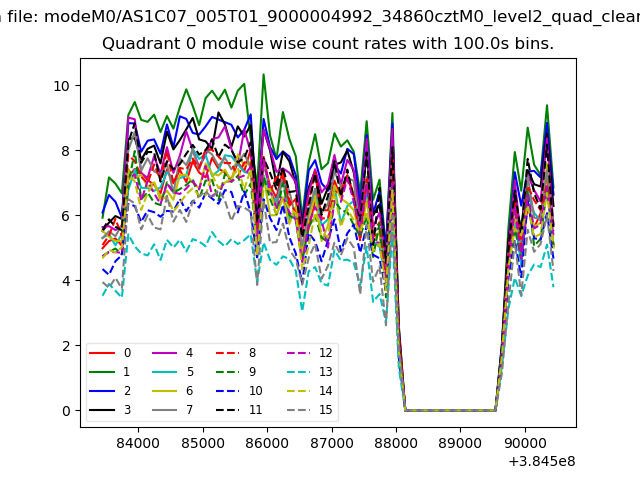 |
 |
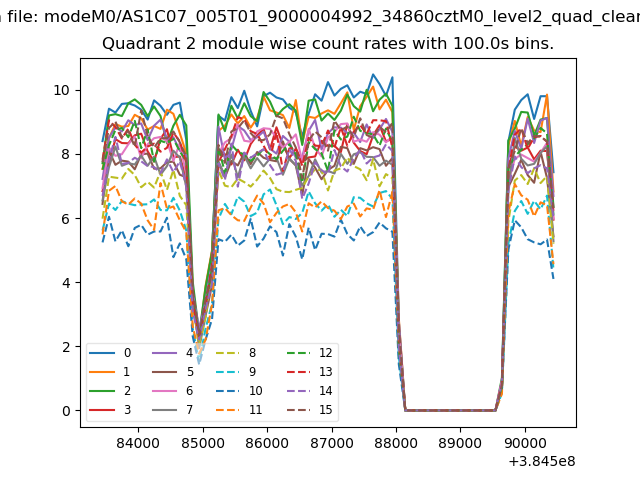
| Module-wise count rates for Quadrant B Data is divided into 100 sec bins |
 |
 |
| Module-wise count rates for Quadrant C Data is divided into 100 sec bins |
 |
 |
| Module-wise count rates for Quadrant D Data is divided into 100 sec bins |
 |
 |
| Parameter | Plot |
|---|---|
| CZT HV Monitor | 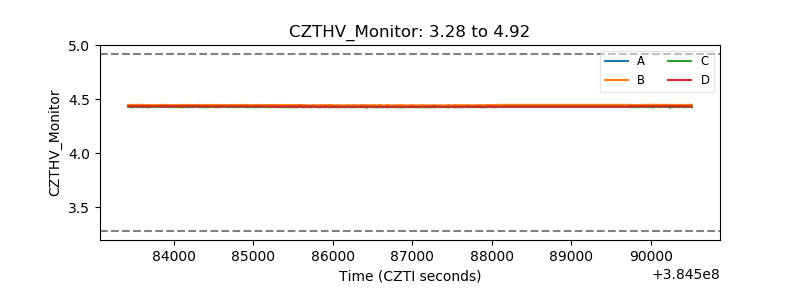 |
| D_VDD | 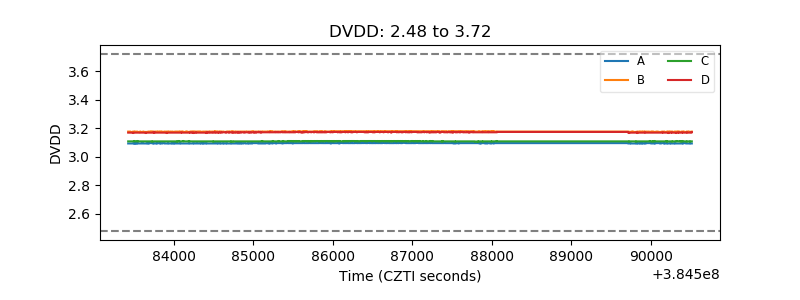 |
| Temperature 1 | 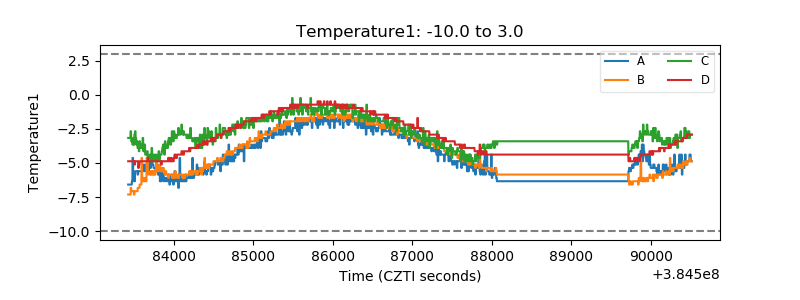 |
| Veto HV Monitor | 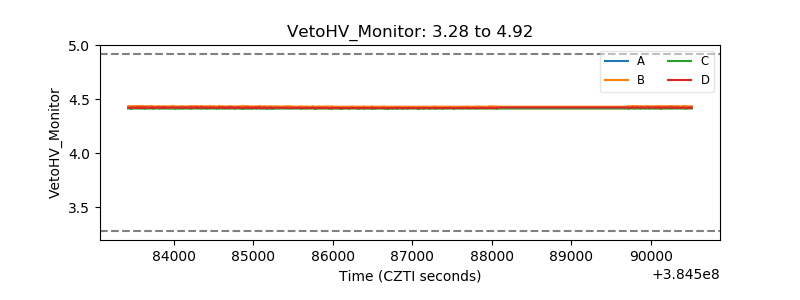 |
| Veto LLD | 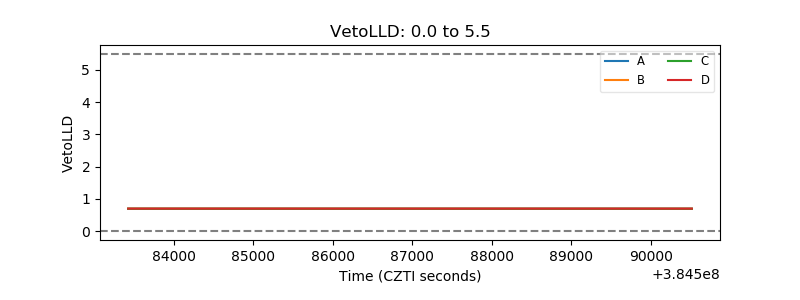 |
| Alpha Counter | 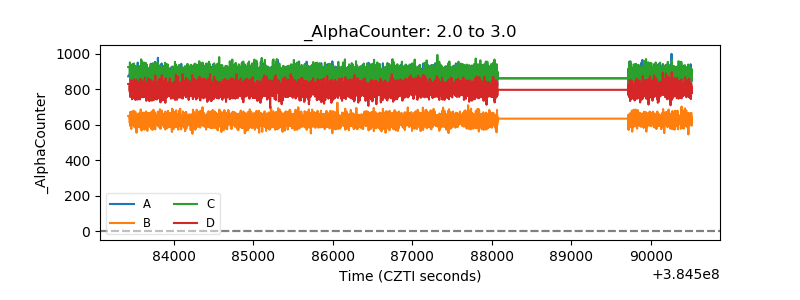 |
| _CPM_Rate | 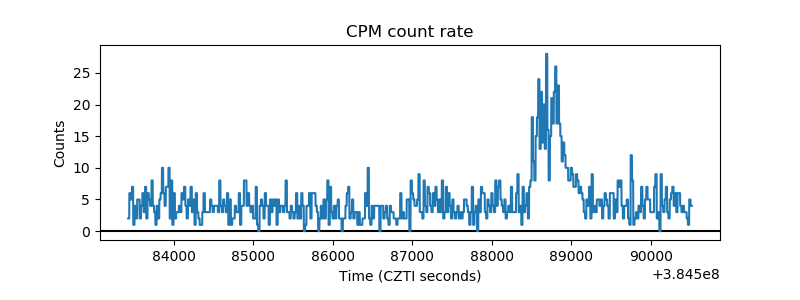 |
| CZT Counter | 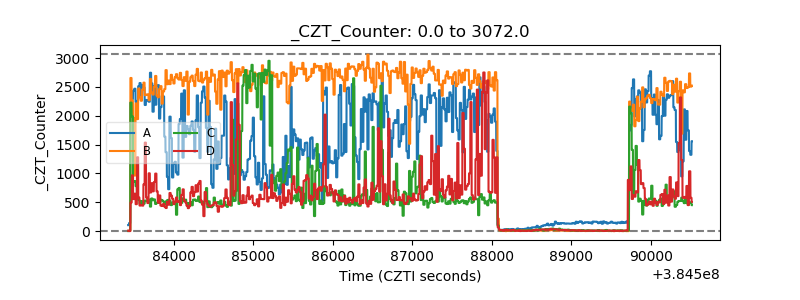 |
| +2.5 Volts monitor | 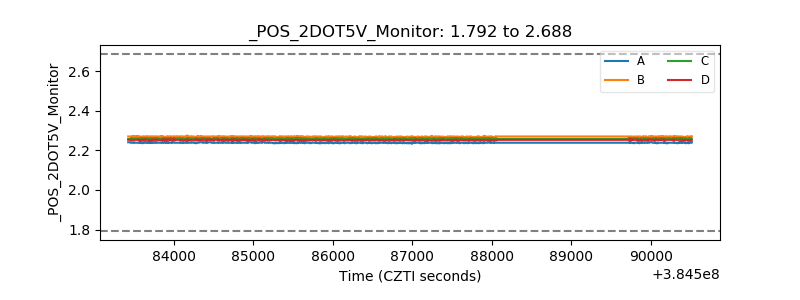 |
| +5 Volts monitor | 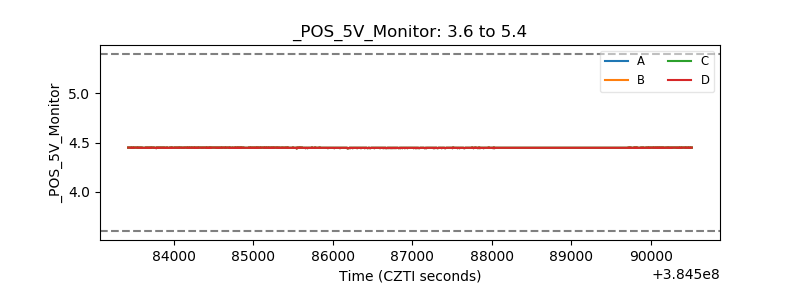 |
| _ROLL_ROT | 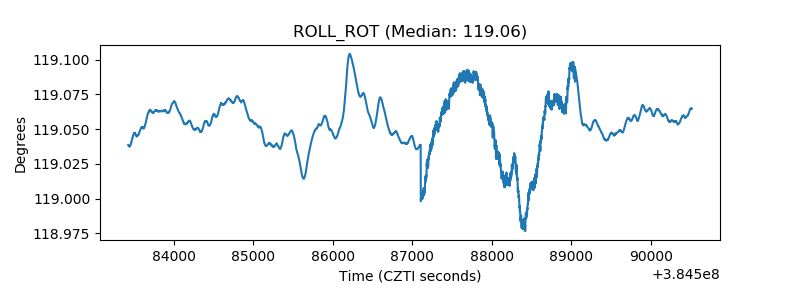 |
| _Roll_DEC | 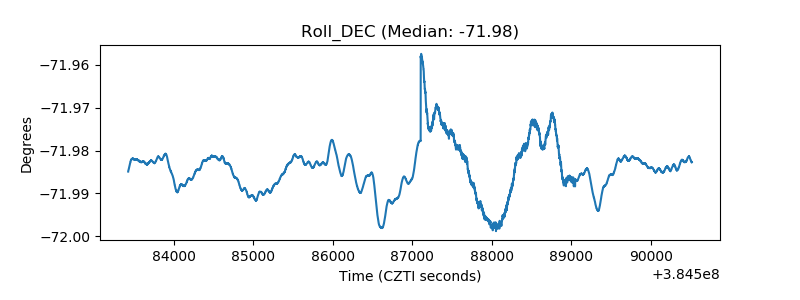 |
| _Roll_RA | 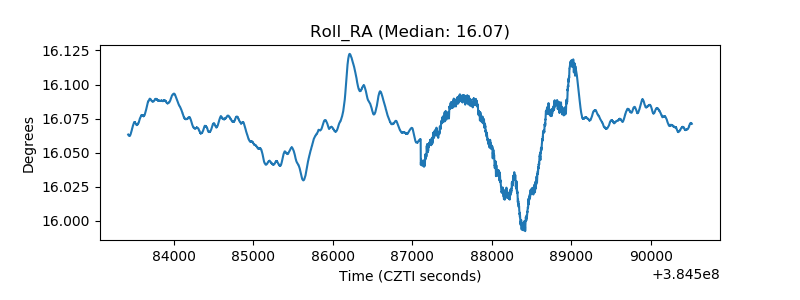 |
| Veto Counter | 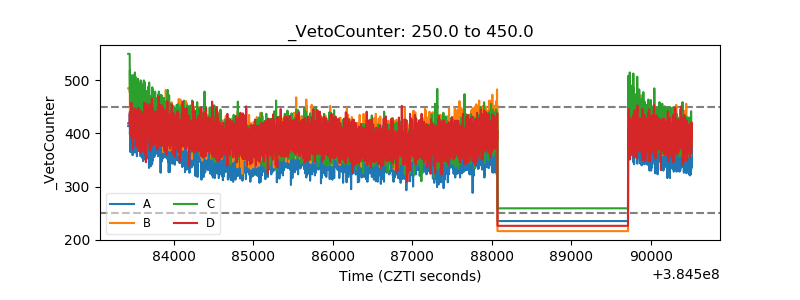 |