| Param | Original file | Final file |
|---|---|---|
| Filename | modeM0/AS1C07_005T01_9000004992_34843cztM0_level2.evt | modeM0/AS1C07_005T01_9000004992_34843cztM0_level2_quad_clean.evt |
| Size (bytes) | 752,558,400 | 83,056,320 |
| Size | 717.7 MB | 79.2 MB |
| Events in quadrant A | 12,056,068 | 288,637 |
| Events in quadrant B | 3,801,248 | 633,069 |
| Events in quadrant C | 3,158,284 | 631,379 |
| Events in quadrant D | 3,420,531 | 592,505 |
| Mode M9 | |||
|---|---|---|---|
| Quadrant | BADHDUFLAG | Total packets | Discarded packets |
| A | 0 | 33 | 0 |
| B | 0 | 33 | 0 |
| C | 0 | 33 | 0 |
| D | 0 | 33 | 0 |
| Mode M0 | |||
|---|---|---|---|
| Quadrant | BADHDUFLAG | Total packets | Discarded packets |
| A | 0 | 39367 | 3 |
| B | 0 | 14614 | 1 |
| C | 0 | 12190 | 1 |
| D | 0 | 13972 | 1 |
| Mode SS | |||
|---|---|---|---|
| Quadrant | BADHDUFLAG | Total packets | Discarded packets |
| A | 0 | 106 | 0 |
| B | 0 | 106 | 0 |
| C | 0 | 106 | 0 |
| D | 0 | 106 | 0 |
| Quadrant | Total seconds | Saturated seconds | Saturation percentage |
|---|---|---|---|
| A | 5251 | 4989 | 95.010474% |
| B | 5251 | 251 | 4.780042% |
| C | 5251 | 132 | 2.513807% |
| D | 5251 | 56 | 1.066464% |
Noise dominated data is calculated using 1-second bins in cleaned event files. If a bin has >2000 counts, and if more than 50% of those come from <1% of pixels, then it is considered to be noise-dominated and hence unusable.
| Quadrant | # 1 sec bins | Bins with >0 counts | Bins with >2000 counts | High rate bins dominated by noise | Noise dominated (total time) | Noise dominated (detector-on time) | Marked lightcurve |
|---|---|---|---|---|---|---|---|
| A | 7374 | 5250 | 4647 | 4647 | 63.02% | 88.51% | 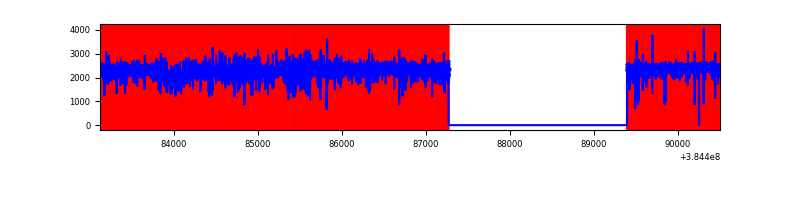 |
| B | 7375 | 5253 | 165 | 165 | 2.24% | 3.14% | 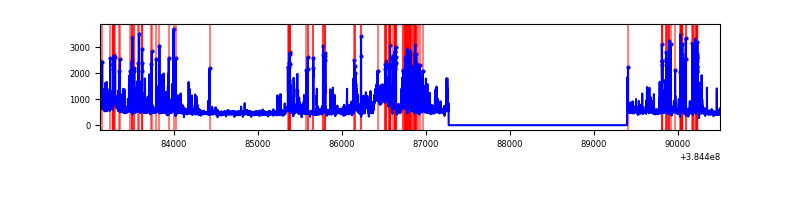 |
| C | 7375 | 5253 | 99 | 99 | 1.34% | 1.88% | 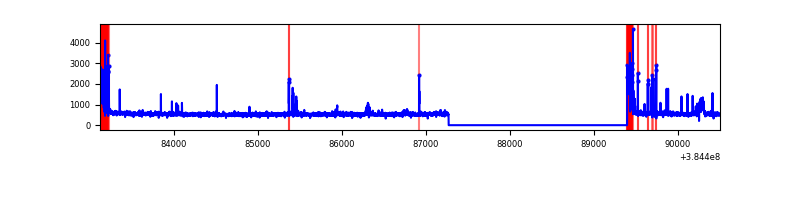 |
| D | 7375 | 5253 | 50 | 50 | 0.68% | 0.95% | 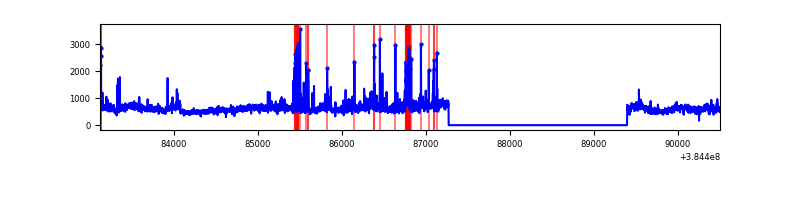 |
Top three noisy pixels from each quadrant. If the there are fewer than three noisy pixels in the level2.evt file, extra rows are filled as -1
| Pixel properties | Quadrant properties | ||||||
|---|---|---|---|---|---|---|---|
| Quadrant | DetID | PixID | Counts | Sigma | Mean | Median | Sigma |
| A | 15 | 169 | 10759428 | 163218.38 | 327 | 321 | 65.9 |
| A | 10 | 83 | 20155 | 300.89 | 327 | 321 | 65.9 |
| A | 13 | 254 | 5212 | 74.2 | 327 | 321 | 65.9 |
| B | 5 | 172 | 571512 | 4774.03 | 643 | 628 | 119.6 |
| B | 5 | 255 | 238574 | 1989.83 | 643 | 628 | 119.6 |
| B | 0 | 190 | 205827 | 1715.98 | 643 | 628 | 119.6 |
| C | 0 | 10 | 314142 | 2161.74 | 638 | 643 | 145.0 |
| C | 15 | 214 | 238503 | 1640.17 | 638 | 643 | 145.0 |
| C | 0 | 207 | 41732 | 283.33 | 638 | 643 | 145.0 |
| D | 8 | 195 | 579106 | 3765.02 | 641 | 625 | 153.6 |
| D | 1 | 52 | 86852 | 561.21 | 641 | 625 | 153.6 |
| D | 12 | 6 | 60030 | 386.64 | 641 | 625 | 153.6 |
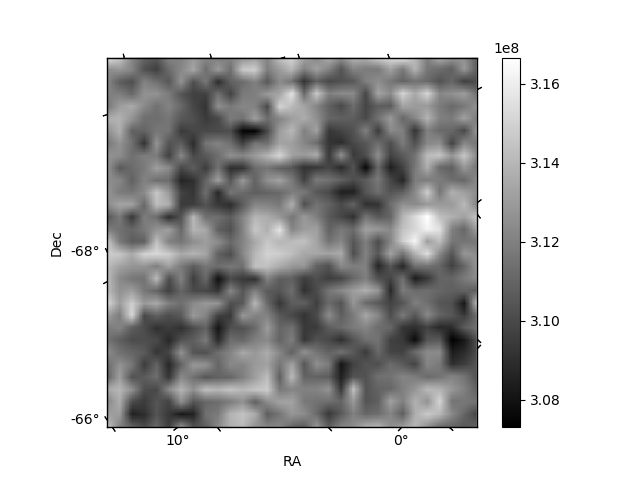
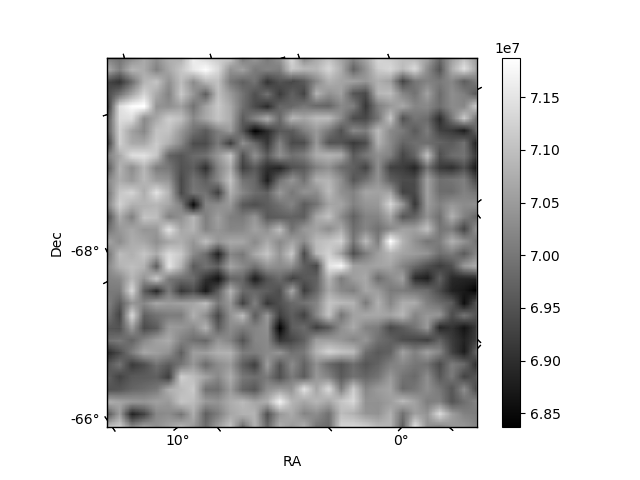
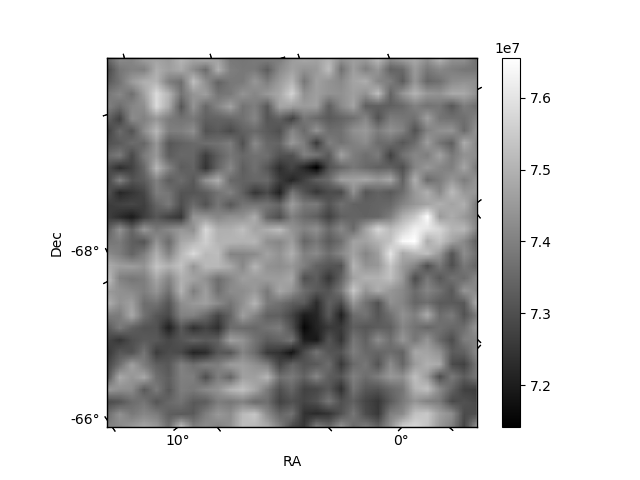
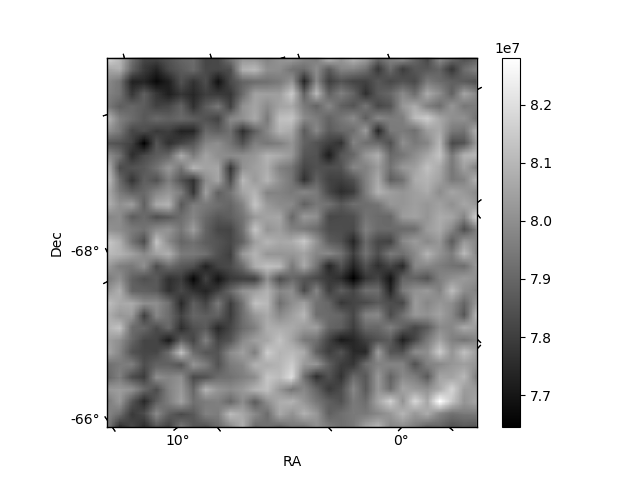
Histogram calculated using DETX and DETY for each event in the final _common_clean file
| Quadrant A | 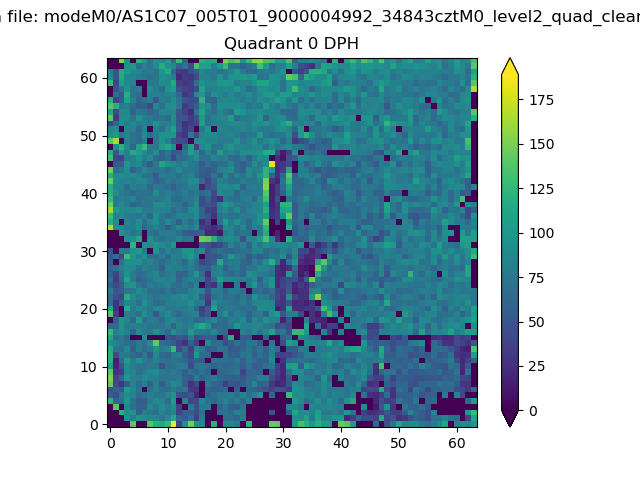 |
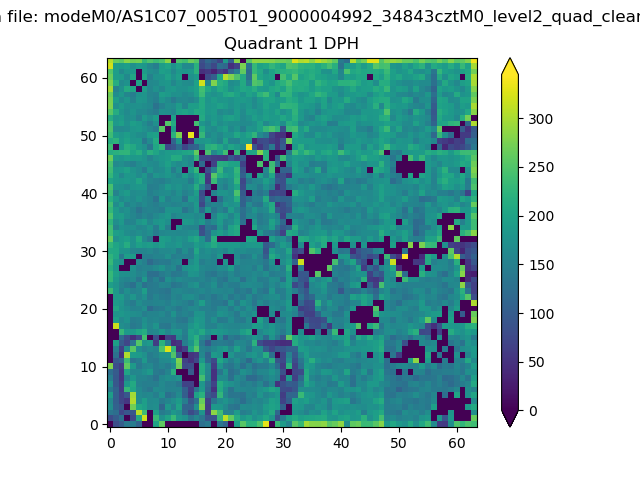 |
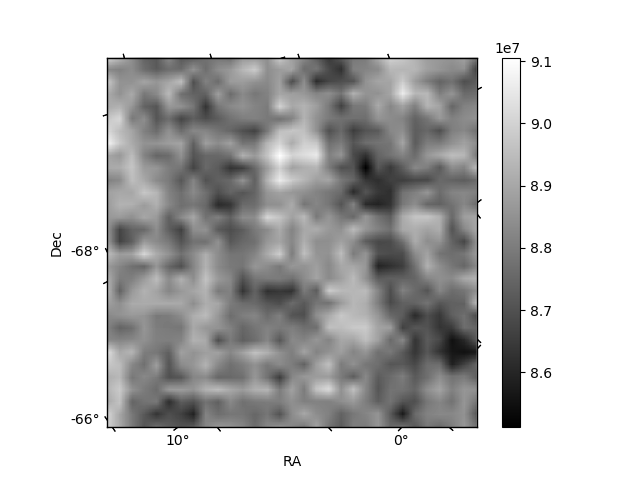
Quadrant B |
|---|---|---|---|
| Quadrant D | 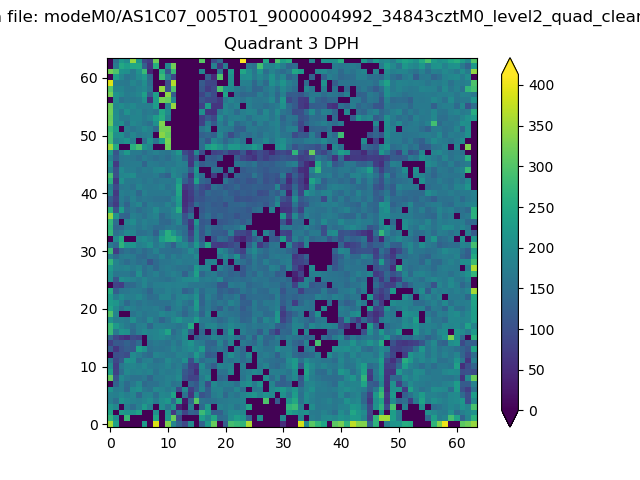 |
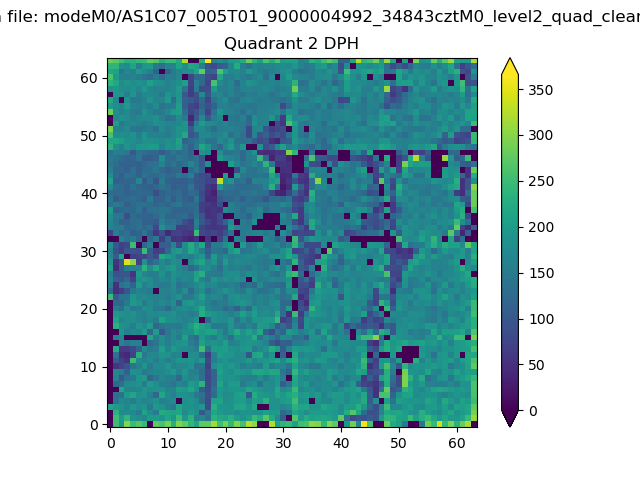 |
Quadrant C |
| Plot type | Count rate plots | Images |
|---|---|---|
| Comparison with Poisson distribution Blue bars denote a histogram of data divided into 1 sec bins. Red curve is a Poisson curve with rate = median count rate of data. |
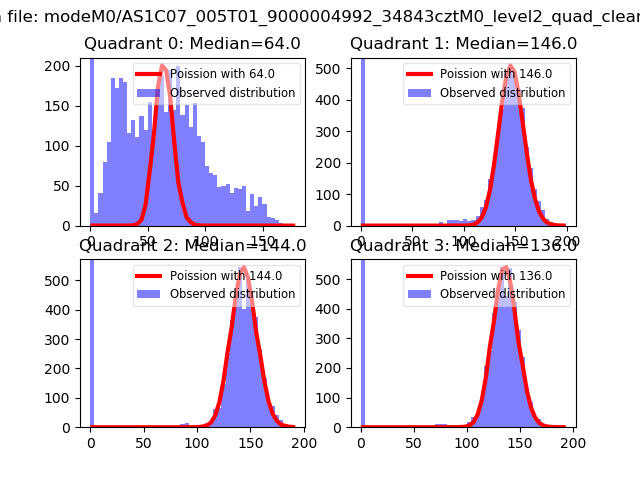 |
 |
| Quadrant-wise count rates Data is divided into 100 sec bins |
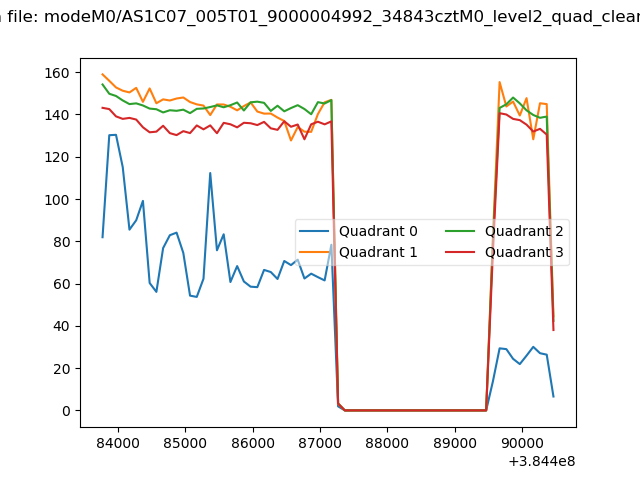 |
|
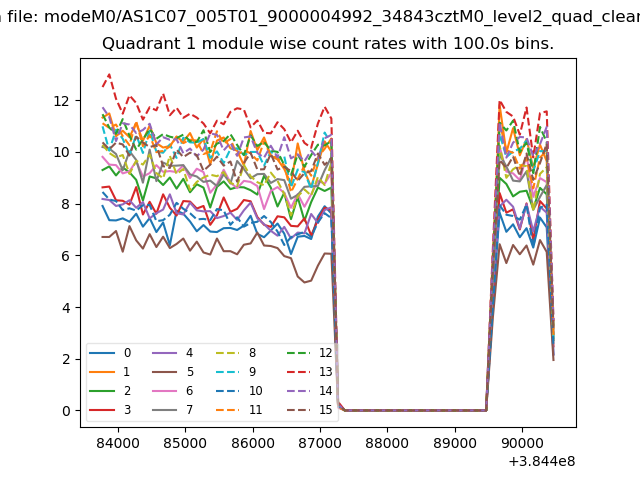
| Module-wise count rates for Quadrant A Data is divided into 100 sec bins |
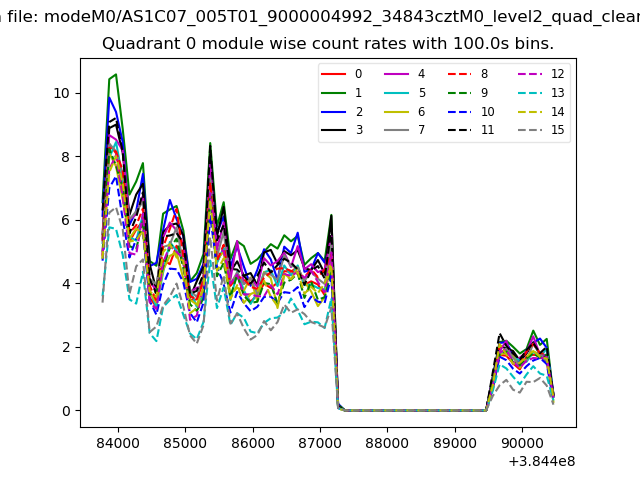 |
 |
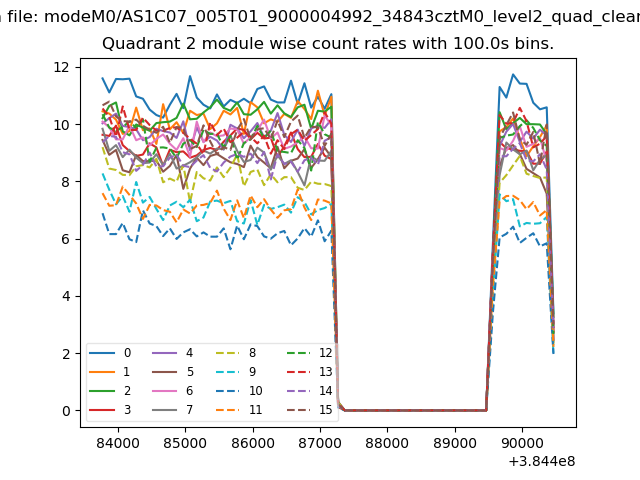
| Module-wise count rates for Quadrant B Data is divided into 100 sec bins |
 |
 |
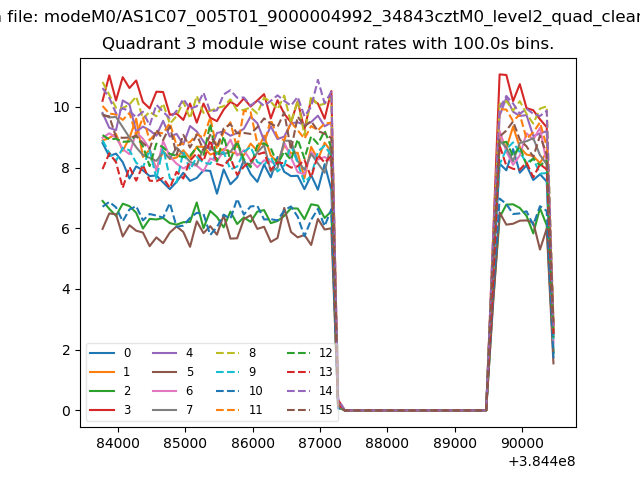
| Module-wise count rates for Quadrant C Data is divided into 100 sec bins |
 |
 |
| Module-wise count rates for Quadrant D Data is divided into 100 sec bins |
 |
 |
| Parameter | Plot |
|---|---|
| CZT HV Monitor |  |
| D_VDD | 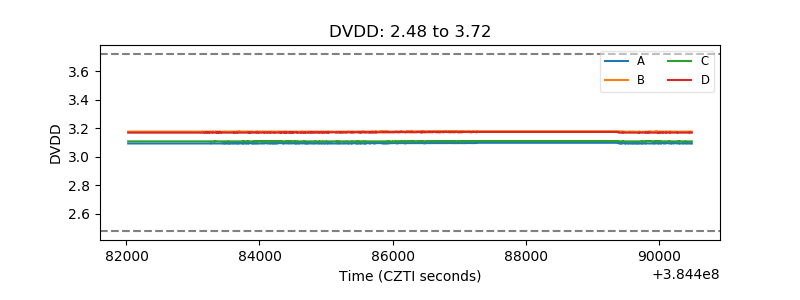 |
| Temperature 1 | 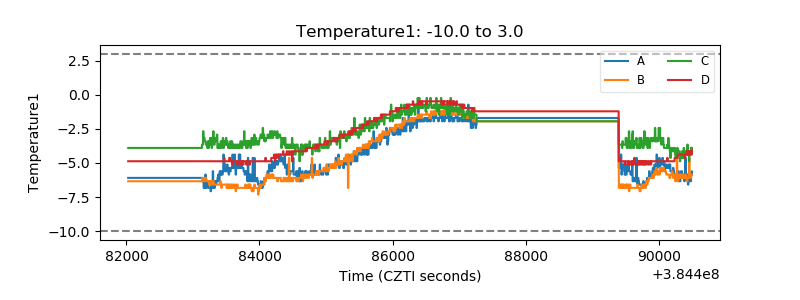 |
| Veto HV Monitor | 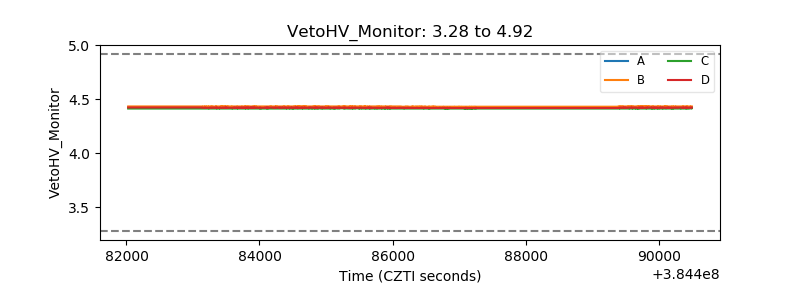 |
| Veto LLD | 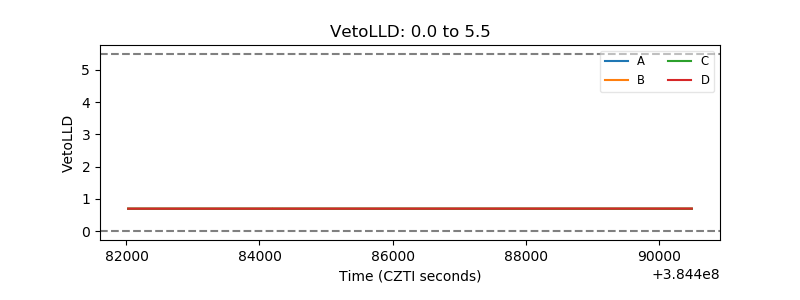 |
| Alpha Counter | 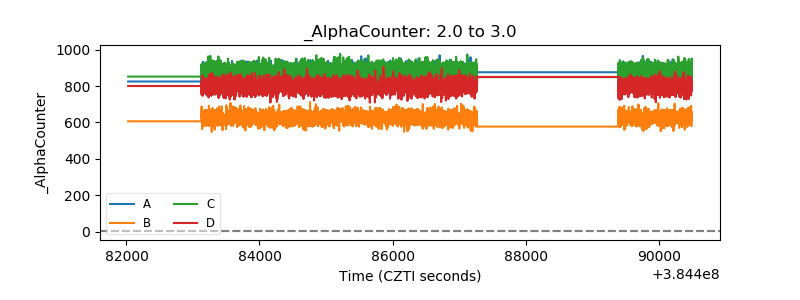 |
| _CPM_Rate | 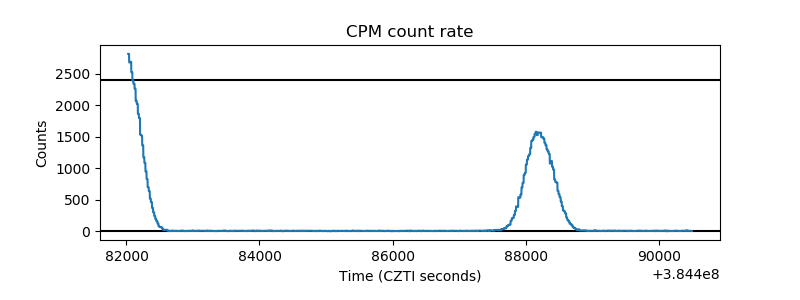 |
| CZT Counter | 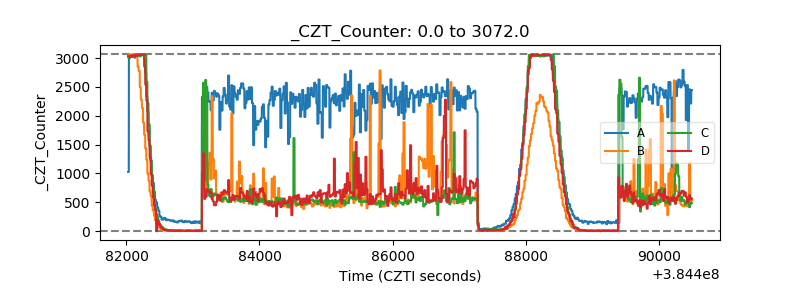 |
| +2.5 Volts monitor | 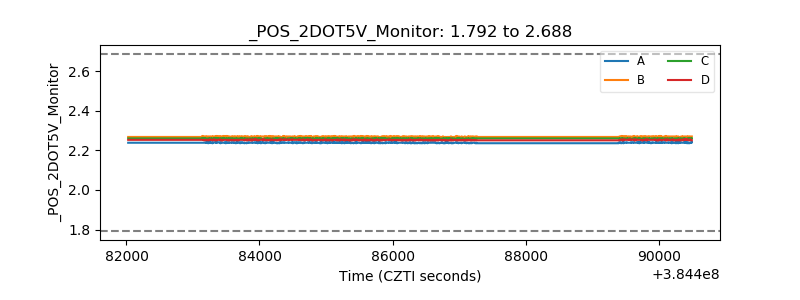 |
| +5 Volts monitor | 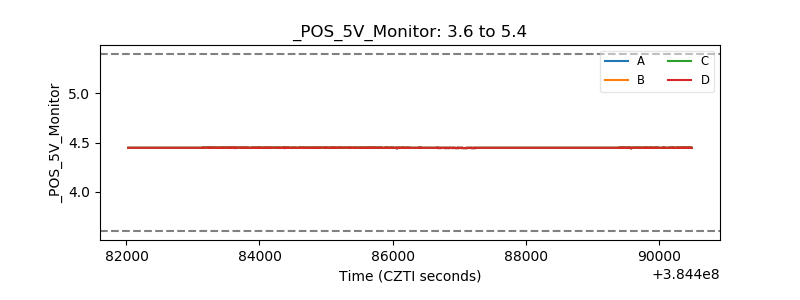 |
| _ROLL_ROT |  |
| _Roll_DEC | 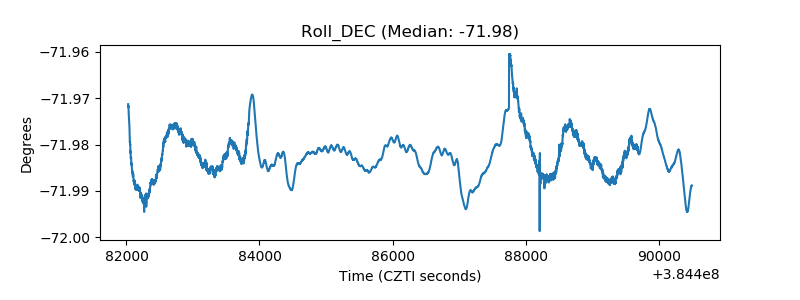 |
| _Roll_RA | 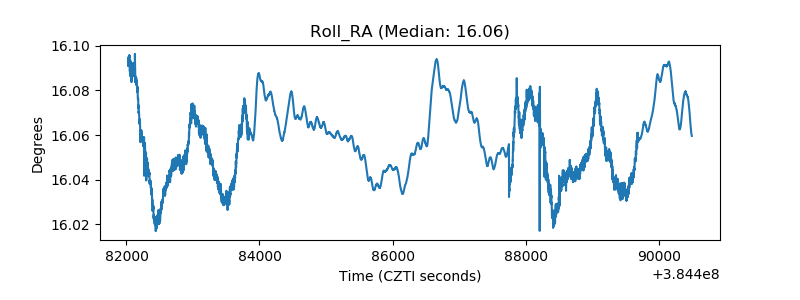 |
| Veto Counter | 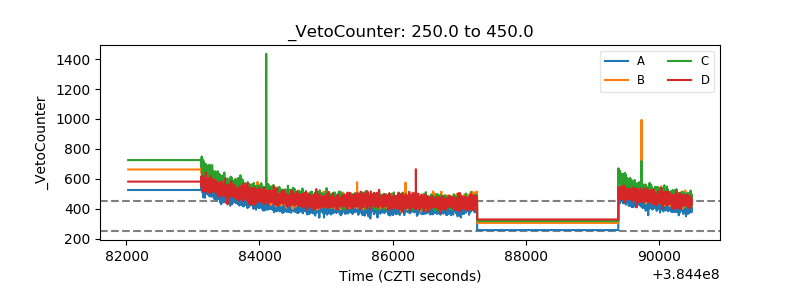 |