| Param | Original file | Final file |
|---|---|---|
| Filename | modeM0/AS1C07_005T01_9000004992_34842cztM0_level2.evt | modeM0/AS1C07_005T01_9000004992_34842cztM0_level2_quad_clean.evt |
| Size (bytes) | 696,329,280 | 74,315,520 |
| Size | 664.1 MB | 70.9 MB |
| Events in quadrant A | 10,423,822 | 362,928 |
| Events in quadrant B | 3,996,353 | 516,919 |
| Events in quadrant C | 2,996,073 | 527,196 |
| Events in quadrant D | 3,336,870 | 494,266 |
| Mode M9 | |||
|---|---|---|---|
| Quadrant | BADHDUFLAG | Total packets | Discarded packets |
| A | 0 | 32 | 0 |
| B | 0 | 32 | 0 |
| C | 0 | 32 | 0 |
| D | 0 | 33 | 0 |
| Mode M0 | |||
|---|---|---|---|
| Quadrant | BADHDUFLAG | Total packets | Discarded packets |
| A | 0 | 34340 | 2 |
| B | 0 | 15101 | 1 |
| C | 0 | 11562 | 1 |
| D | 0 | 13400 | 1 |
| Mode SS | |||
|---|---|---|---|
| Quadrant | BADHDUFLAG | Total packets | Discarded packets |
| A | 0 | 100 | 0 |
| B | 0 | 100 | 0 |
| C | 0 | 100 | 0 |
| D | 0 | 100 | 0 |
| Quadrant | Total seconds | Saturated seconds | Saturation percentage |
|---|---|---|---|
| A | 4958 | 3995 | 80.576846% |
| B | 4958 | 411 | 8.289633% |
| C | 4958 | 140 | 2.823719% |
| D | 4958 | 131 | 2.642194% |
Noise dominated data is calculated using 1-second bins in cleaned event files. If a bin has >2000 counts, and if more than 50% of those come from <1% of pixels, then it is considered to be noise-dominated and hence unusable.
| Quadrant | # 1 sec bins | Bins with >0 counts | Bins with >2000 counts | High rate bins dominated by noise | Noise dominated (total time) | Noise dominated (detector-on time) | Marked lightcurve |
|---|---|---|---|---|---|---|---|
| A | 7050 | 4958 | 3401 | 3401 | 48.24% | 68.60% | 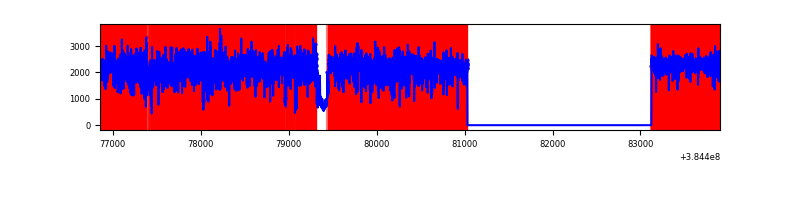 |
| B | 7050 | 4958 | 330 | 330 | 4.68% | 6.66% | 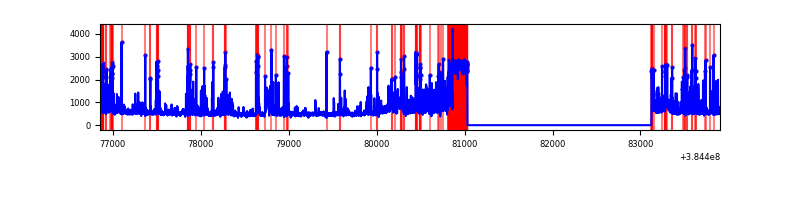 |
| C | 7050 | 4959 | 102 | 102 | 1.45% | 2.06% | 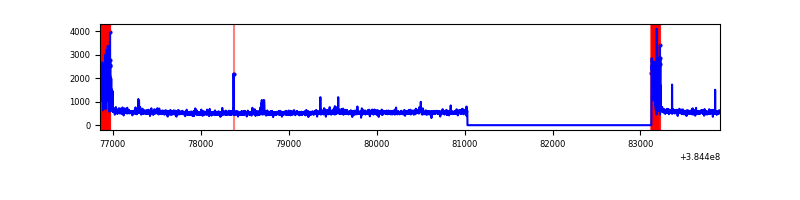 |
| D | 7050 | 4959 | 83 | 83 | 1.18% | 1.67% | 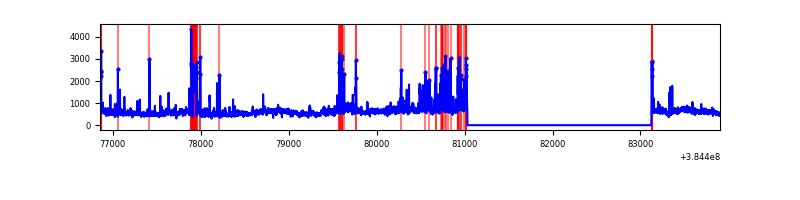 |
Top three noisy pixels from each quadrant. If the there are fewer than three noisy pixels in the level2.evt file, extra rows are filled as -1
| Pixel properties | Quadrant properties | ||||||
|---|---|---|---|---|---|---|---|
| Quadrant | DetID | PixID | Counts | Sigma | Mean | Median | Sigma |
| A | 15 | 169 | 8652676 | 98239.27 | 446 | 439 | 88.1 |
| A | 10 | 83 | 32171 | 360.29 | 446 | 439 | 88.1 |
| A | 13 | 6 | 8760 | 94.48 | 446 | 439 | 88.1 |
| B | 5 | 172 | 603937 | 5470.09 | 600 | 587 | 110.3 |
| B | 5 | 255 | 264374 | 2391.55 | 600 | 587 | 110.3 |
| B | 5 | 31 | 200271 | 1810.38 | 600 | 587 | 110.3 |
| C | 0 | 10 | 339298 | 2469.31 | 608 | 614 | 137.2 |
| C | 15 | 214 | 226333 | 1645.7 | 608 | 614 | 137.2 |
| C | 0 | 207 | 18532 | 130.64 | 608 | 614 | 137.2 |
| D | 8 | 195 | 470942 | 3232.97 | 603 | 588 | 145.5 |
| D | 13 | 249 | 189308 | 1297.16 | 603 | 588 | 145.5 |
| D | 12 | 233 | 123245 | 843.08 | 603 | 588 | 145.5 |
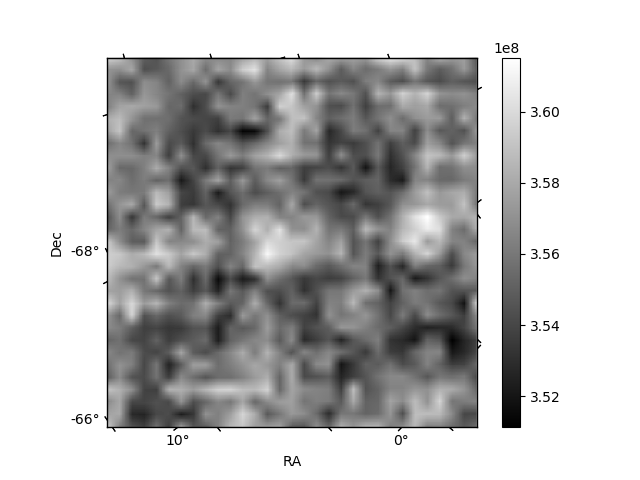
Histogram calculated using DETX and DETY for each event in the final _common_clean file
| Quadrant A | 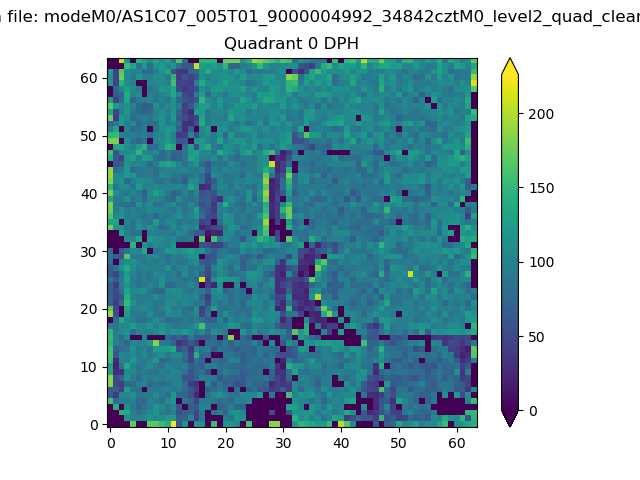 |
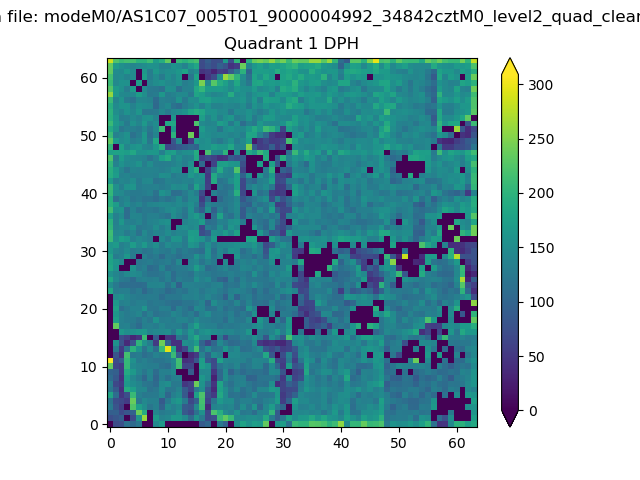 |
Quadrant B |
|---|---|---|---|
| Quadrant D | 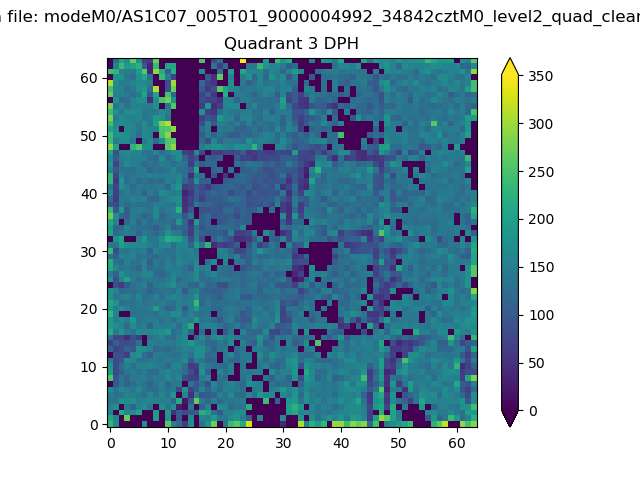 |
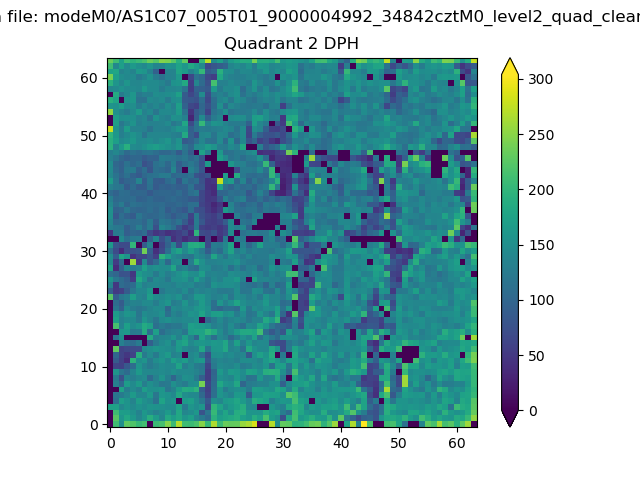 |
Quadrant C |
| Plot type | Count rate plots | Images |
|---|---|---|
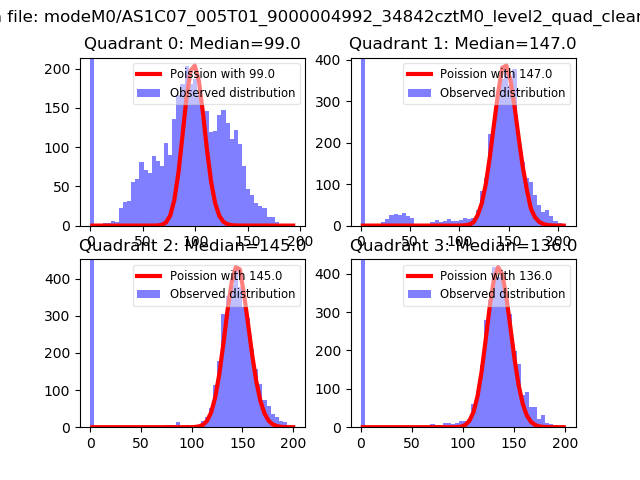
| Comparison with Poisson distribution Blue bars denote a histogram of data divided into 1 sec bins. Red curve is a Poisson curve with rate = median count rate of data. |
 |
 |
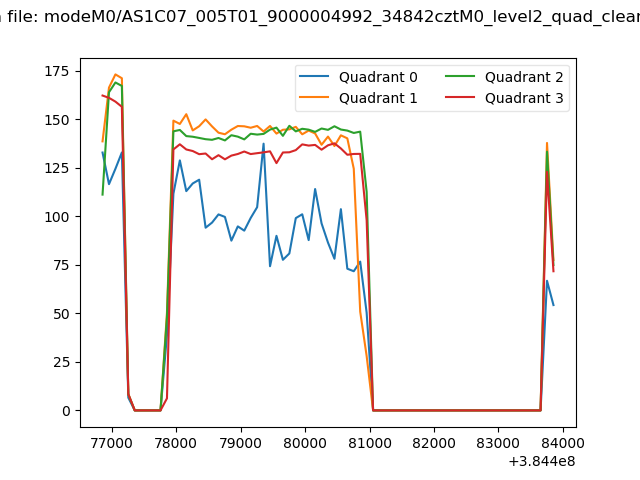
| Quadrant-wise count rates Data is divided into 100 sec bins |
 |
|
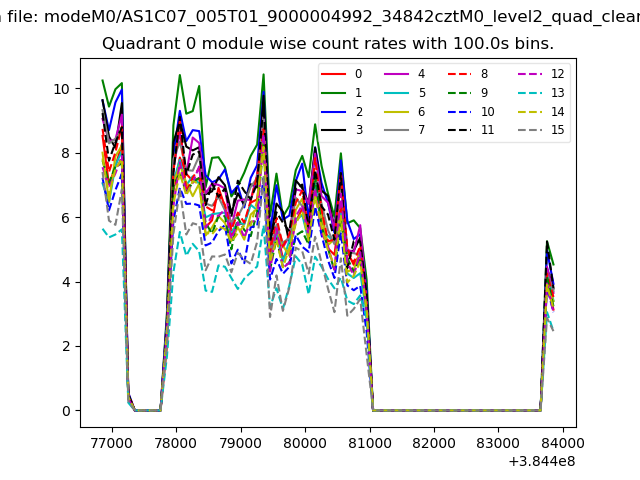
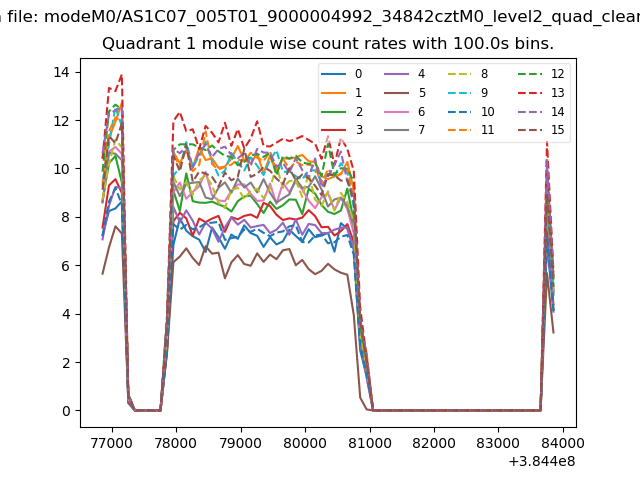
| Module-wise count rates for Quadrant A Data is divided into 100 sec bins |
 |
 |
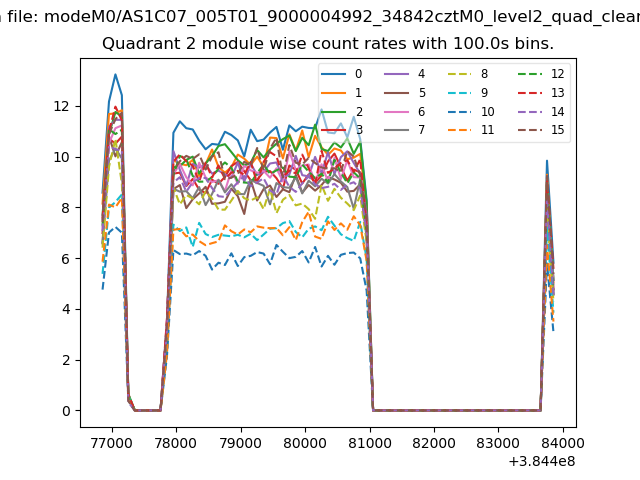
| Module-wise count rates for Quadrant B Data is divided into 100 sec bins |
 |
 |
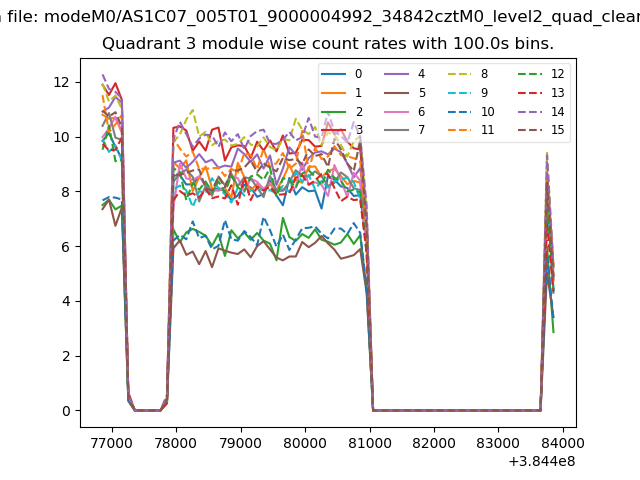
| Module-wise count rates for Quadrant C Data is divided into 100 sec bins |
 |
 |
| Module-wise count rates for Quadrant D Data is divided into 100 sec bins |
 |
 |
| Parameter | Plot |
|---|---|
| CZT HV Monitor | 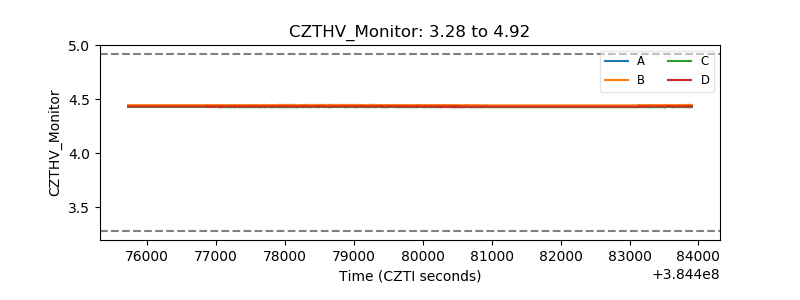 |
| D_VDD | 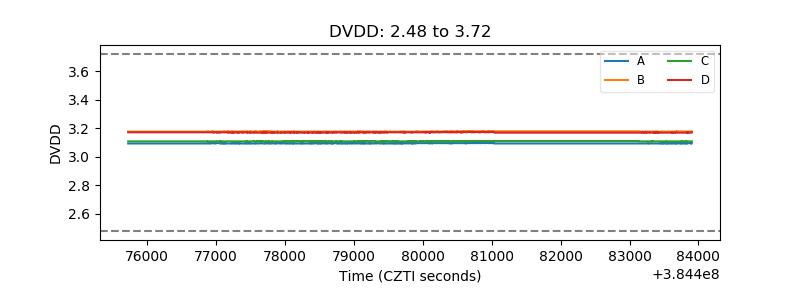 |
| Temperature 1 | 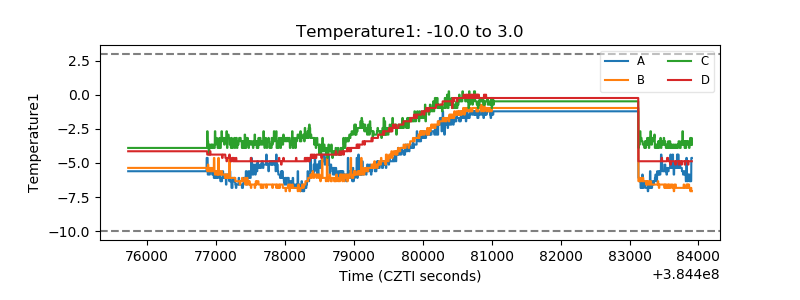 |
| Veto HV Monitor | 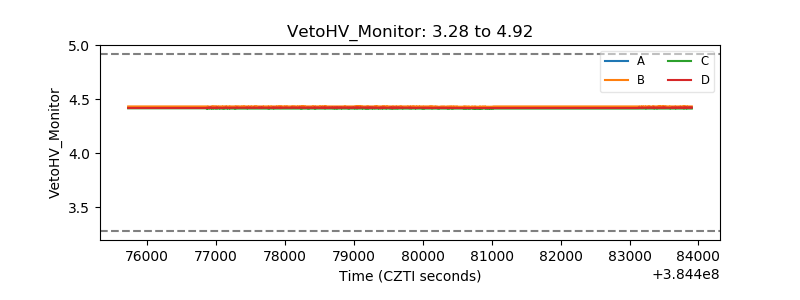 |
| Veto LLD | 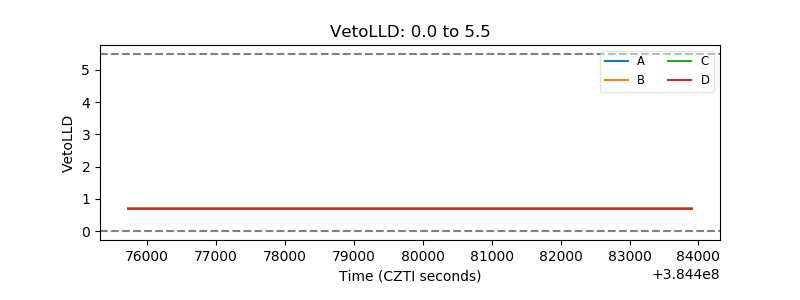 |
| Alpha Counter | 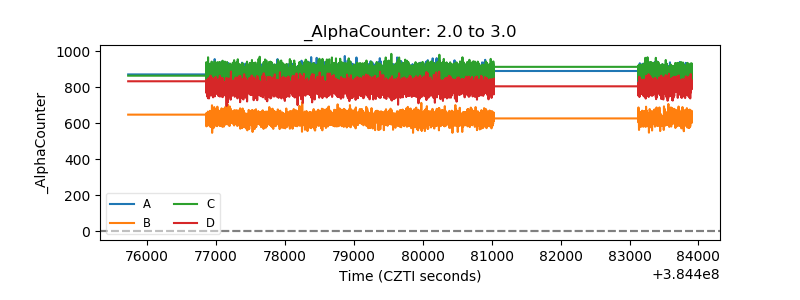 |
| _CPM_Rate | 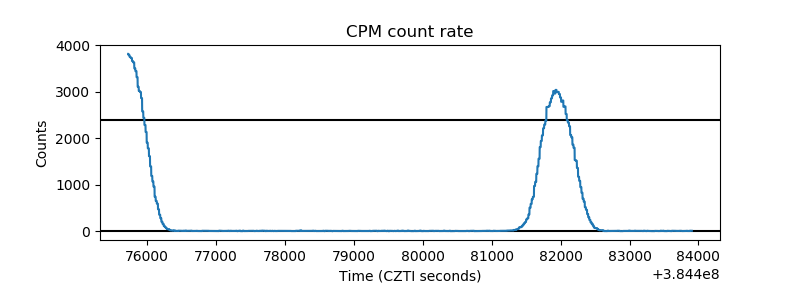 |
| CZT Counter | 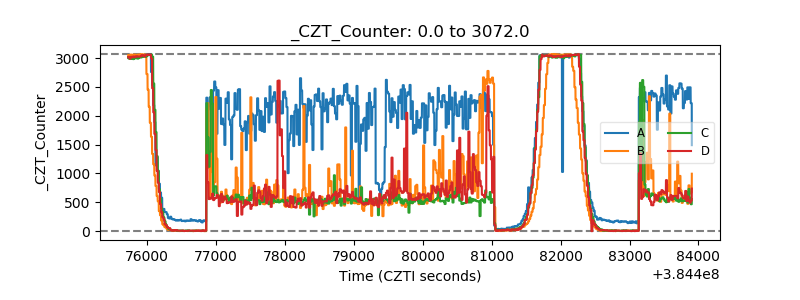 |
| +2.5 Volts monitor |  |
| +5 Volts monitor | 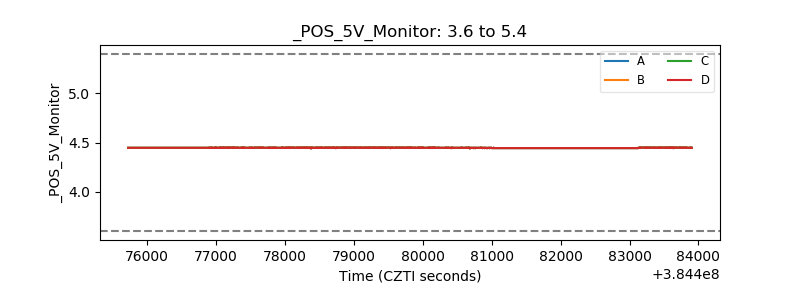 |
| _ROLL_ROT | 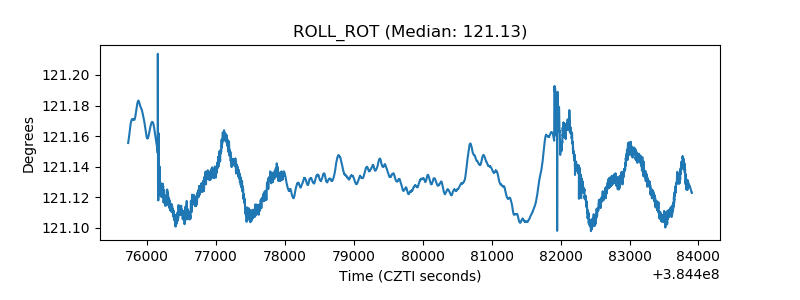 |
| _Roll_DEC | 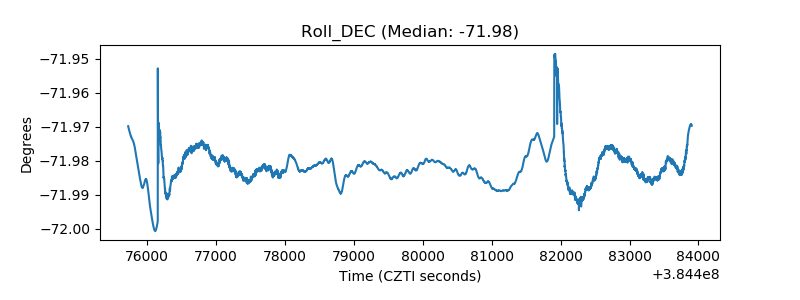 |
| _Roll_RA | 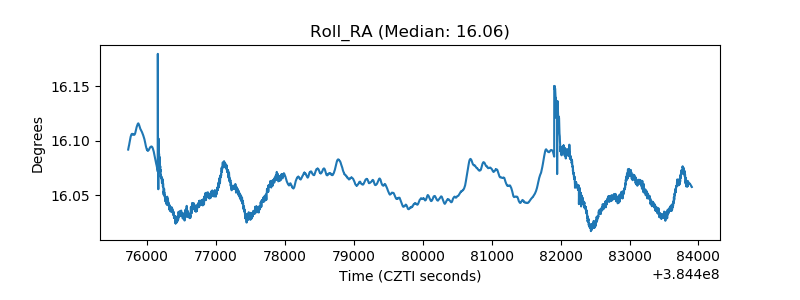 |
| Veto Counter | 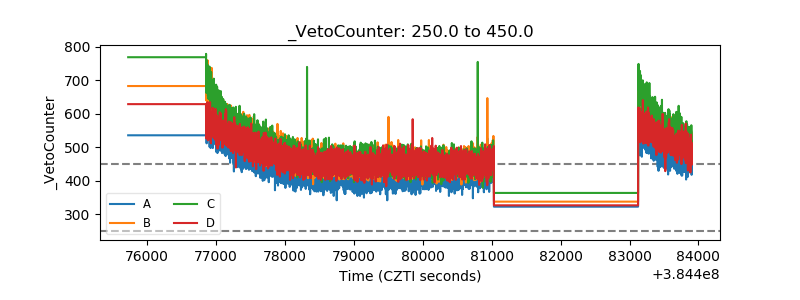 |