| Param | Original file | Final file |
|---|---|---|
| Filename | modeM0/AS1C07_005T01_9000004992_34832cztM0_level2.evt | modeM0/AS1C07_005T01_9000004992_34832cztM0_level2_quad_clean.evt |
| Size (bytes) | 807,094,080 | 84,876,480 |
| Size | 769.7 MB | 80.9 MB |
| Events in quadrant A | 2,822,463 | 645,094 |
| Events in quadrant B | 13,247,533 | 278,890 |
| Events in quadrant C | 3,095,741 | 649,469 |
| Events in quadrant D | 4,888,742 | 592,870 |
| Mode M9 | |||
|---|---|---|---|
| Quadrant | BADHDUFLAG | Total packets | Discarded packets |
| A | 0 | 14 | 0 |
| B | 0 | 14 | 0 |
| C | 0 | 14 | 0 |
| D | 0 | 15 | 0 |
| Mode M0 | |||
|---|---|---|---|
| Quadrant | BADHDUFLAG | Total packets | Discarded packets |
| A | 0 | 12041 | 3 |
| B | 0 | 43194 | 2 |
| C | 0 | 12560 | 2 |
| D | 0 | 18519 | 2 |
| Mode SS | |||
|---|---|---|---|
| Quadrant | BADHDUFLAG | Total packets | Discarded packets |
| A | 0 | 116 | 0 |
| B | 0 | 116 | 0 |
| C | 0 | 116 | 0 |
| D | 0 | 116 | 0 |
| Quadrant | Total seconds | Saturated seconds | Saturation percentage |
|---|---|---|---|
| A | 5750 | 26 | 0.452174% |
| B | 5750 | 4903 | 85.269565% |
| C | 5750 | 71 | 1.234783% |
| D | 5750 | 456 | 7.930435% |
Noise dominated data is calculated using 1-second bins in cleaned event files. If a bin has >2000 counts, and if more than 50% of those come from <1% of pixels, then it is considered to be noise-dominated and hence unusable.
| Quadrant | # 1 sec bins | Bins with >0 counts | Bins with >2000 counts | High rate bins dominated by noise | Noise dominated (total time) | Noise dominated (detector-on time) | Marked lightcurve |
|---|---|---|---|---|---|---|---|
| A | 7152 | 5751 | 10 | 10 | 0.14% | 0.17% | 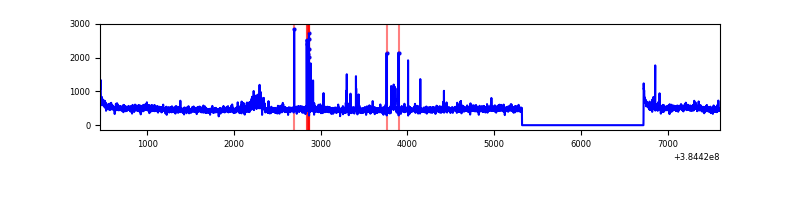 |
| B | 7152 | 5750 | 4834 | 4834 | 67.59% | 84.07% | 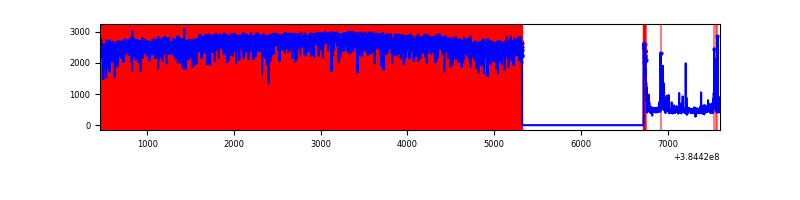 |
| C | 7152 | 5751 | 59 | 59 | 0.82% | 1.03% | 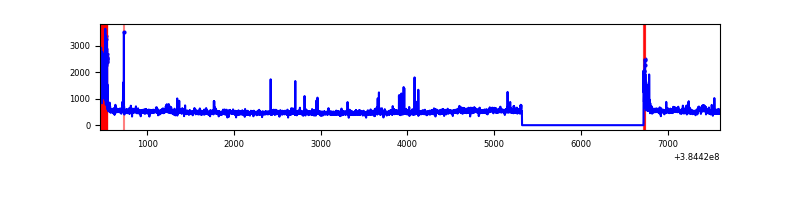 |
| D | 7152 | 5751 | 415 | 415 | 5.80% | 7.22% | 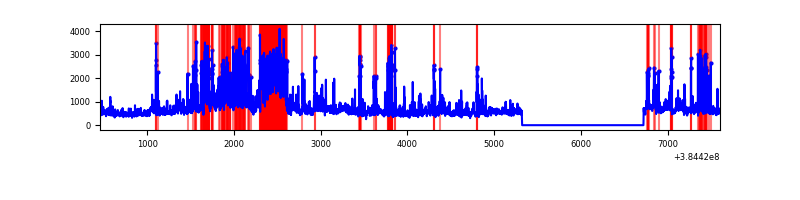 |
Top three noisy pixels from each quadrant. If the there are fewer than three noisy pixels in the level2.evt file, extra rows are filled as -1
| Pixel properties | Quadrant properties | ||||||
|---|---|---|---|---|---|---|---|
| Quadrant | DetID | PixID | Counts | Sigma | Mean | Median | Sigma |
| A | 15 | 169 | 67407 | 507.31 | 657 | 645 | 131.6 |
| A | 10 | 83 | 54019 | 405.58 | 657 | 645 | 131.6 |
| A | 2 | 79 | 51462 | 386.15 | 657 | 645 | 131.6 |
| B | 5 | 14 | 3821509 | 63955.13 | 305 | 298 | 59.7 |
| B | 5 | 31 | 3791346 | 63450.29 | 305 | 298 | 59.7 |
| B | 5 | 15 | 3781253 | 63281.37 | 305 | 298 | 59.7 |
| C | 15 | 214 | 268111 | 1807.84 | 638 | 642 | 147.9 |
| C | 0 | 10 | 187651 | 1264.01 | 638 | 642 | 147.9 |
| C | 0 | 207 | 89980 | 603.84 | 638 | 642 | 147.9 |
| D | 8 | 195 | 786510 | 5138.98 | 623 | 605 | 152.9 |
| D | 12 | 233 | 734053 | 4795.97 | 623 | 605 | 152.9 |
| D | 13 | 249 | 217657 | 1419.29 | 623 | 605 | 152.9 |
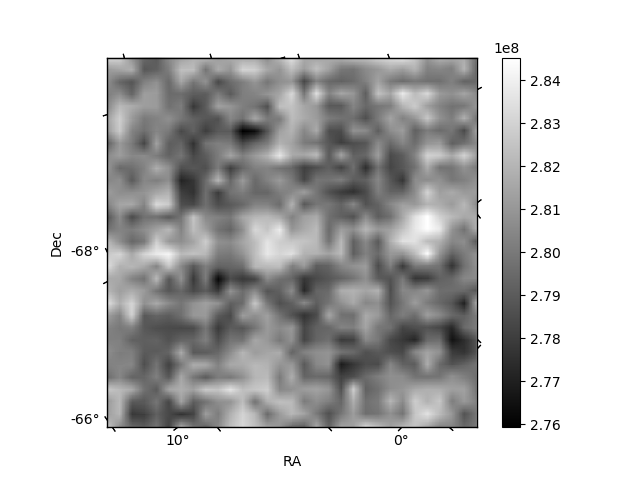
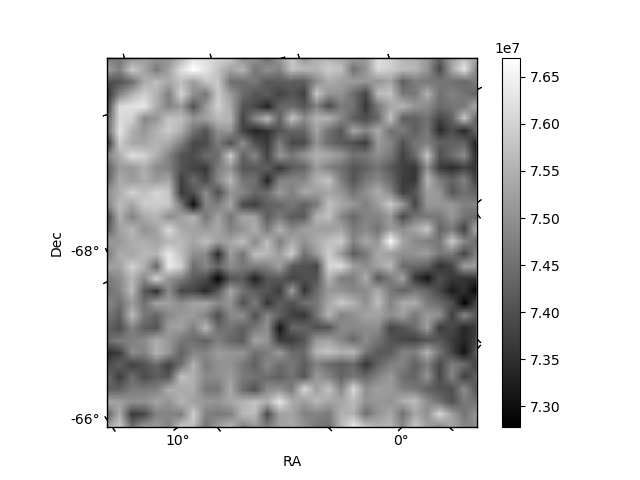
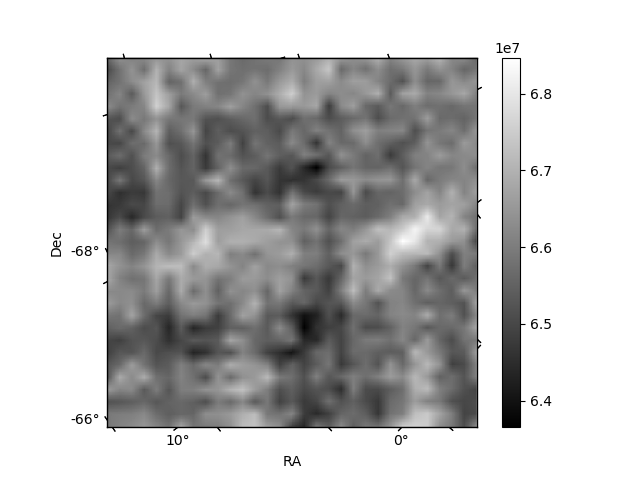
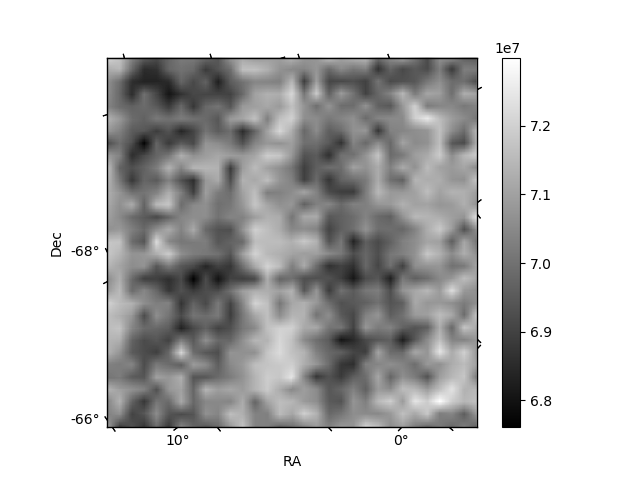
Histogram calculated using DETX and DETY for each event in the final _common_clean file
| Quadrant A | 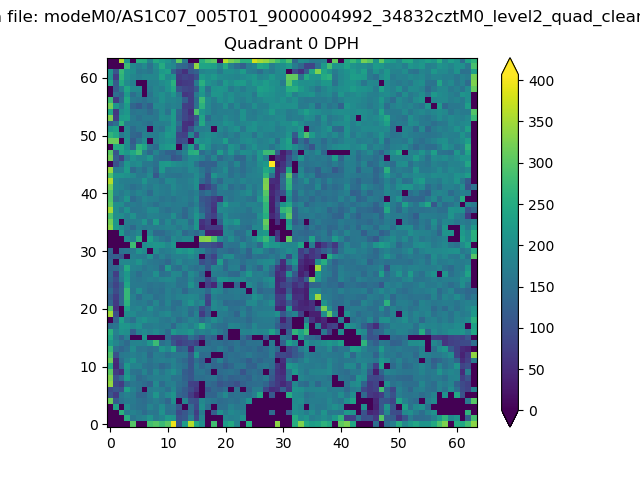 |
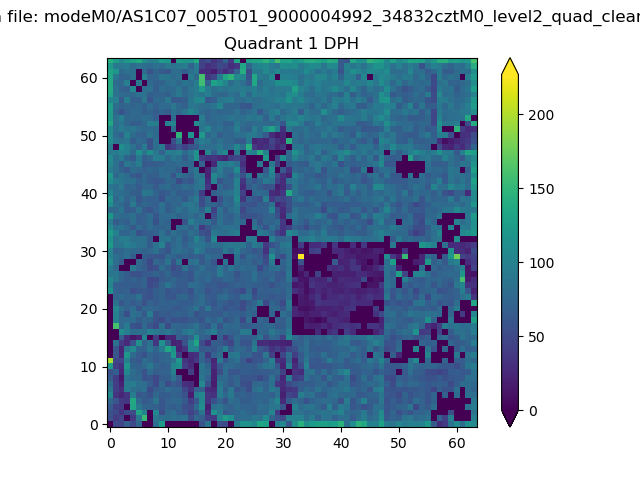 |
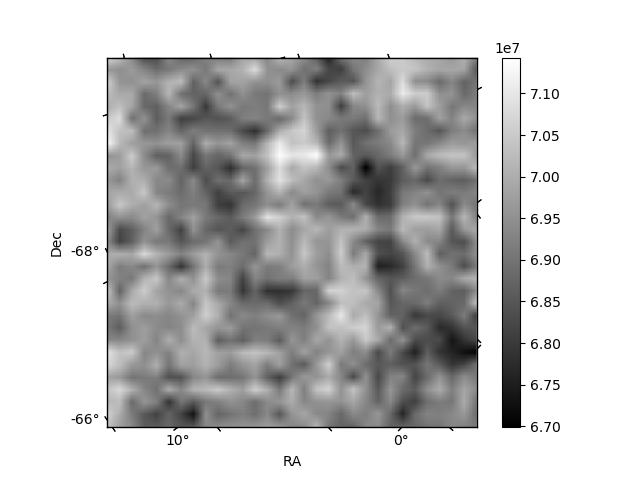
Quadrant B |
|---|---|---|---|
| Quadrant D | 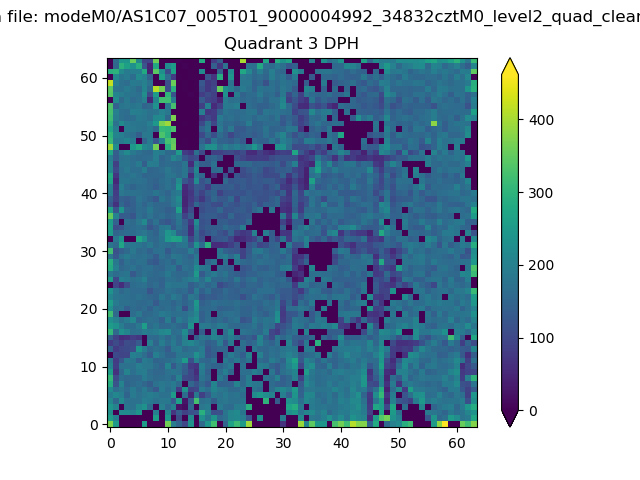 |
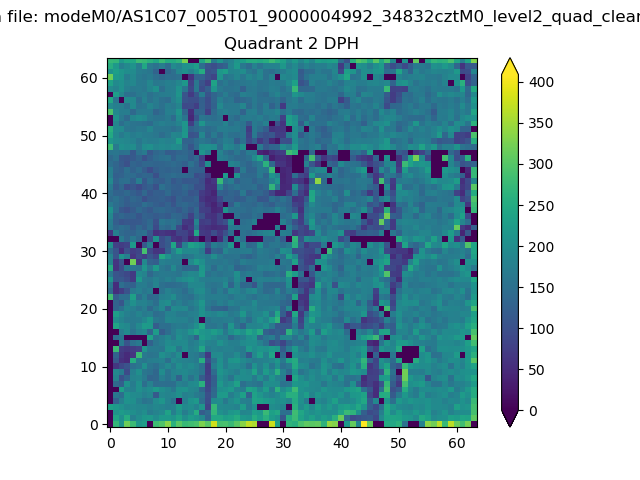 |
Quadrant C |
| Plot type | Count rate plots | Images |
|---|---|---|
| Comparison with Poisson distribution Blue bars denote a histogram of data divided into 1 sec bins. Red curve is a Poisson curve with rate = median count rate of data. |
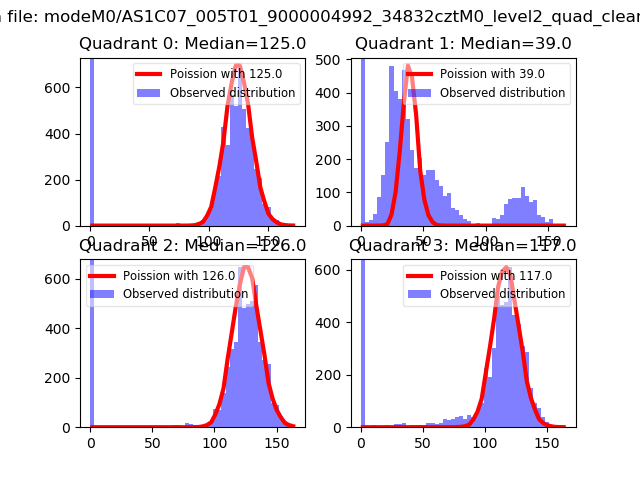 |
 |
| Quadrant-wise count rates Data is divided into 100 sec bins |
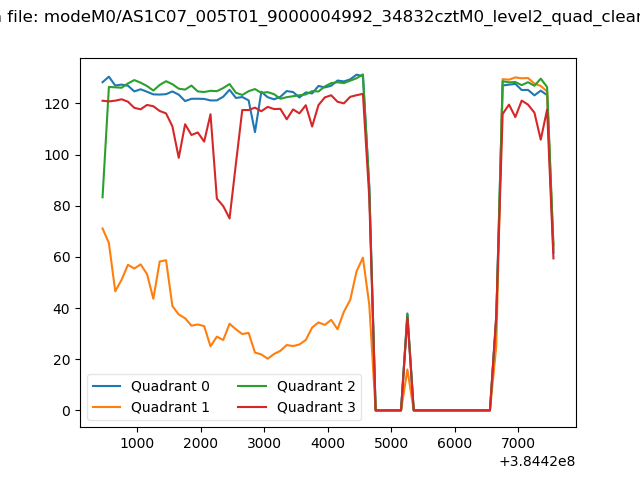 |
|
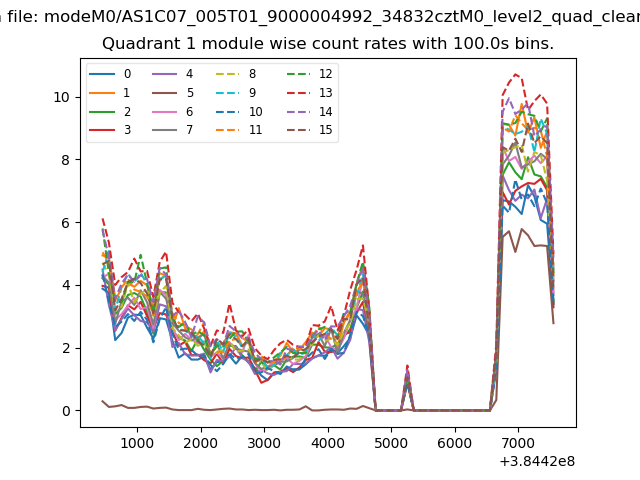
| Module-wise count rates for Quadrant A Data is divided into 100 sec bins |
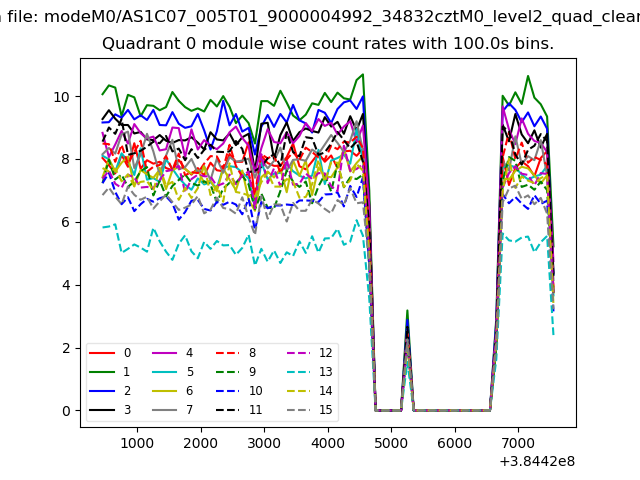 |
 |
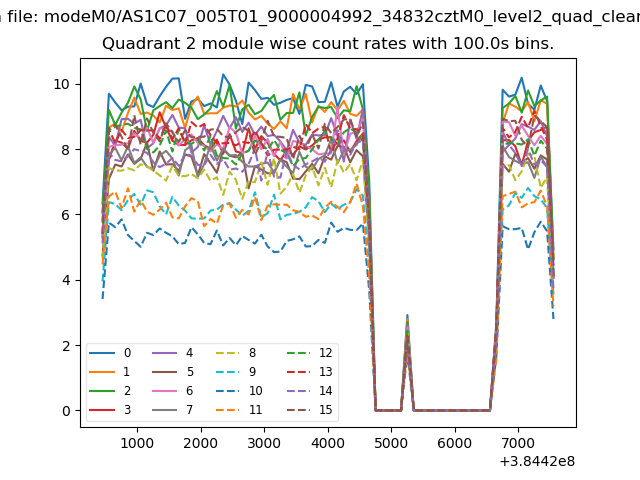
| Module-wise count rates for Quadrant B Data is divided into 100 sec bins |
 |
 |
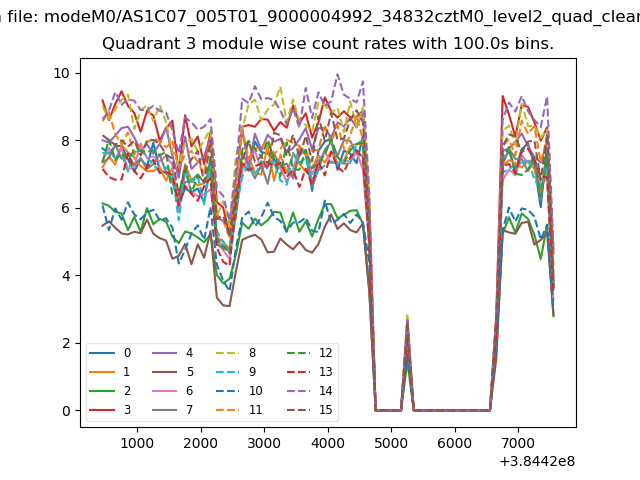
| Module-wise count rates for Quadrant C Data is divided into 100 sec bins |
 |
 |
| Module-wise count rates for Quadrant D Data is divided into 100 sec bins |
 |
 |
| Parameter | Plot |
|---|---|
| CZT HV Monitor | 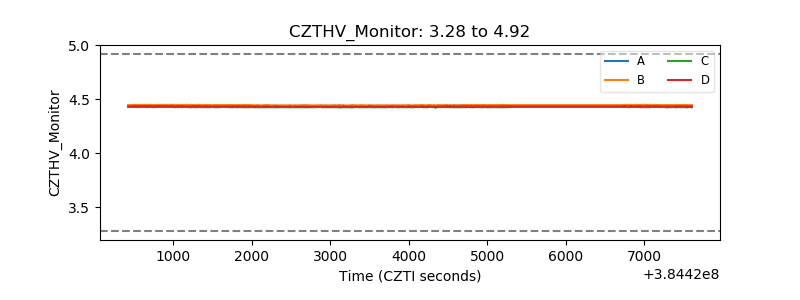 |
| D_VDD | 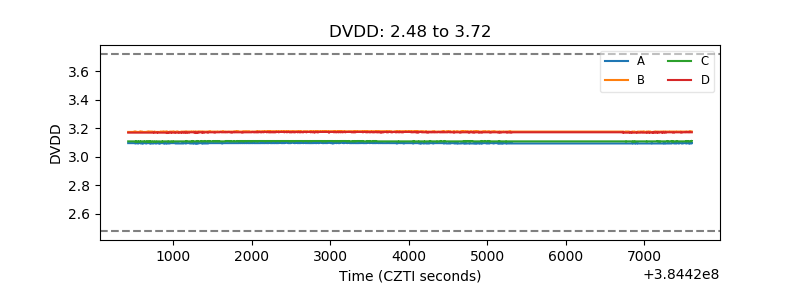 |
| Temperature 1 | 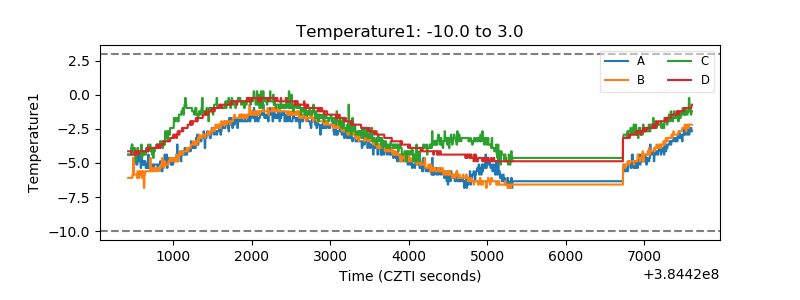 |
| Veto HV Monitor |  |
| Veto LLD | 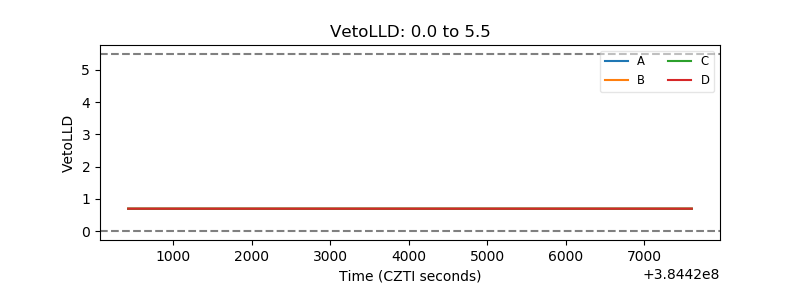 |
| Alpha Counter | 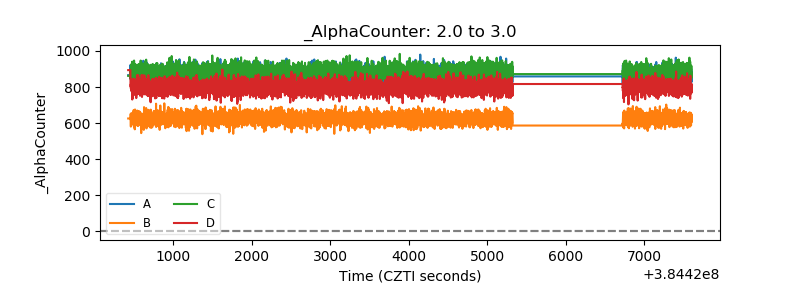 |
| _CPM_Rate | 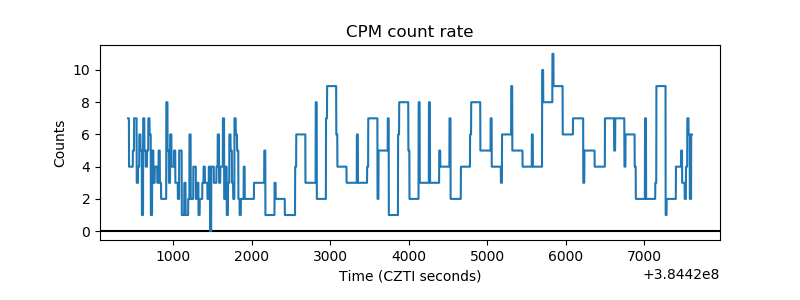 |
| CZT Counter | 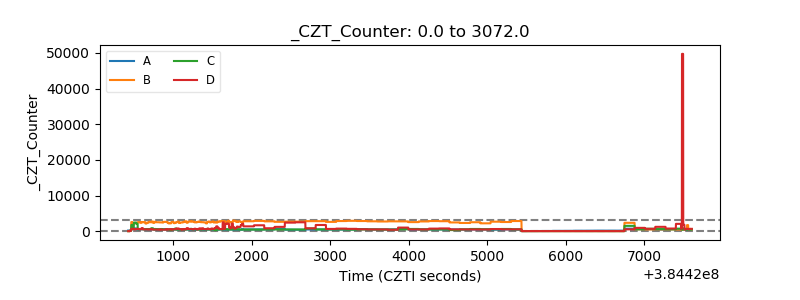 |
| +2.5 Volts monitor | 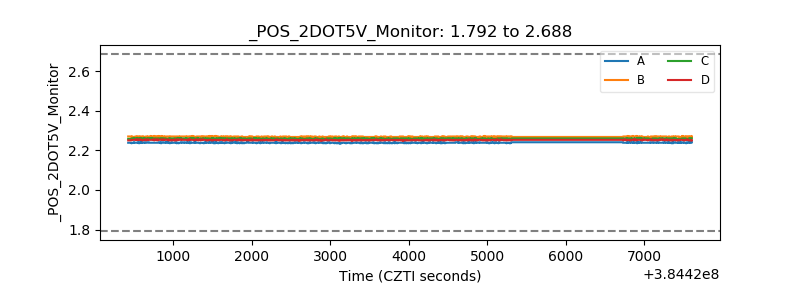 |
| +5 Volts monitor | 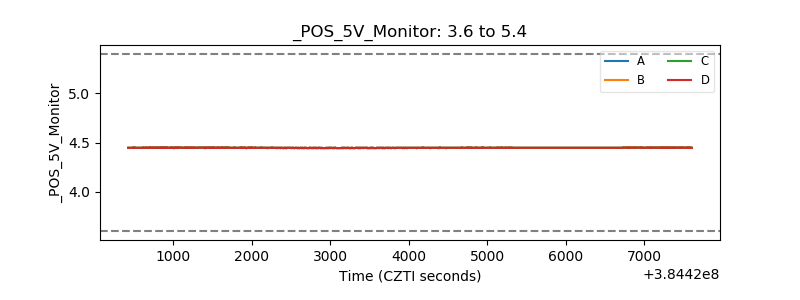 |
| _ROLL_ROT | 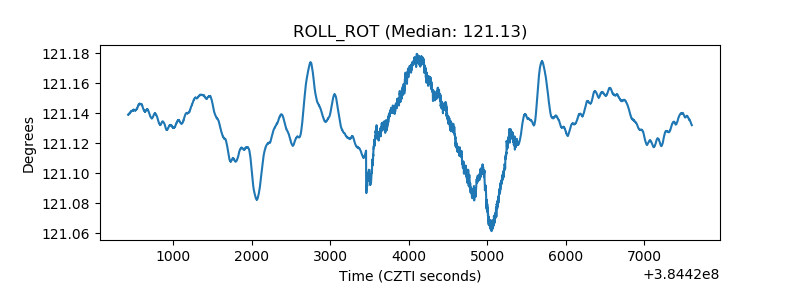 |
| _Roll_DEC | 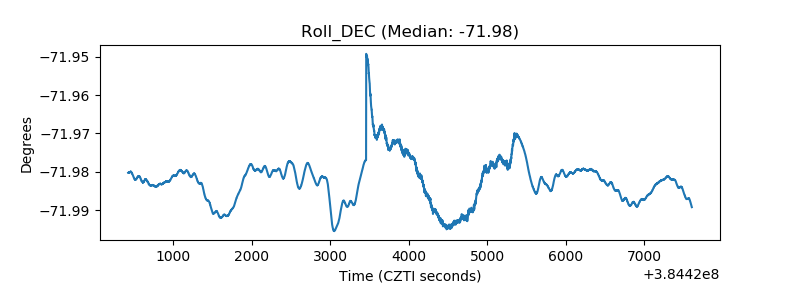 |
| _Roll_RA | 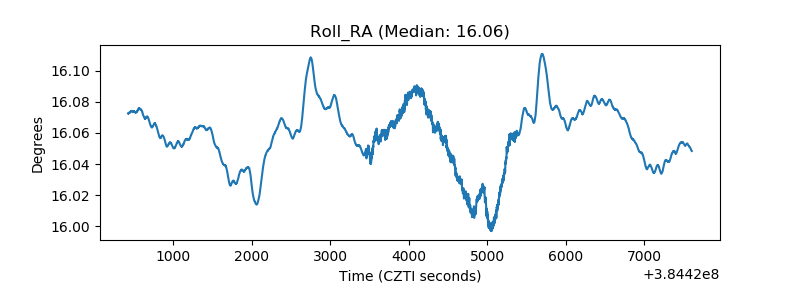 |
| Veto Counter | 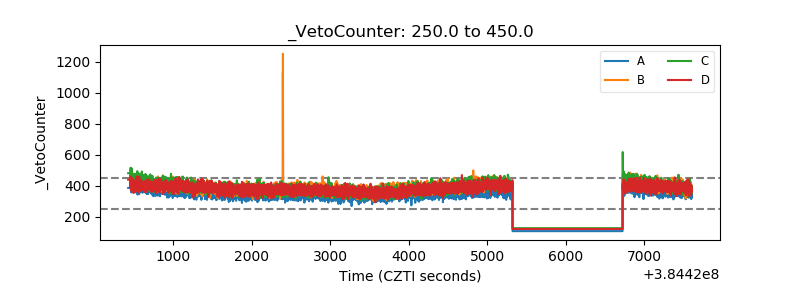 |