| Param | Original file | Final file |
|---|---|---|
| Filename | modeM0/AS1C07_005T01_9000004992_34830cztM0_level2.evt | modeM0/AS1C07_005T01_9000004992_34830cztM0_level2_quad_clean.evt |
| Size (bytes) | 946,560,960 | 79,810,560 |
| Size | 902.7 MB | 76.1 MB |
| Events in quadrant A | 2,744,234 | 690,913 |
| Events in quadrant B | 13,429,787 | 236,185 |
| Events in quadrant C | 2,832,279 | 689,622 |
| Events in quadrant D | 9,314,691 | 436,118 |
| Mode M9 | |||
|---|---|---|---|
| Quadrant | BADHDUFLAG | Total packets | Discarded packets |
| A | 0 | 22 | 0 |
| B | 0 | 22 | 0 |
| C | 0 | 22 | 0 |
| D | 0 | 23 | 0 |
| Mode M0 | |||
|---|---|---|---|
| Quadrant | BADHDUFLAG | Total packets | Discarded packets |
| A | 0 | 11260 | 3 |
| B | 0 | 43413 | 2 |
| C | 0 | 11282 | 2 |
| D | 0 | 31186 | 2 |
| Mode SS | |||
|---|---|---|---|
| Quadrant | BADHDUFLAG | Total packets | Discarded packets |
| A | 0 | 106 | 0 |
| B | 0 | 106 | 0 |
| C | 0 | 106 | 0 |
| D | 0 | 106 | 0 |
| Quadrant | Total seconds | Saturated seconds | Saturation percentage |
|---|---|---|---|
| A | 5136 | 5 | 0.097352% |
| B | 5136 | 5136 | 100.000000% |
| C | 5136 | 68 | 1.323988% |
| D | 5136 | 2966 | 57.749221% |
Noise dominated data is calculated using 1-second bins in cleaned event files. If a bin has >2000 counts, and if more than 50% of those come from <1% of pixels, then it is considered to be noise-dominated and hence unusable.
| Quadrant | # 1 sec bins | Bins with >0 counts | Bins with >2000 counts | High rate bins dominated by noise | Noise dominated (total time) | Noise dominated (detector-on time) | Marked lightcurve |
|---|---|---|---|---|---|---|---|
| A | 7139 | 5137 | 0 | 0 | 0.00% | 0.00% | 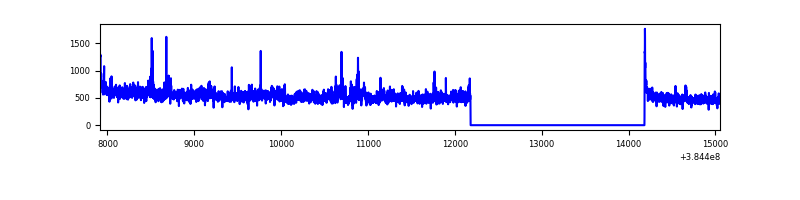 |
| B | 7138 | 5135 | 5092 | 5092 | 71.34% | 99.16% | 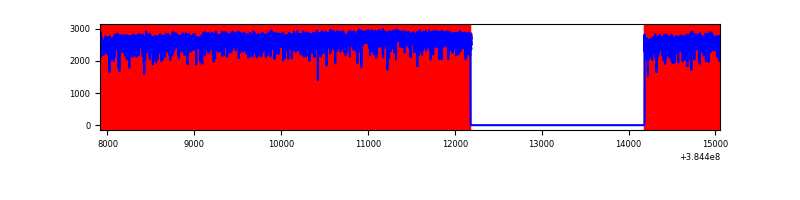 |
| C | 7139 | 5137 | 48 | 48 | 0.67% | 0.93% | 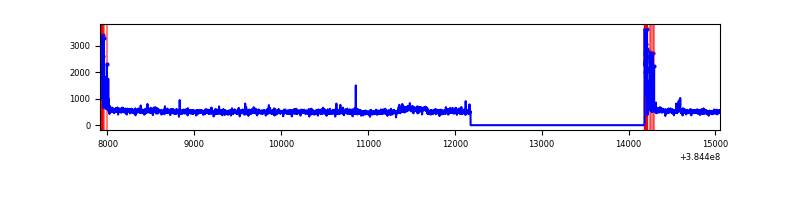 |
| D | 7139 | 5137 | 2798 | 2798 | 39.19% | 54.47% | 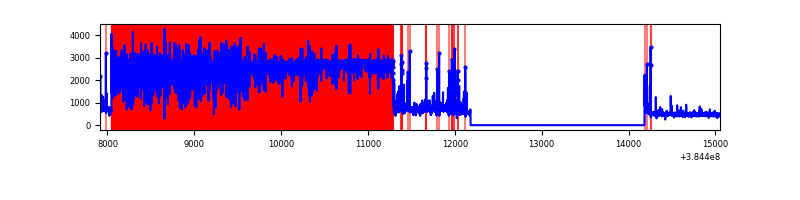 |
Top three noisy pixels from each quadrant. If the there are fewer than three noisy pixels in the level2.evt file, extra rows are filled as -1
| Pixel properties | Quadrant properties | ||||||
|---|---|---|---|---|---|---|---|
| Quadrant | DetID | PixID | Counts | Sigma | Mean | Median | Sigma |
| A | 15 | 169 | 221029 | 1812.79 | 609 | 597 | 121.6 |
| A | 2 | 79 | 61490 | 500.77 | 609 | 597 | 121.6 |
| A | 10 | 83 | 50643 | 411.57 | 609 | 597 | 121.6 |
| B | 5 | 14 | 4084030 | 92865.02 | 227 | 221 | 44.0 |
| B | 5 | 31 | 4043993 | 91954.58 | 227 | 221 | 44.0 |
| B | 5 | 15 | 4036069 | 91774.39 | 227 | 221 | 44.0 |
| C | 15 | 214 | 240566 | 1767.05 | 593 | 600 | 135.8 |
| C | 0 | 10 | 184581 | 1354.79 | 593 | 600 | 135.8 |
| C | 14 | 67 | 69118 | 504.55 | 593 | 600 | 135.8 |
| D | 14 | 52 | 6101096 | 58552.15 | 428 | 416 | 104.2 |
| D | 14 | 226 | 444379 | 4261.0 | 428 | 416 | 104.2 |
| D | 10 | 204 | 373285 | 3578.66 | 428 | 416 | 104.2 |
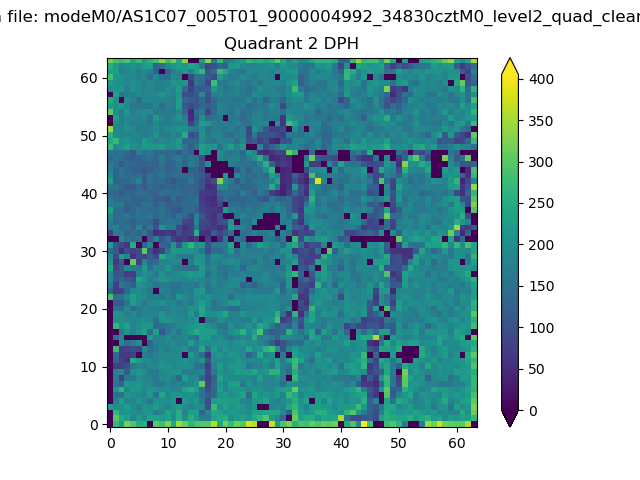
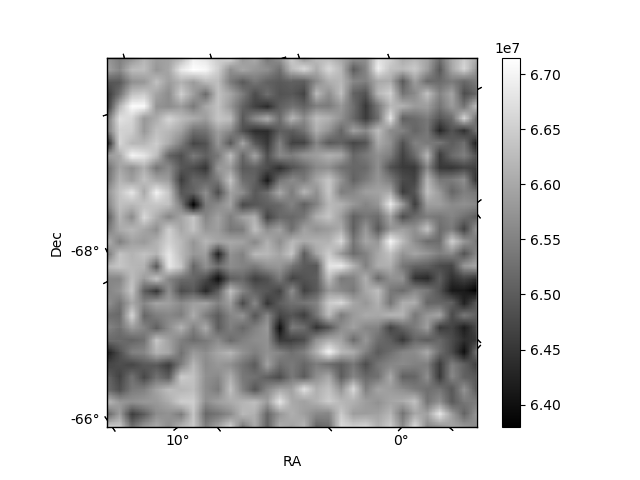
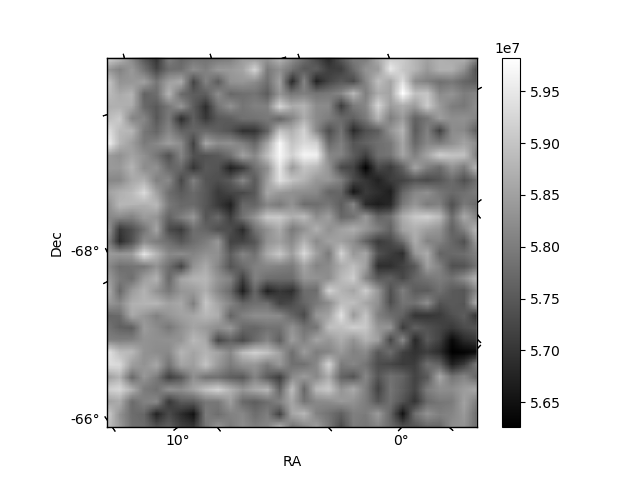
Histogram calculated using DETX and DETY for each event in the final _common_clean file
| Quadrant A | 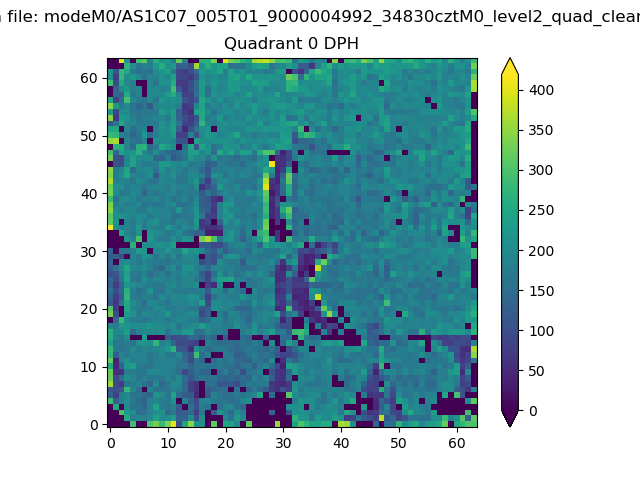 |
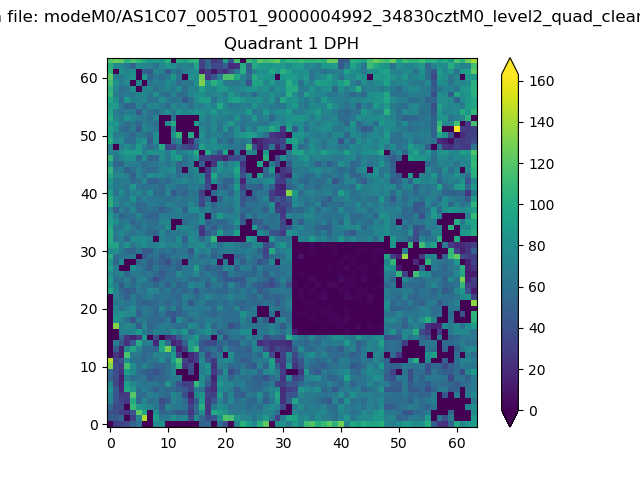 |
Quadrant B |
|---|---|---|---|
| Quadrant D | 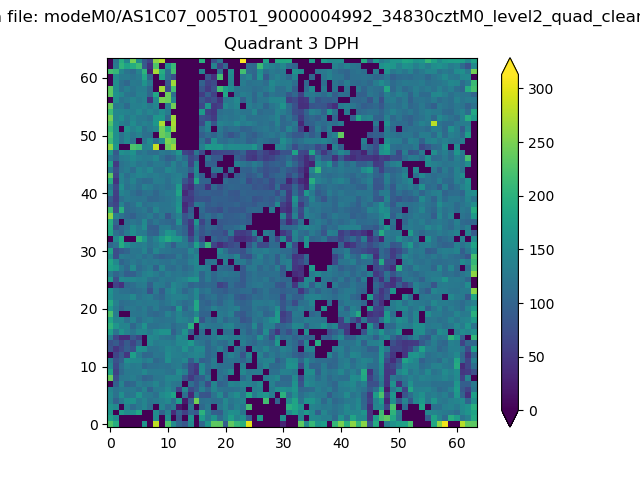 |
 |
Quadrant C |
| Plot type | Count rate plots | Images |
|---|---|---|
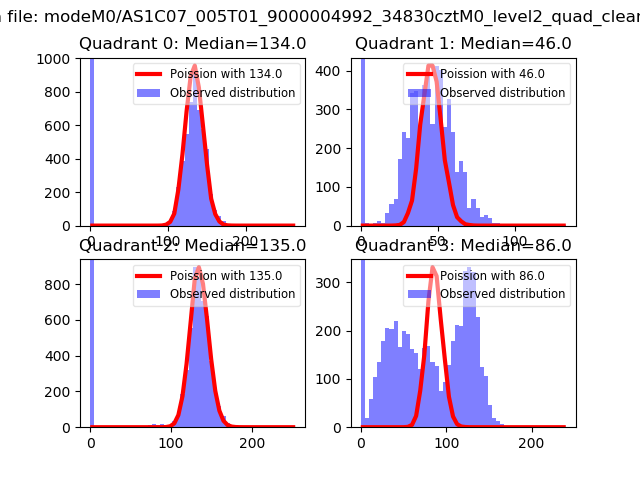
| Comparison with Poisson distribution Blue bars denote a histogram of data divided into 1 sec bins. Red curve is a Poisson curve with rate = median count rate of data. |
 |
 |
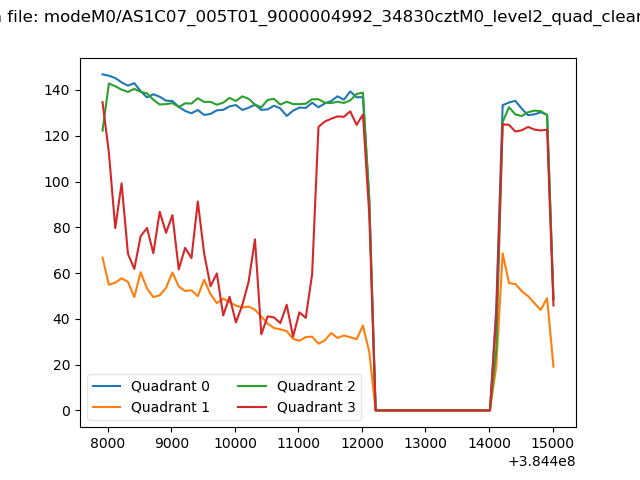
| Quadrant-wise count rates Data is divided into 100 sec bins |
 |
|
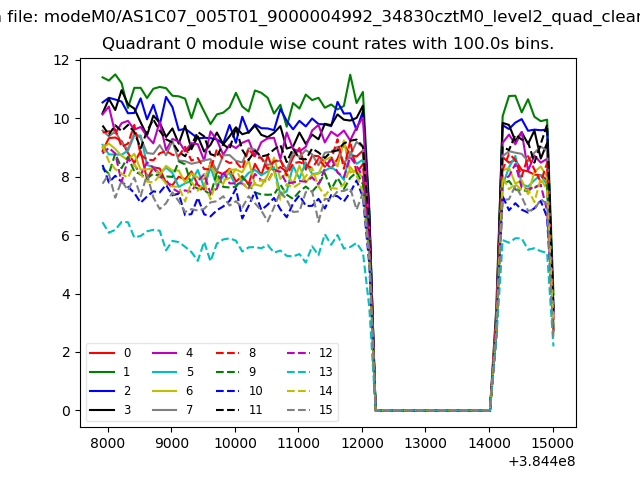
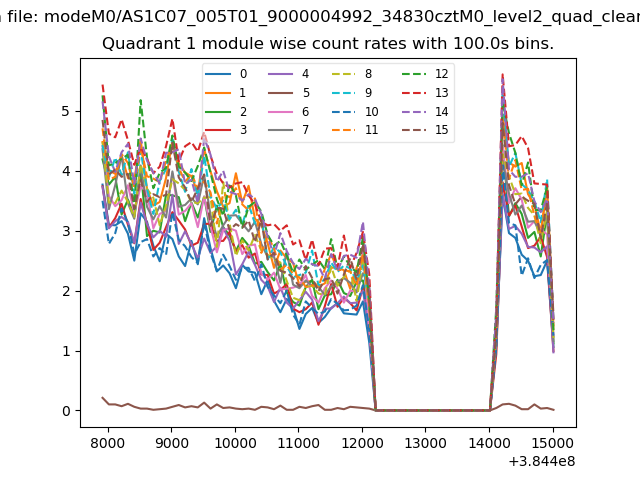
| Module-wise count rates for Quadrant A Data is divided into 100 sec bins |
 |
 |
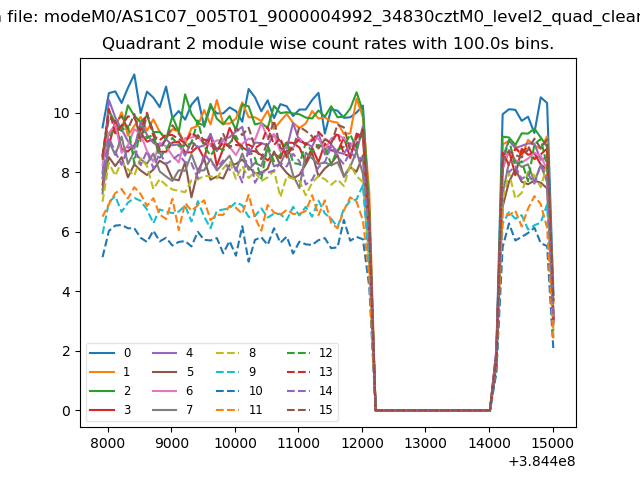
| Module-wise count rates for Quadrant B Data is divided into 100 sec bins |
 |
 |
| Module-wise count rates for Quadrant C Data is divided into 100 sec bins |
 |
 |
| Module-wise count rates for Quadrant D Data is divided into 100 sec bins |
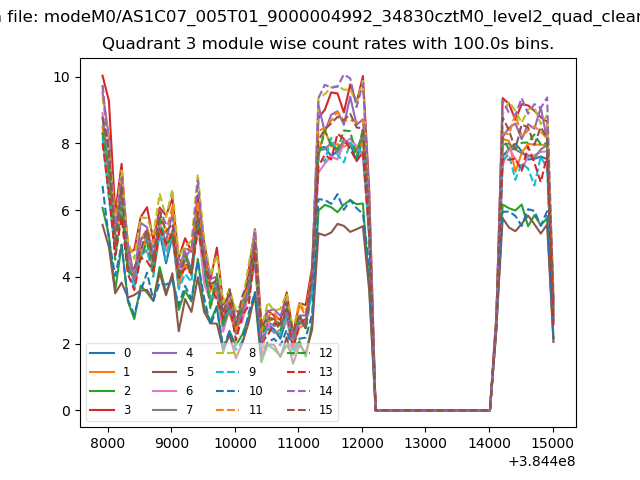 |
 |
| Parameter | Plot |
|---|---|
| CZT HV Monitor | 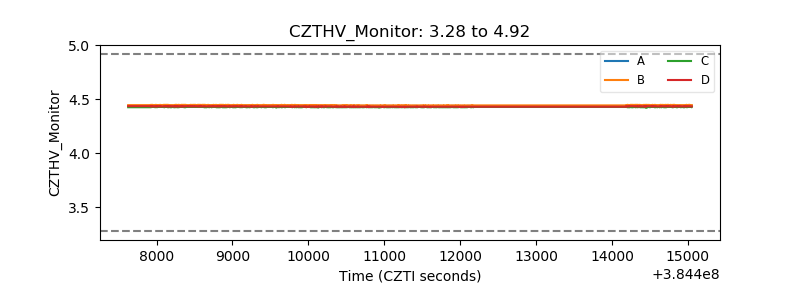 |
| D_VDD | 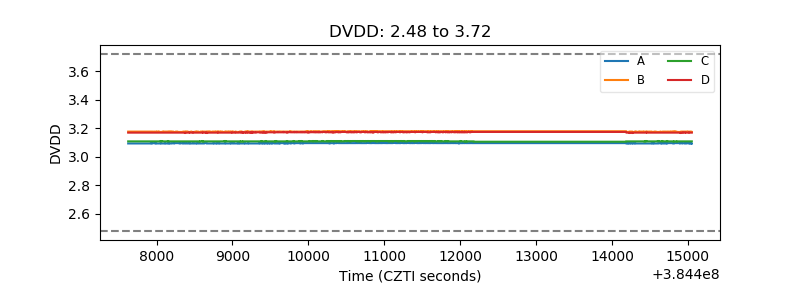 |
| Temperature 1 | 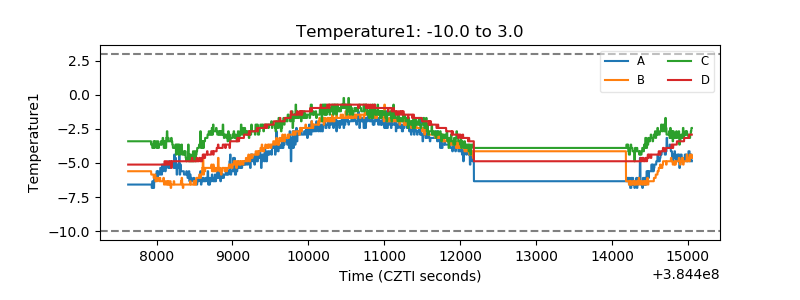 |
| Veto HV Monitor |  |
| Veto LLD | 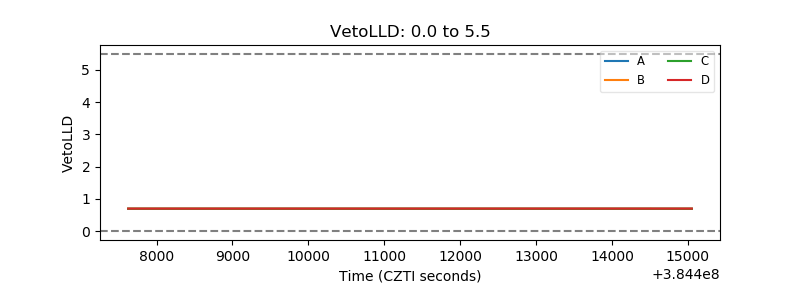 |
| Alpha Counter | 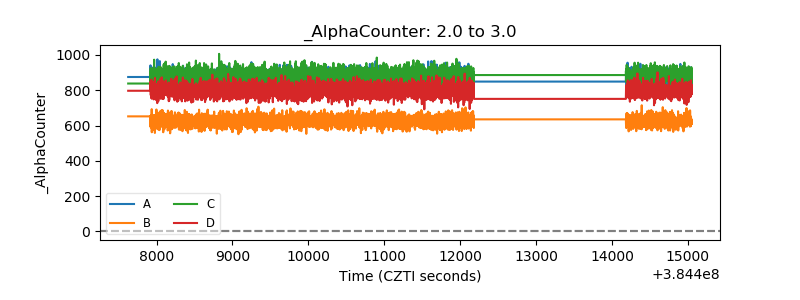 |
| _CPM_Rate | 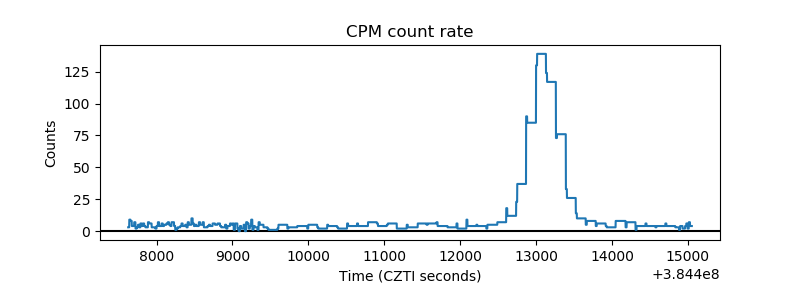 |
| CZT Counter | 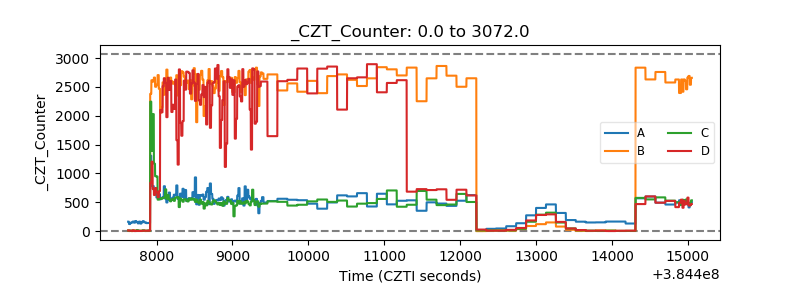 |
| +2.5 Volts monitor | 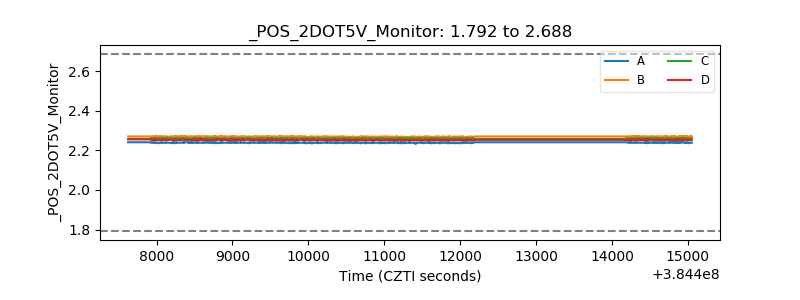 |
| +5 Volts monitor | 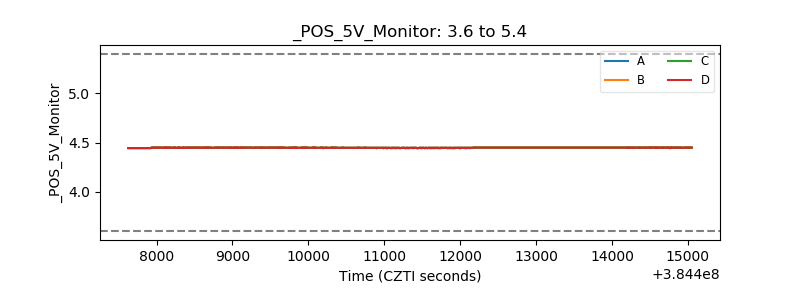 |
| _ROLL_ROT | 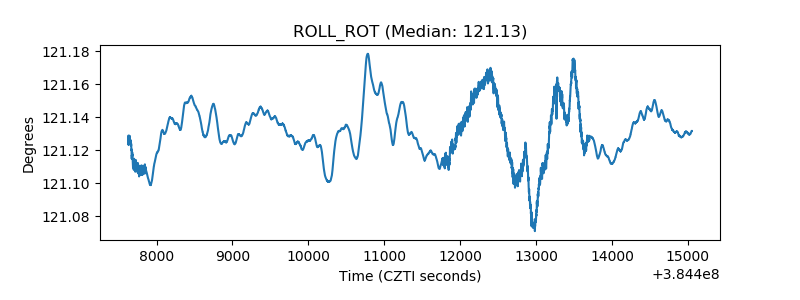 |
| _Roll_DEC | 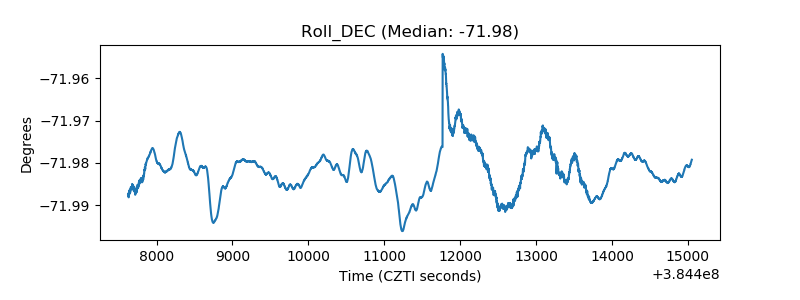 |
| _Roll_RA | 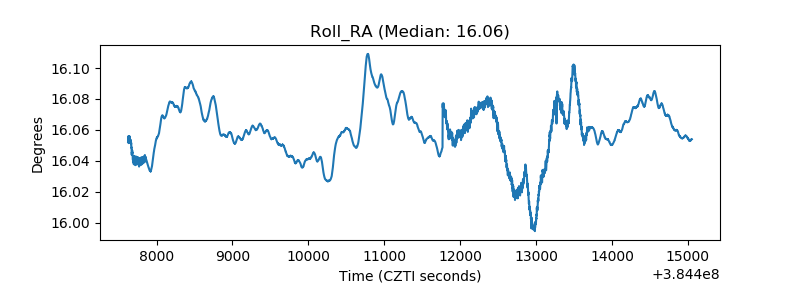 |
| Veto Counter | 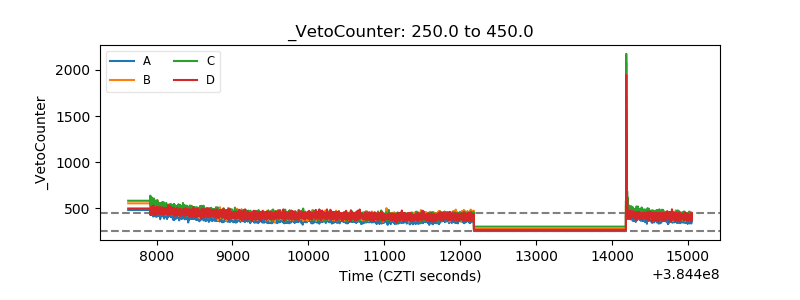 |