| Param | Original file | Final file |
|---|---|---|
| Filename | modeM0/AS1C07_005T01_9000004992_34827cztM0_level2.evt | modeM0/AS1C07_005T01_9000004992_34827cztM0_level2_quad_clean.evt |
| Size (bytes) | 788,146,560 | 73,992,960 |
| Size | 751.6 MB | 70.6 MB |
| Events in quadrant A | 2,888,168 | 585,495 |
| Events in quadrant B | 12,878,521 | 204,390 |
| Events in quadrant C | 3,005,980 | 579,949 |
| Events in quadrant D | 4,758,158 | 517,479 |
| Mode M9 | |||
|---|---|---|---|
| Quadrant | BADHDUFLAG | Total packets | Discarded packets |
| A | 0 | 27 | 0 |
| B | 0 | 27 | 0 |
| C | 0 | 27 | 0 |
| D | 0 | 28 | 0 |
| Mode M0 | |||
|---|---|---|---|
| Quadrant | BADHDUFLAG | Total packets | Discarded packets |
| A | 0 | 11562 | 3 |
| B | 0 | 41695 | 2 |
| C | 0 | 12127 | 2 |
| D | 0 | 17701 | 2 |
| Mode SS | |||
|---|---|---|---|
| Quadrant | BADHDUFLAG | Total packets | Discarded packets |
| A | 0 | 102 | 0 |
| B | 0 | 102 | 0 |
| C | 0 | 102 | 0 |
| D | 0 | 102 | 0 |
| Quadrant | Total seconds | Saturated seconds | Saturation percentage |
|---|---|---|---|
| A | 5009 | 31 | 0.618886% |
| B | 5009 | 5009 | 100.000000% |
| C | 5009 | 54 | 1.078059% |
| D | 5009 | 500 | 9.982032% |
Noise dominated data is calculated using 1-second bins in cleaned event files. If a bin has >2000 counts, and if more than 50% of those come from <1% of pixels, then it is considered to be noise-dominated and hence unusable.
| Quadrant | # 1 sec bins | Bins with >0 counts | Bins with >2000 counts | High rate bins dominated by noise | Noise dominated (total time) | Noise dominated (detector-on time) | Marked lightcurve |
|---|---|---|---|---|---|---|---|
| A | 7072 | 5010 | 18 | 18 | 0.25% | 0.36% | 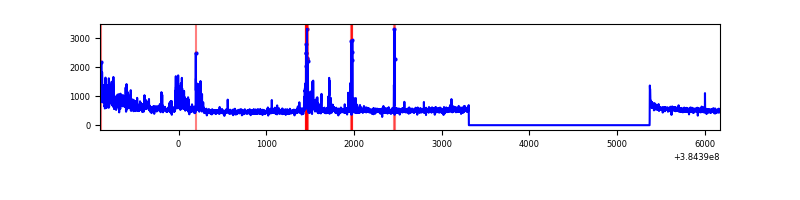 |
| B | 7071 | 5008 | 4946 | 4946 | 69.95% | 98.76% | 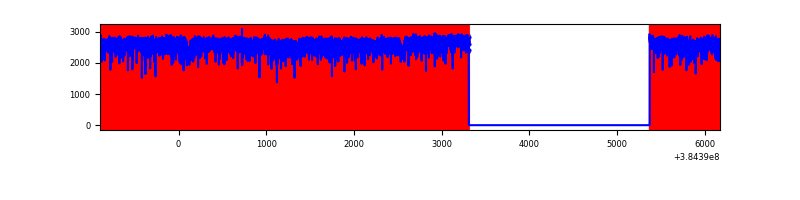 |
| C | 7072 | 5010 | 41 | 41 | 0.58% | 0.82% | 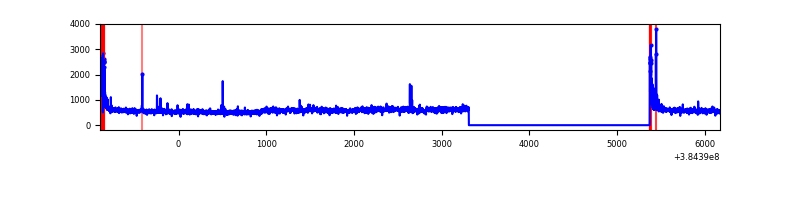 |
| D | 7071 | 5009 | 461 | 461 | 6.52% | 9.20% | 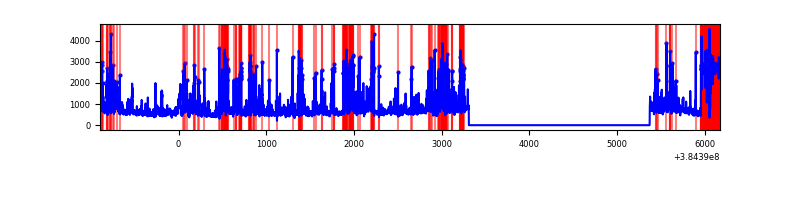 |
Top three noisy pixels from each quadrant. If the there are fewer than three noisy pixels in the level2.evt file, extra rows are filled as -1
| Pixel properties | Quadrant properties | ||||||
|---|---|---|---|---|---|---|---|
| Quadrant | DetID | PixID | Counts | Sigma | Mean | Median | Sigma |
| A | 15 | 169 | 273844 | 2207.34 | 628 | 618 | 123.8 |
| A | 15 | 174 | 85253 | 683.75 | 628 | 618 | 123.8 |
| A | 10 | 83 | 48679 | 388.27 | 628 | 618 | 123.8 |
| B | 5 | 14 | 3674399 | 80032.18 | 238 | 233 | 45.9 |
| B | 5 | 31 | 3606995 | 78563.96 | 238 | 233 | 45.9 |
| B | 5 | 15 | 3597048 | 78347.29 | 238 | 233 | 45.9 |
| C | 15 | 214 | 232162 | 1653.47 | 616 | 620 | 140.0 |
| C | 14 | 67 | 184394 | 1312.35 | 616 | 620 | 140.0 |
| C | 0 | 10 | 156231 | 1111.24 | 616 | 620 | 140.0 |
| D | 14 | 52 | 1502580 | 10624.07 | 585 | 570 | 141.4 |
| D | 8 | 195 | 326083 | 2302.43 | 585 | 570 | 141.4 |
| D | 14 | 226 | 115883 | 815.64 | 585 | 570 | 141.4 |
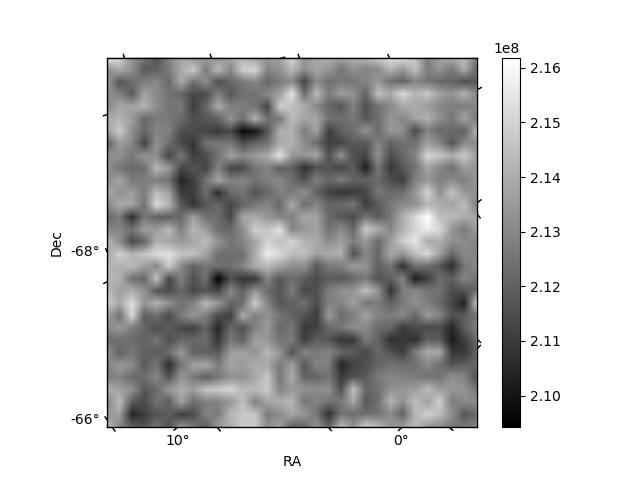
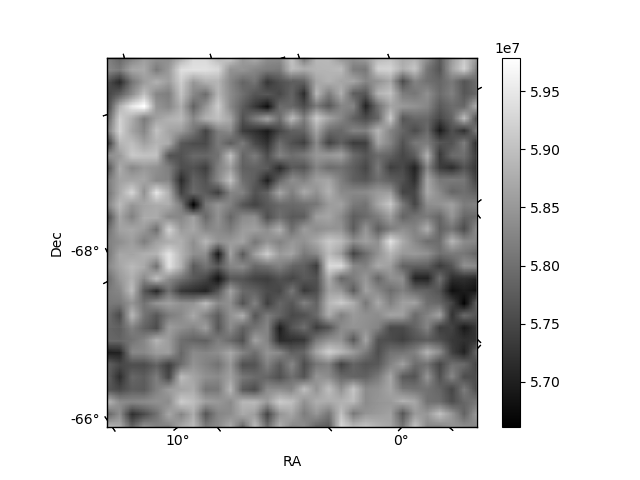
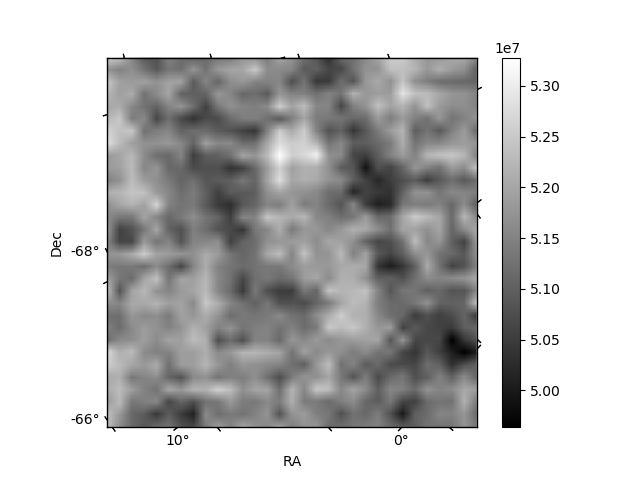
Histogram calculated using DETX and DETY for each event in the final _common_clean file
| Quadrant A | 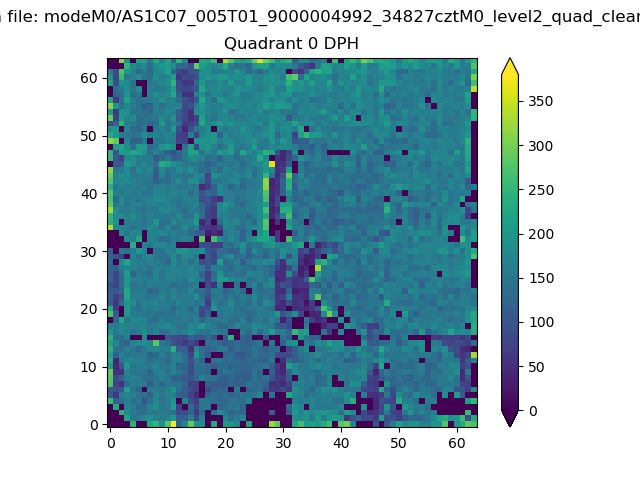 |
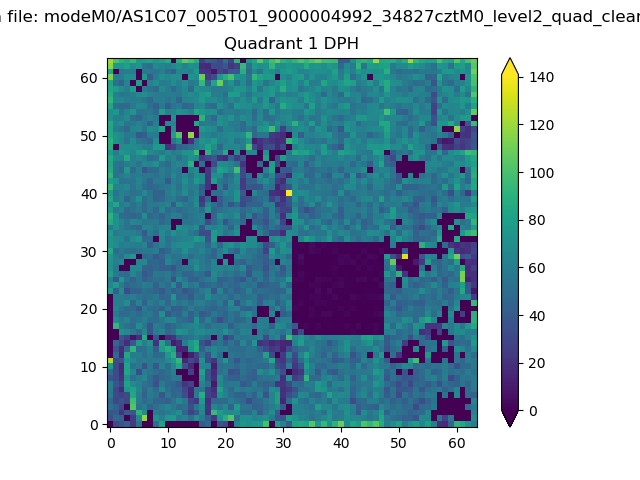 |
Quadrant B |
|---|---|---|---|
| Quadrant D | 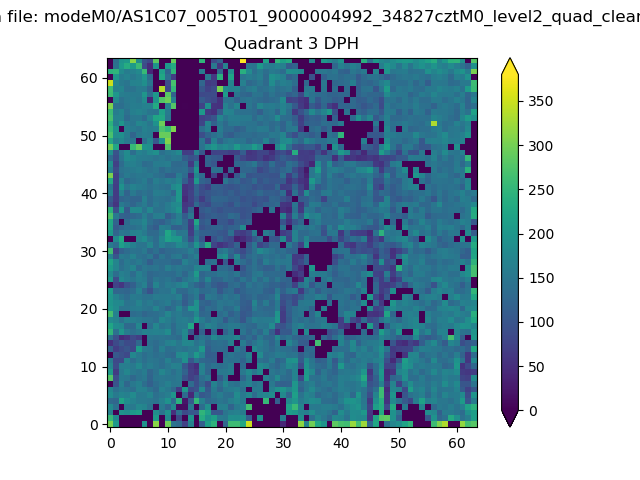 |
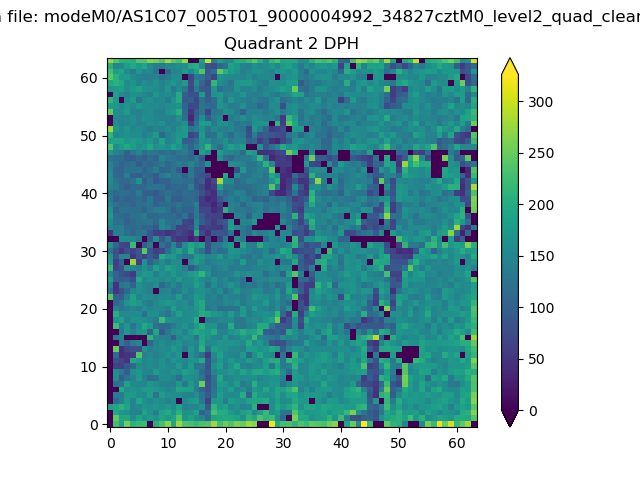 |
Quadrant C |
| Plot type | Count rate plots | Images |
|---|---|---|
| Comparison with Poisson distribution Blue bars denote a histogram of data divided into 1 sec bins. Red curve is a Poisson curve with rate = median count rate of data. |
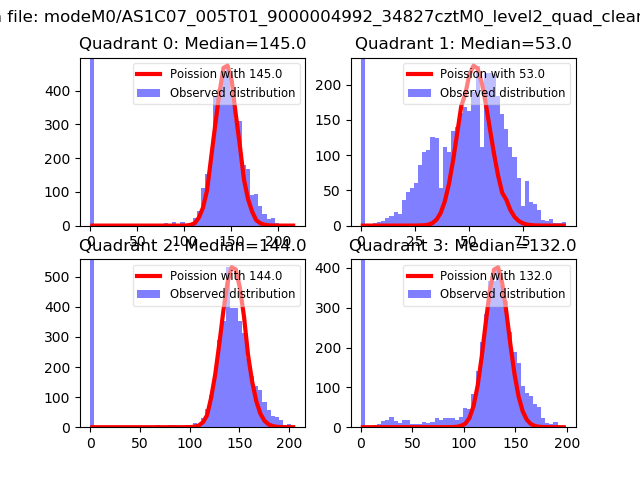 |
 |
| Quadrant-wise count rates Data is divided into 100 sec bins |
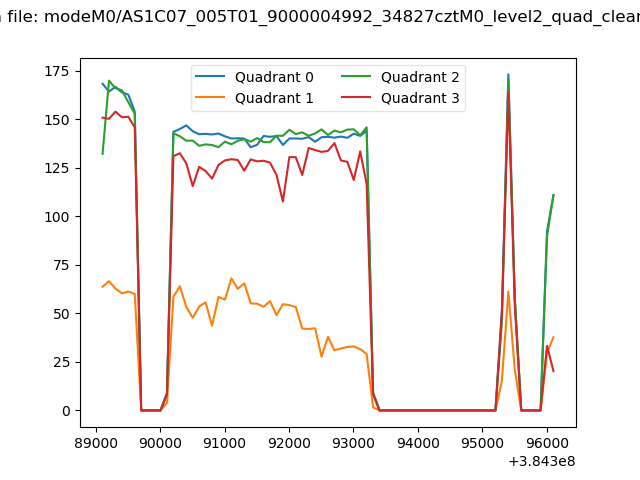 |
|
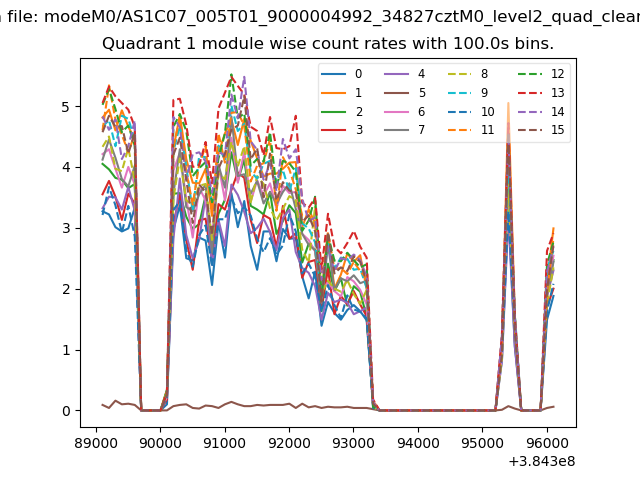
| Module-wise count rates for Quadrant A Data is divided into 100 sec bins |
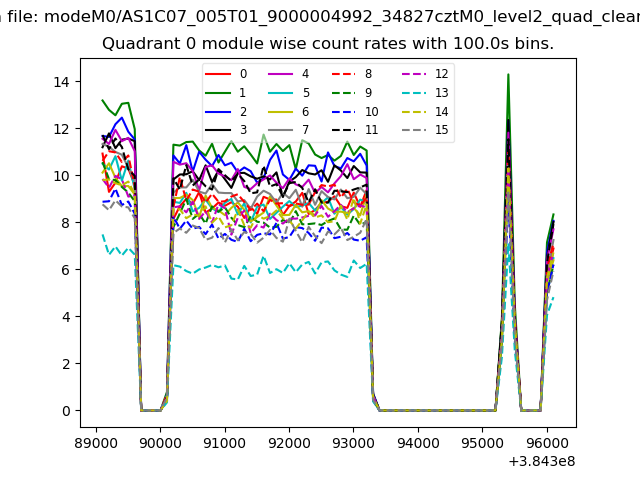 |
 |
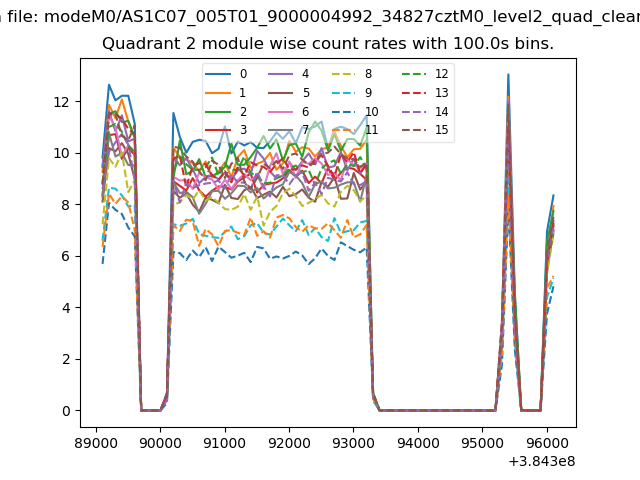
| Module-wise count rates for Quadrant B Data is divided into 100 sec bins |
 |
 |
| Module-wise count rates for Quadrant C Data is divided into 100 sec bins |
 |
 |
| Module-wise count rates for Quadrant D Data is divided into 100 sec bins |
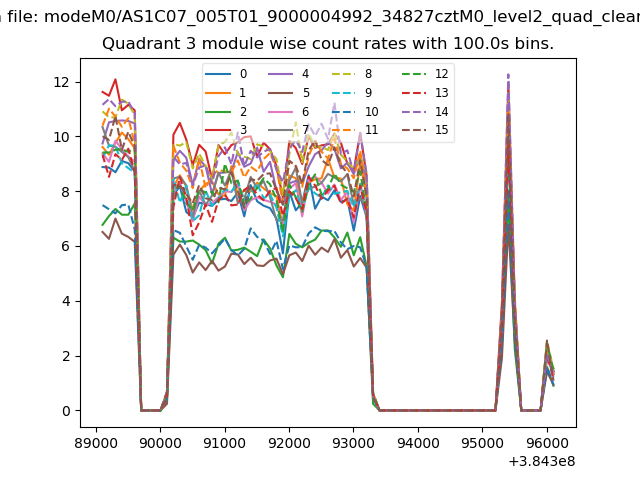 |
 |
| Parameter | Plot |
|---|---|
| CZT HV Monitor | 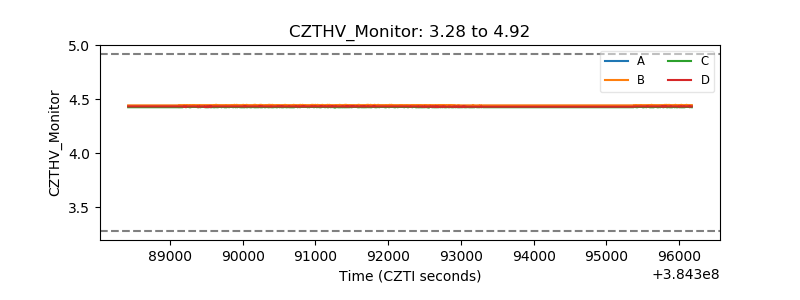 |
| D_VDD | 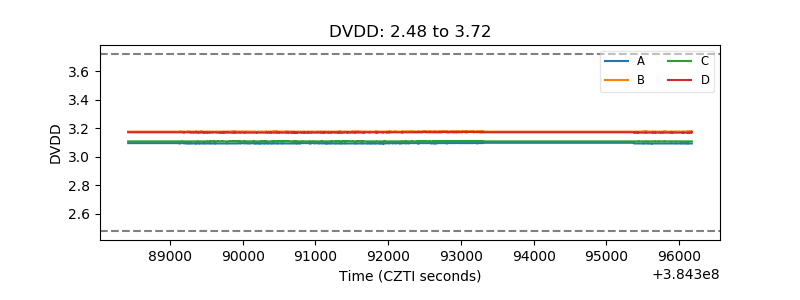 |
| Temperature 1 | 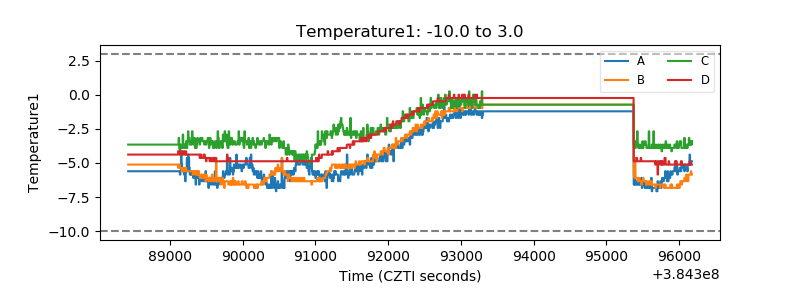 |
| Veto HV Monitor | 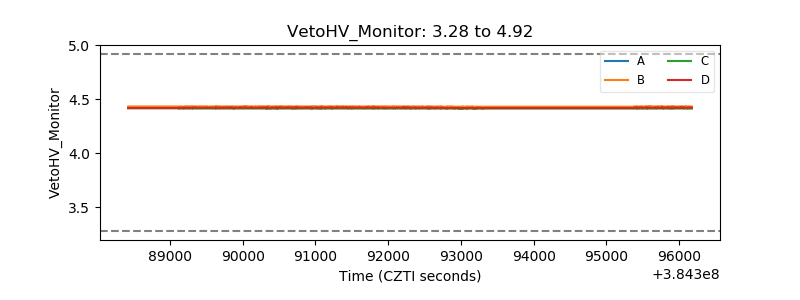 |
| Veto LLD | 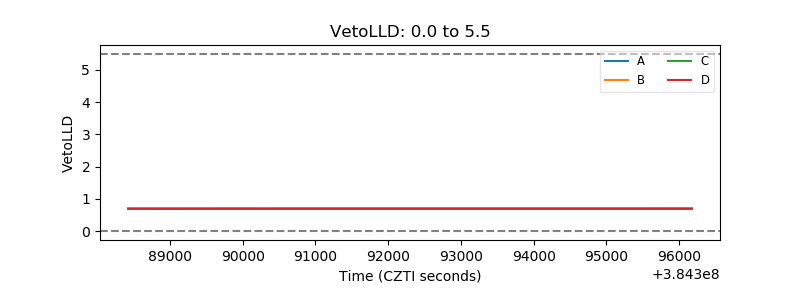 |
| Alpha Counter | 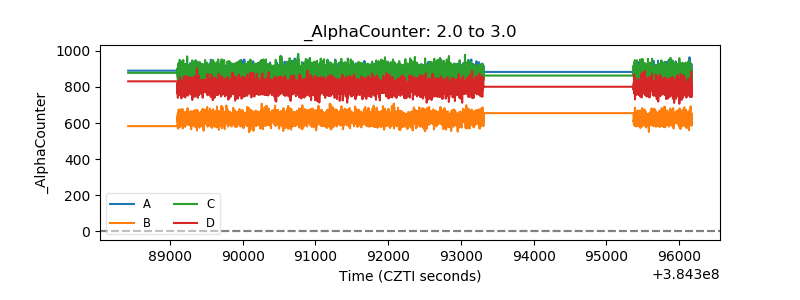 |
| _CPM_Rate | 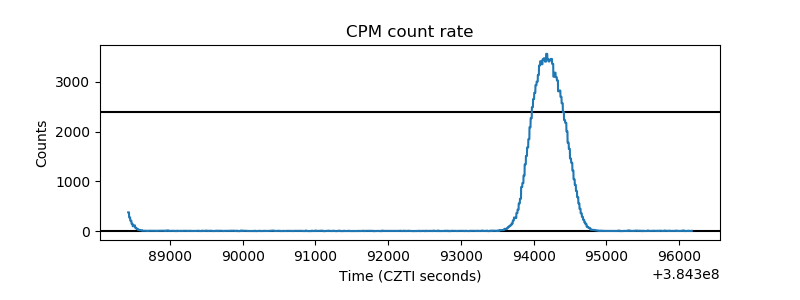 |
| CZT Counter | 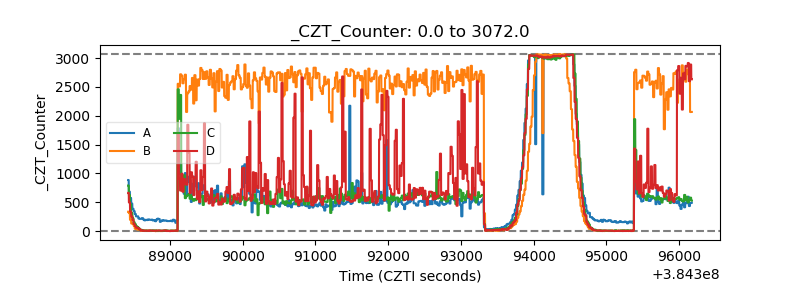 |
| +2.5 Volts monitor | 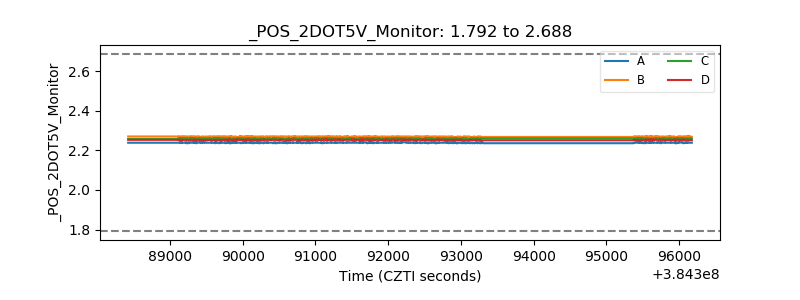 |
| +5 Volts monitor | 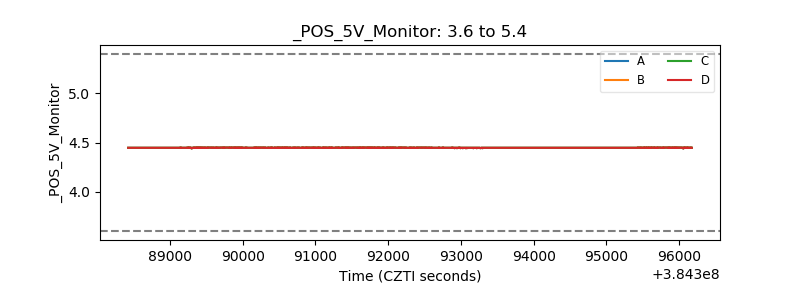 |
| _ROLL_ROT | 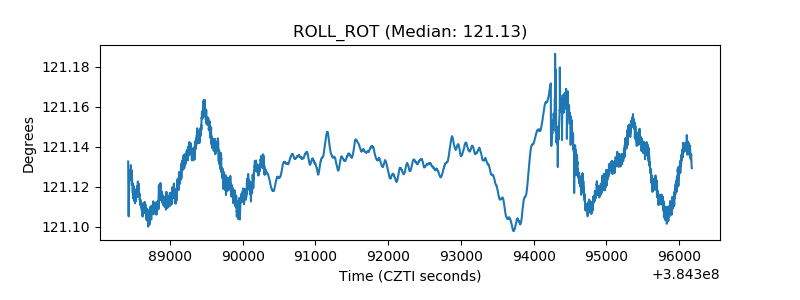 |
| _Roll_DEC | 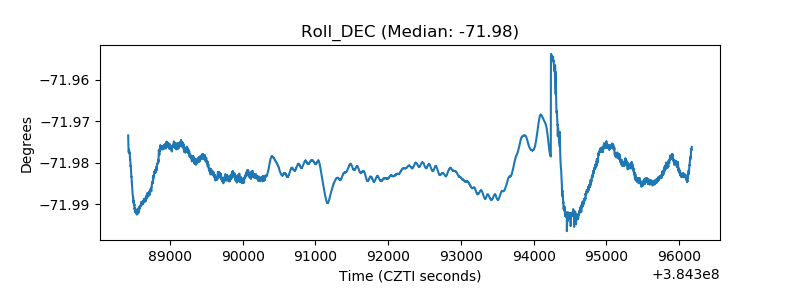 |
| _Roll_RA | 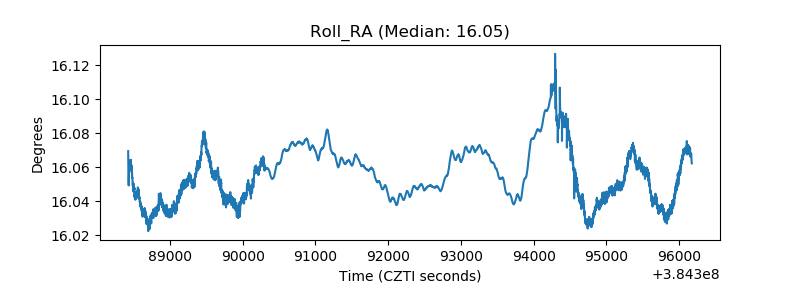 |
| Veto Counter | 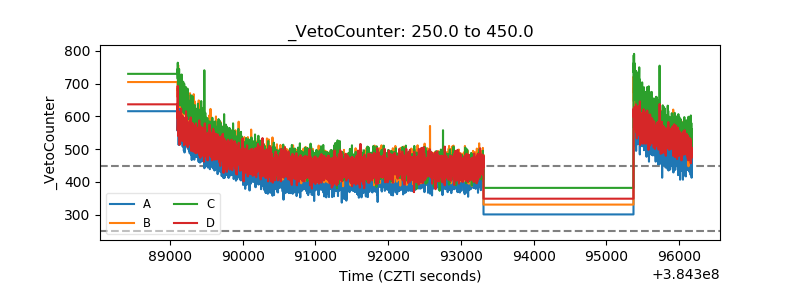 |