| Param | Original file | Final file |
|---|---|---|
| Filename | modeM0/AS1C07_005T01_9000004992_34823cztM0_level2.evt | modeM0/AS1C07_005T01_9000004992_34823cztM0_level2_quad_clean.evt |
| Size (bytes) | 817,035,840 | 80,861,760 |
| Size | 779.2 MB | 77.1 MB |
| Events in quadrant A | 4,402,060 | 622,803 |
| Events in quadrant B | 13,571,739 | 241,036 |
| Events in quadrant C | 2,899,437 | 617,916 |
| Events in quadrant D | 3,507,687 | 588,213 |
| Mode M9 | |||
|---|---|---|---|
| Quadrant | BADHDUFLAG | Total packets | Discarded packets |
| A | 0 | 18 | 0 |
| B | 0 | 18 | 0 |
| C | 0 | 18 | 0 |
| D | 0 | 19 | 0 |
| Mode M0 | |||
|---|---|---|---|
| Quadrant | BADHDUFLAG | Total packets | Discarded packets |
| A | 0 | 16861 | 3 |
| B | 0 | 43995 | 2 |
| C | 0 | 11868 | 2 |
| D | 0 | 14222 | 2 |
| Mode SS | |||
|---|---|---|---|
| Quadrant | BADHDUFLAG | Total packets | Discarded packets |
| A | 0 | 110 | 0 |
| B | 0 | 110 | 0 |
| C | 0 | 110 | 0 |
| D | 0 | 110 | 0 |
| Quadrant | Total seconds | Saturated seconds | Saturation percentage |
|---|---|---|---|
| A | 5373 | 177 | 3.294249% |
| B | 5373 | 5373 | 100.000000% |
| C | 5373 | 74 | 1.377257% |
| D | 5373 | 84 | 1.563372% |
Noise dominated data is calculated using 1-second bins in cleaned event files. If a bin has >2000 counts, and if more than 50% of those come from <1% of pixels, then it is considered to be noise-dominated and hence unusable.
| Quadrant | # 1 sec bins | Bins with >0 counts | Bins with >2000 counts | High rate bins dominated by noise | Noise dominated (total time) | Noise dominated (detector-on time) | Marked lightcurve |
|---|---|---|---|---|---|---|---|
| A | 7075 | 5374 | 99 | 99 | 1.40% | 1.84% | 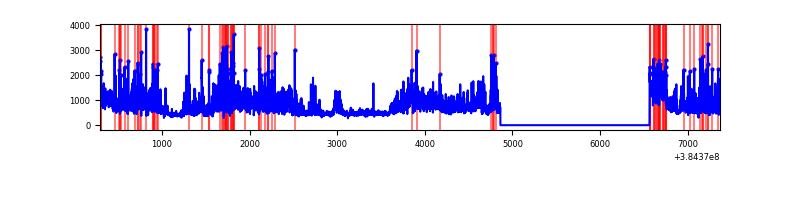 |
| B | 7074 | 5372 | 5274 | 5274 | 74.55% | 98.18% | 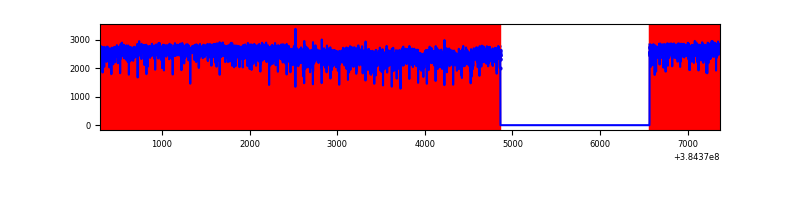 |
| C | 7075 | 5374 | 52 | 52 | 0.73% | 0.97% | 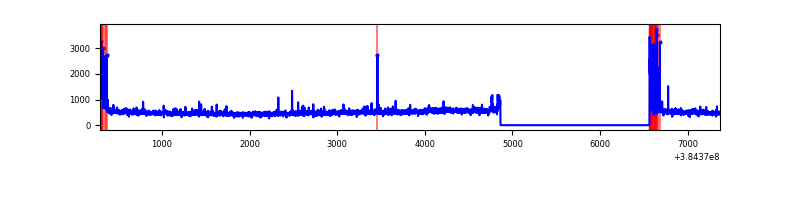 |
| D | 7075 | 5374 | 66 | 66 | 0.93% | 1.23% | 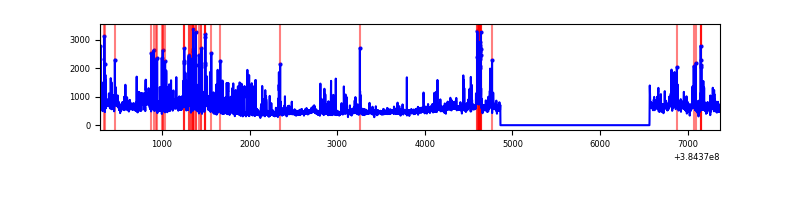 |
Top three noisy pixels from each quadrant. If the there are fewer than three noisy pixels in the level2.evt file, extra rows are filled as -1
| Pixel properties | Quadrant properties | ||||||
|---|---|---|---|---|---|---|---|
| Quadrant | DetID | PixID | Counts | Sigma | Mean | Median | Sigma |
| A | 15 | 169 | 1957685 | 15820.44 | 611 | 600 | 123.7 |
| A | 10 | 83 | 53299 | 426.0 | 611 | 600 | 123.7 |
| A | 13 | 6 | 17960 | 140.33 | 611 | 600 | 123.7 |
| B | 5 | 14 | 3782105 | 72473.81 | 266 | 260 | 52.2 |
| B | 5 | 31 | 3702193 | 70942.41 | 266 | 260 | 52.2 |
| B | 5 | 15 | 3682917 | 70573.01 | 266 | 260 | 52.2 |
| C | 15 | 214 | 246704 | 1795.85 | 591 | 594 | 137.0 |
| C | 0 | 10 | 211141 | 1536.35 | 591 | 594 | 137.0 |
| C | 14 | 67 | 96441 | 699.39 | 591 | 594 | 137.0 |
| D | 8 | 195 | 524696 | 3661.74 | 588 | 571 | 143.1 |
| D | 13 | 249 | 149401 | 1039.78 | 588 | 571 | 143.1 |
| D | 2 | 250 | 101411 | 704.51 | 588 | 571 | 143.1 |
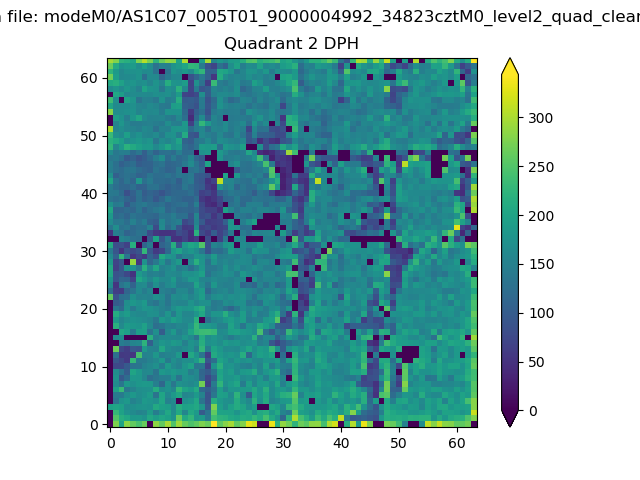
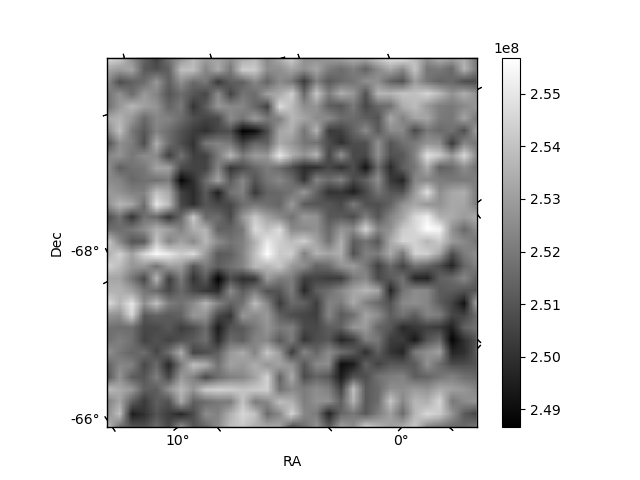
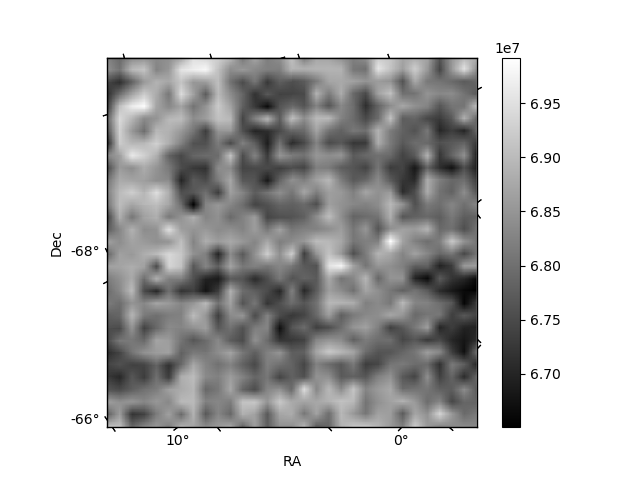
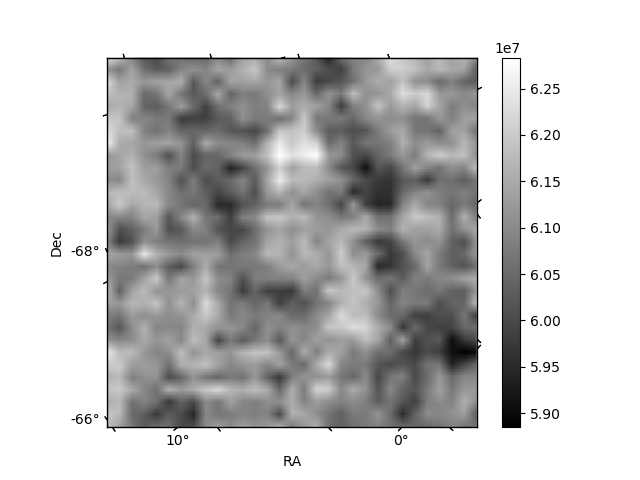
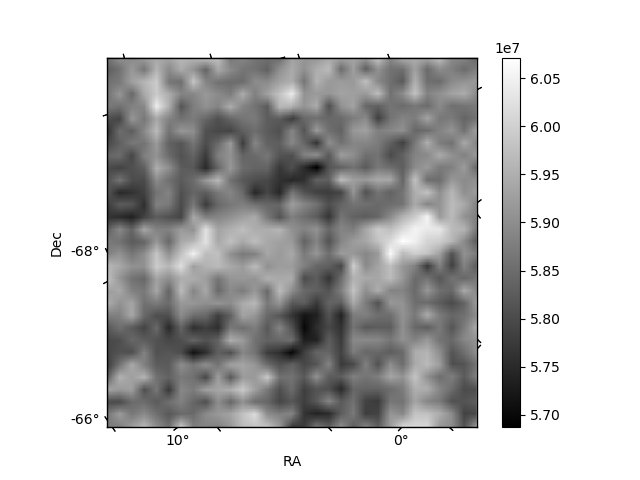
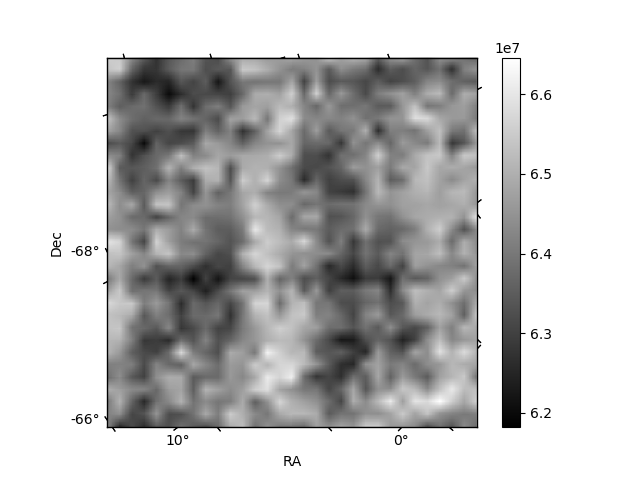
Histogram calculated using DETX and DETY for each event in the final _common_clean file
| Quadrant A | 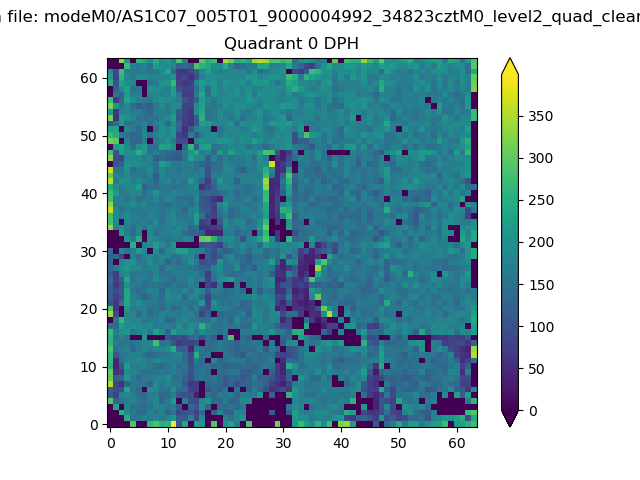 |
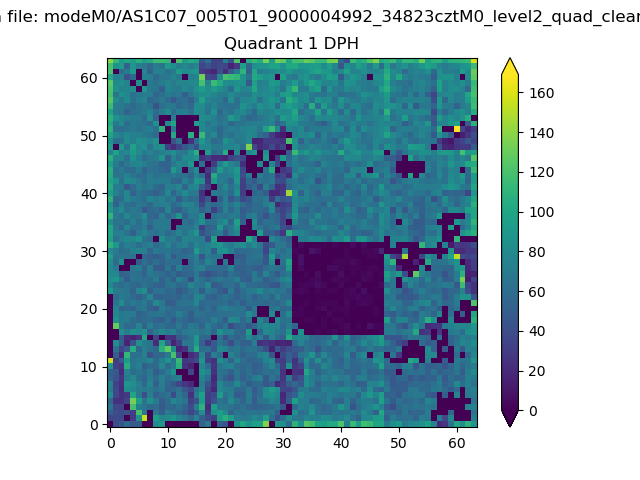 |
Quadrant B |
|---|---|---|---|
| Quadrant D | 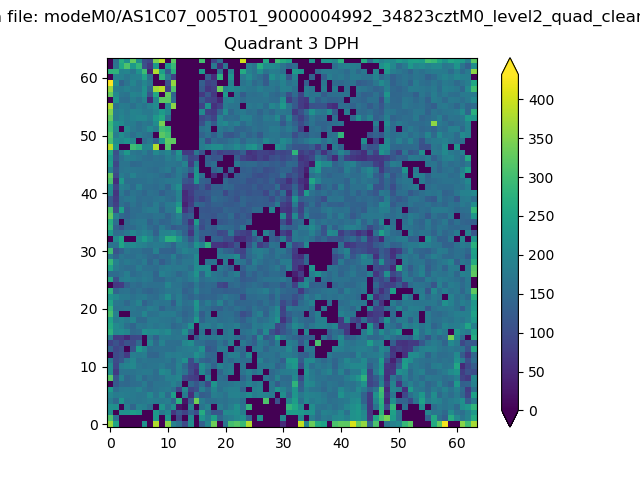 |
 |
Quadrant C |
| Plot type | Count rate plots | Images |
|---|---|---|
| Comparison with Poisson distribution Blue bars denote a histogram of data divided into 1 sec bins. Red curve is a Poisson curve with rate = median count rate of data. |
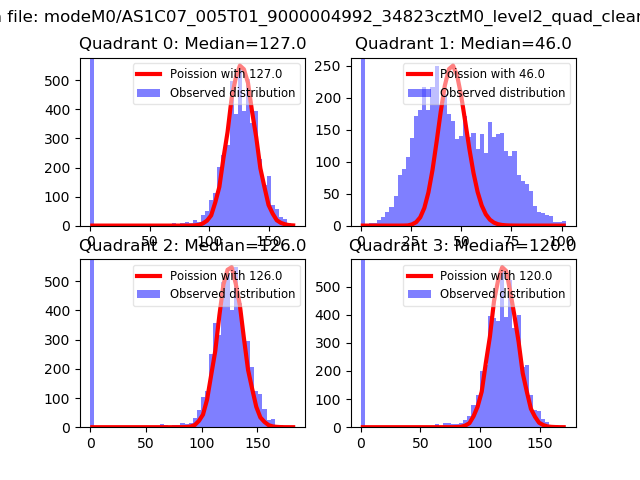 |
 |
| Quadrant-wise count rates Data is divided into 100 sec bins |
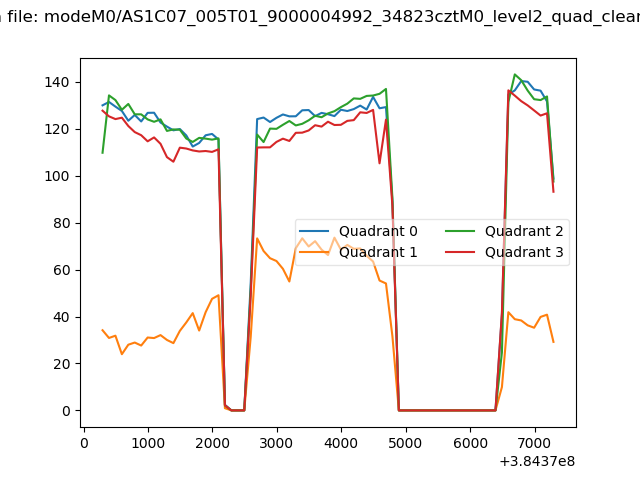 |
|
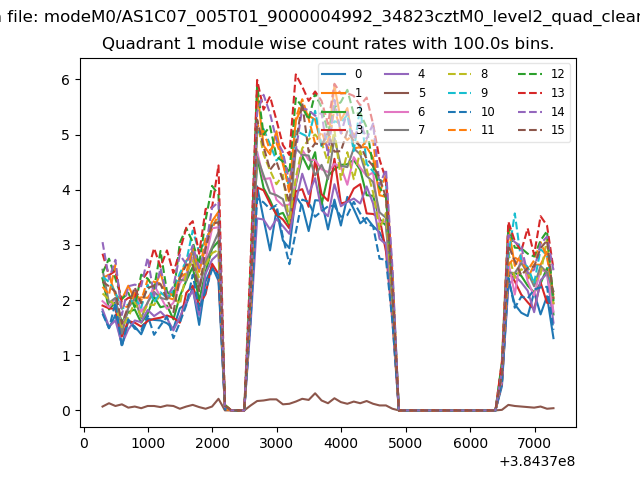
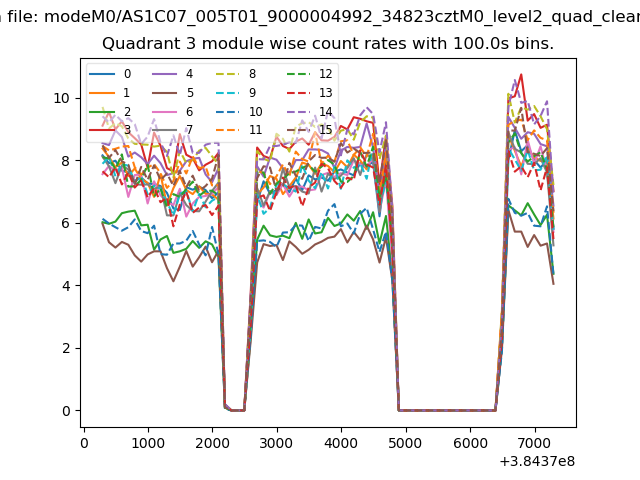
| Module-wise count rates for Quadrant A Data is divided into 100 sec bins |
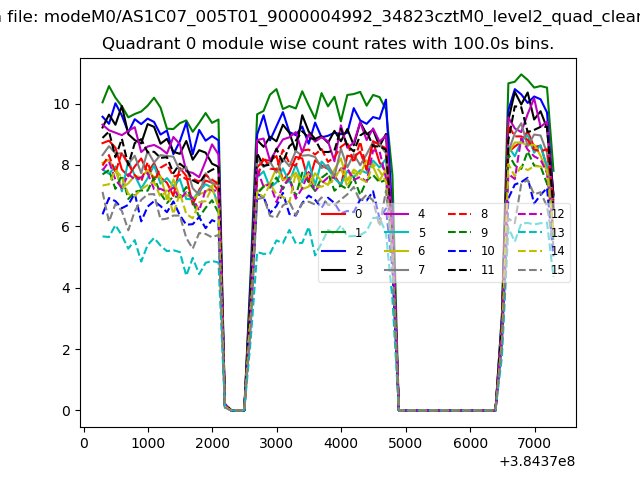 |
 |
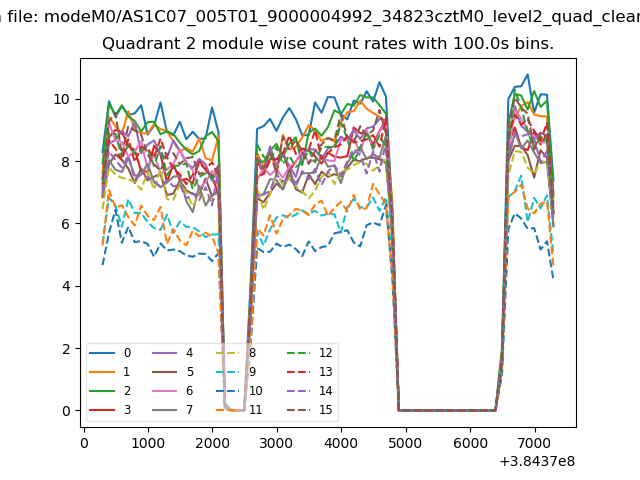
| Module-wise count rates for Quadrant B Data is divided into 100 sec bins |
 |
 |
| Module-wise count rates for Quadrant C Data is divided into 100 sec bins |
 |
 |
| Module-wise count rates for Quadrant D Data is divided into 100 sec bins |
 |
 |
| Parameter | Plot |
|---|---|
| CZT HV Monitor | 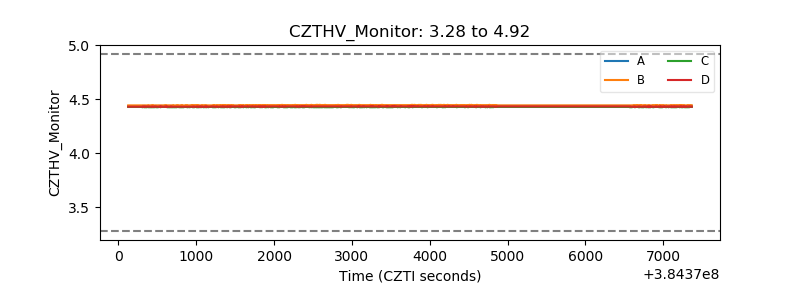 |
| D_VDD | 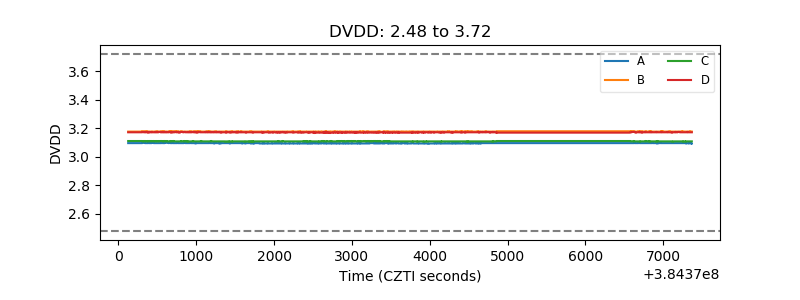 |
| Temperature 1 | 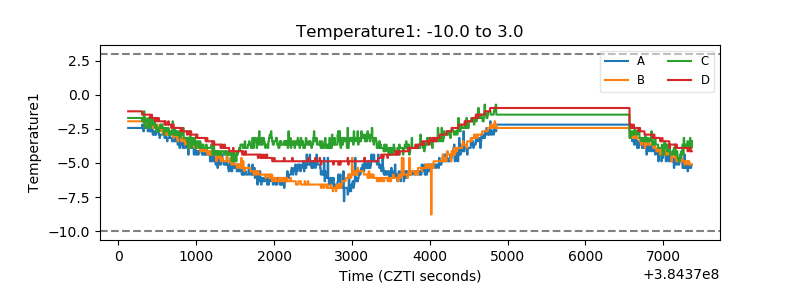 |
| Veto HV Monitor |  |
| Veto LLD | 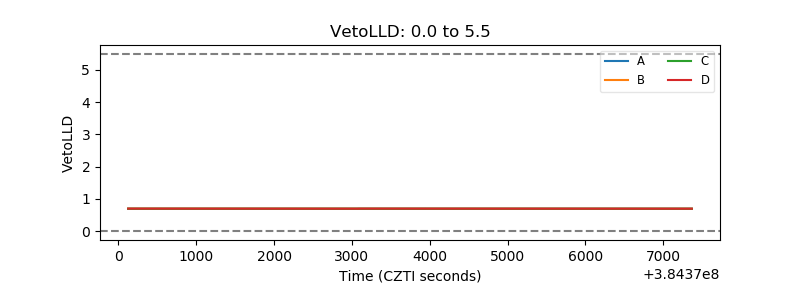 |
| Alpha Counter | 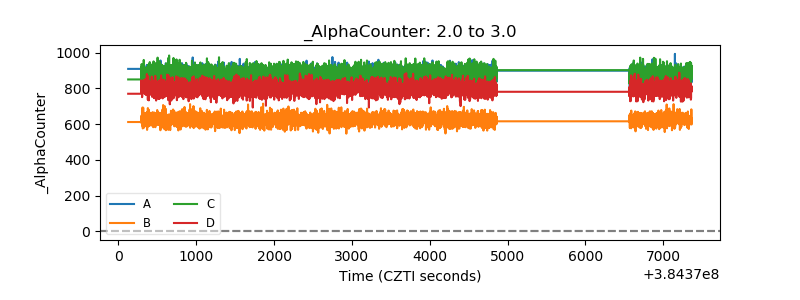 |
| _CPM_Rate | 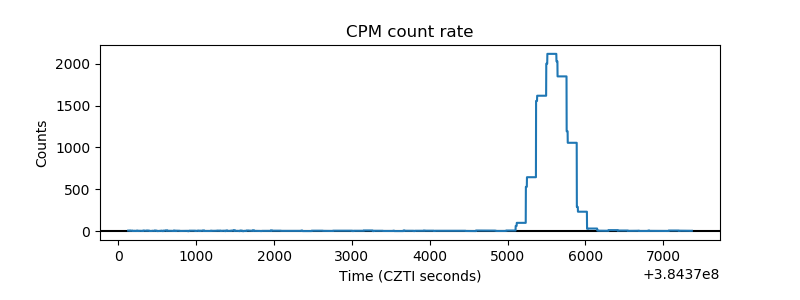 |
| CZT Counter | 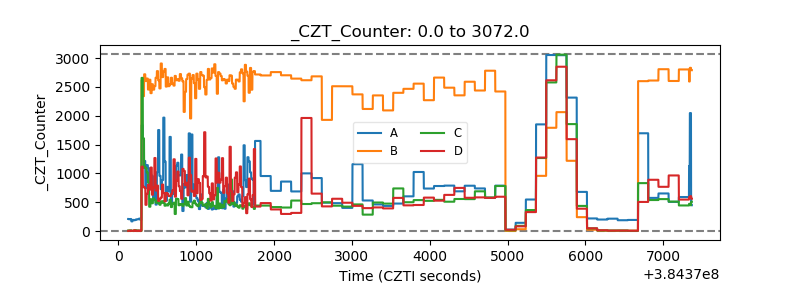 |
| +2.5 Volts monitor | 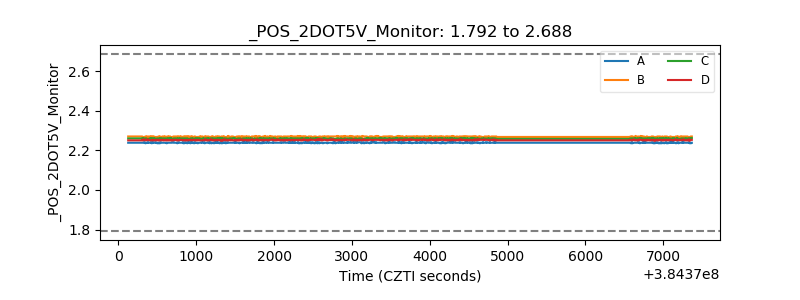 |
| +5 Volts monitor | 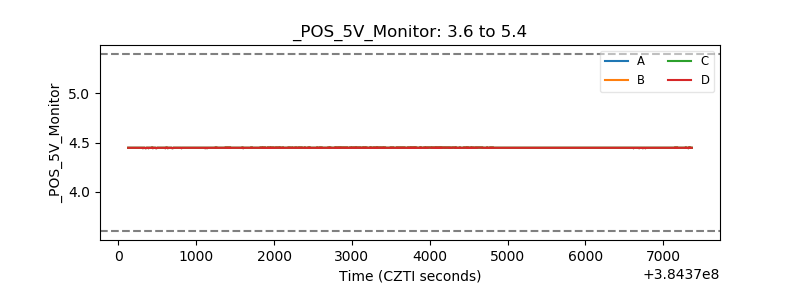 |
| _ROLL_ROT | 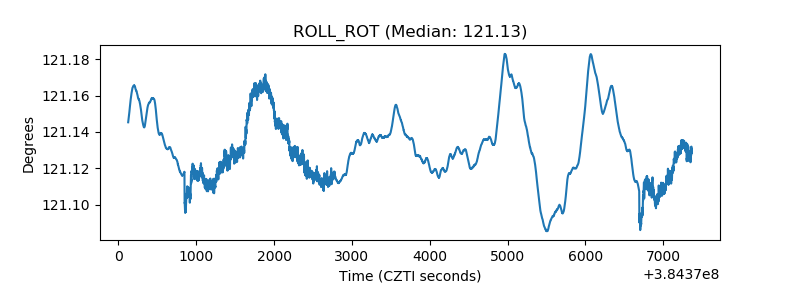 |
| _Roll_DEC | 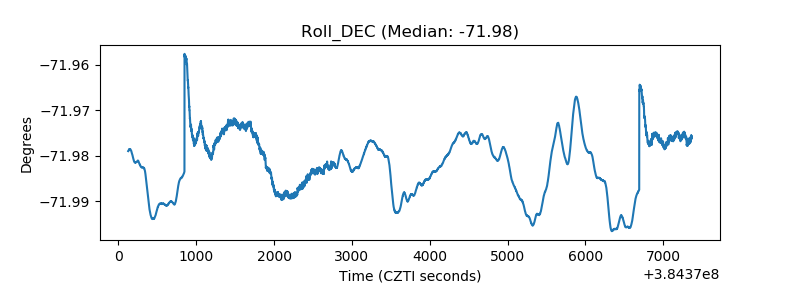 |
| _Roll_RA | 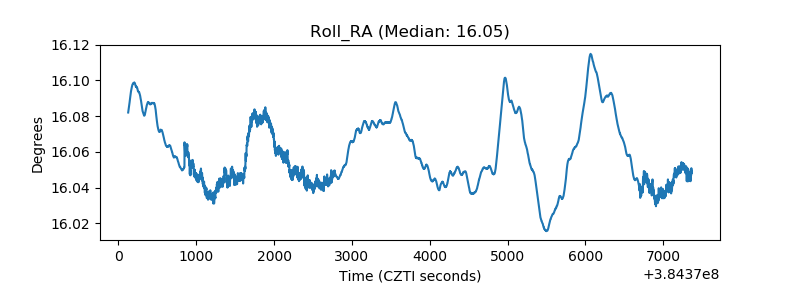 |
| Veto Counter | 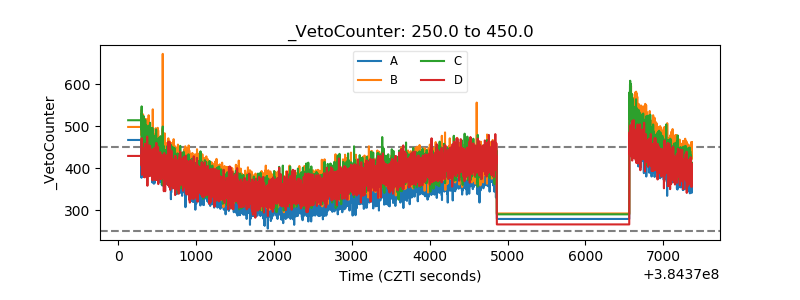 |