| Param | Original file | Final file |
|---|---|---|
| Filename | modeM0/AS1C07_004T01_9000004990_34798cztM0_level2.evt | modeM0/AS1C07_004T01_9000004990_34798cztM0_level2_quad_clean.evt |
| Size (bytes) | 448,263,360 | 58,049,280 |
| Size | 427.5 MB | 55.4 MB |
| Events in quadrant A | 2,675,593 | 349,710 |
| Events in quadrant B | 3,825,708 | 355,395 |
| Events in quadrant C | 3,022,246 | 356,440 |
| Events in quadrant D | 3,696,440 | 328,502 |
| Mode M9 | |||
|---|---|---|---|
| Quadrant | BADHDUFLAG | Total packets | Discarded packets |
| A | 0 | 31 | 0 |
| B | 0 | 31 | 0 |
| C | 0 | 31 | 0 |
| D | 0 | 32 | 0 |
| Mode M0 | |||
|---|---|---|---|
| Quadrant | BADHDUFLAG | Total packets | Discarded packets |
| A | 0 | 10950 | 3 |
| B | 0 | 14832 | 2 |
| C | 0 | 11773 | 2 |
| D | 0 | 14713 | 2 |
| Mode SS | |||
|---|---|---|---|
| Quadrant | BADHDUFLAG | Total packets | Discarded packets |
| A | 0 | 108 | 0 |
| B | 0 | 108 | 0 |
| C | 0 | 108 | 0 |
| D | 0 | 108 | 0 |
| Quadrant | Total seconds | Saturated seconds | Saturation percentage |
|---|---|---|---|
| A | 5239 | 10 | 0.190876% |
| B | 5239 | 281 | 5.363619% |
| C | 5239 | 55 | 1.049819% |
| D | 5239 | 95 | 1.813323% |
Noise dominated data is calculated using 1-second bins in cleaned event files. If a bin has >2000 counts, and if more than 50% of those come from <1% of pixels, then it is considered to be noise-dominated and hence unusable.
| Quadrant | # 1 sec bins | Bins with >0 counts | Bins with >2000 counts | High rate bins dominated by noise | Noise dominated (total time) | Noise dominated (detector-on time) | Marked lightcurve |
|---|---|---|---|---|---|---|---|
| A | 7302 | 5240 | 2 | 2 | 0.03% | 0.04% | 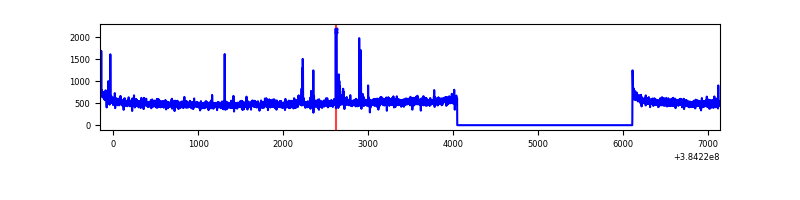 |
| B | 7302 | 5240 | 201 | 201 | 2.75% | 3.84% | 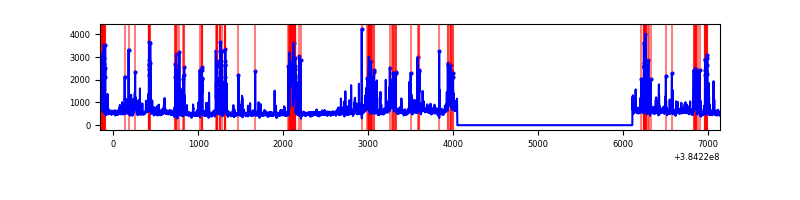 |
| C | 7302 | 5240 | 44 | 44 | 0.60% | 0.84% | 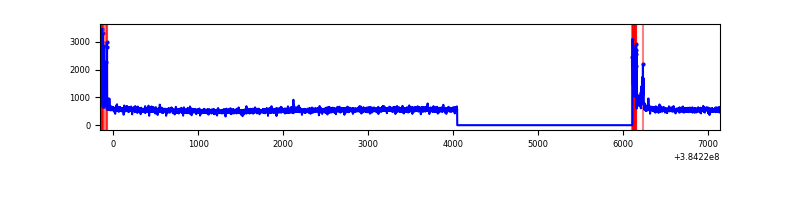 |
| D | 7302 | 5240 | 69 | 69 | 0.94% | 1.32% | 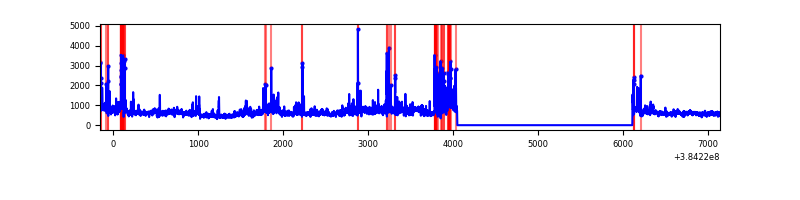 |
Top three noisy pixels from each quadrant. If the there are fewer than three noisy pixels in the level2.evt file, extra rows are filled as -1
| Pixel properties | Quadrant properties | ||||||
|---|---|---|---|---|---|---|---|
| Quadrant | DetID | PixID | Counts | Sigma | Mean | Median | Sigma |
| A | 10 | 83 | 49183 | 365.89 | 662 | 652 | 132.6 |
| A | 15 | 174 | 43037 | 319.55 | 662 | 652 | 132.6 |
| A | 13 | 6 | 12910 | 92.42 | 662 | 652 | 132.6 |
| B | 5 | 172 | 709938 | 5750.97 | 658 | 642 | 123.3 |
| B | 0 | 190 | 159063 | 1284.48 | 658 | 642 | 123.3 |
| B | 5 | 255 | 131626 | 1062.02 | 658 | 642 | 123.3 |
| C | 15 | 214 | 225573 | 1482.74 | 657 | 664 | 151.7 |
| C | 0 | 10 | 194284 | 1276.47 | 657 | 664 | 151.7 |
| C | 14 | 67 | 40889 | 265.19 | 657 | 664 | 151.7 |
| D | 8 | 195 | 665952 | 4292.54 | 643 | 627 | 155.0 |
| D | 12 | 233 | 108020 | 692.88 | 643 | 627 | 155.0 |
| D | 13 | 249 | 100860 | 646.68 | 643 | 627 | 155.0 |
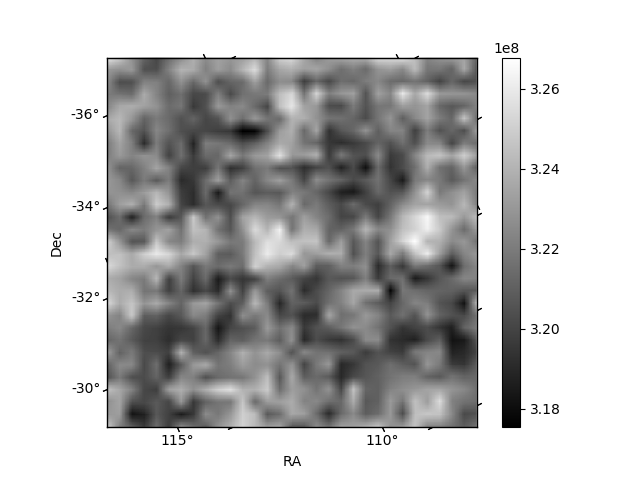
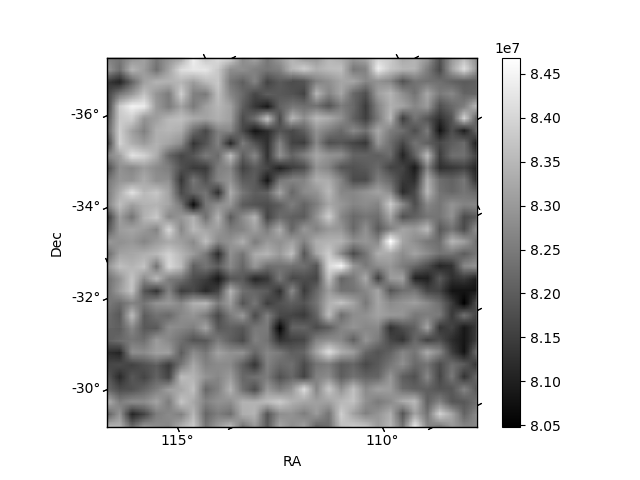
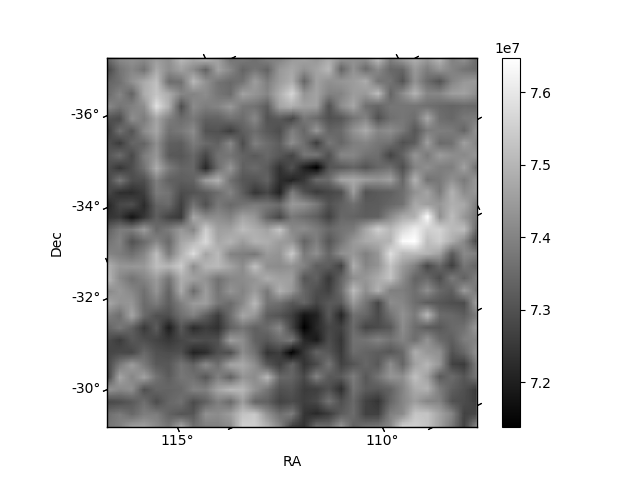
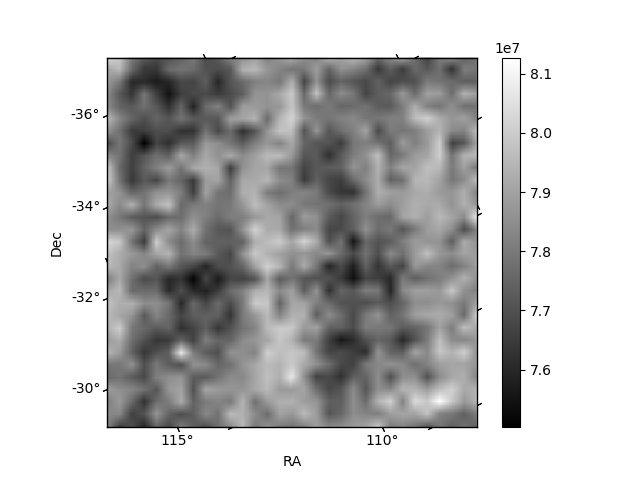
Histogram calculated using DETX and DETY for each event in the final _common_clean file
| Quadrant A | 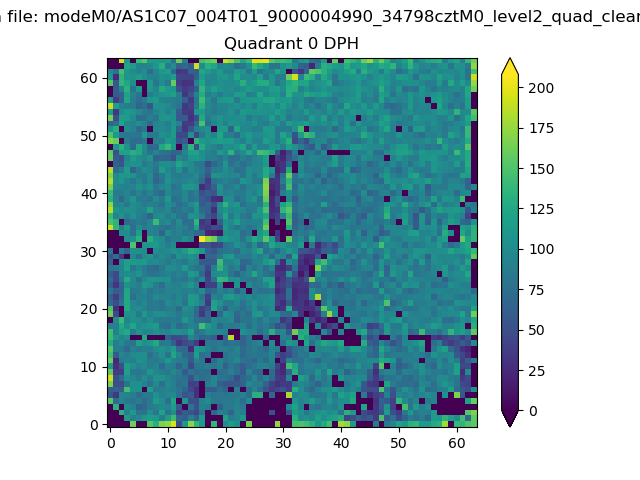 |
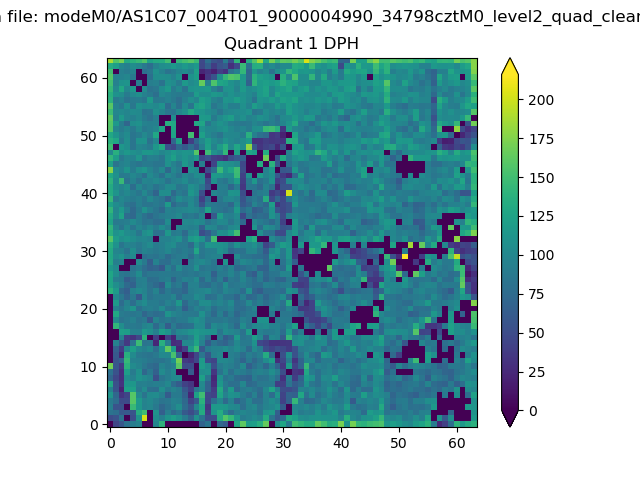 |
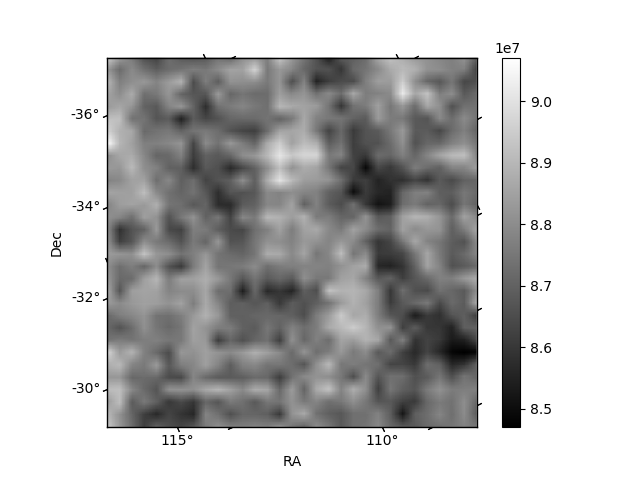
Quadrant B |
|---|---|---|---|
| Quadrant D | 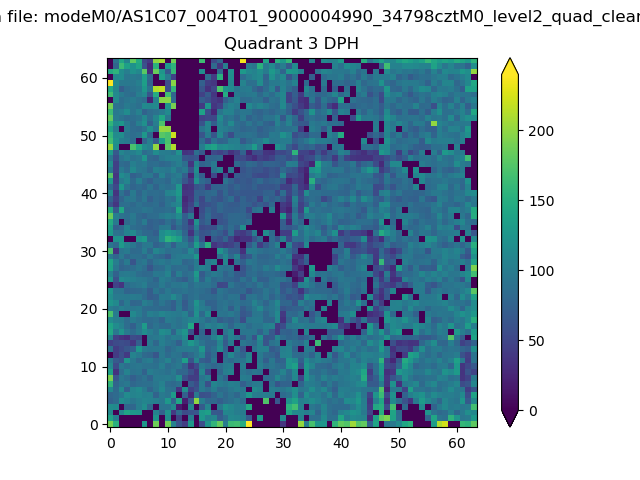 |
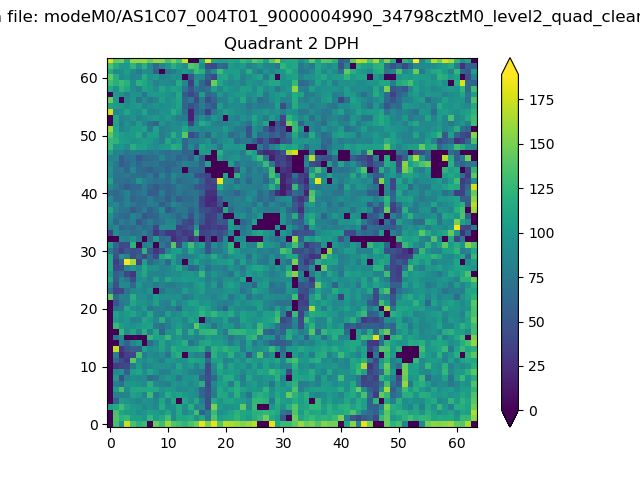 |
Quadrant C |
| Plot type | Count rate plots | Images |
|---|---|---|
| Comparison with Poisson distribution Blue bars denote a histogram of data divided into 1 sec bins. Red curve is a Poisson curve with rate = median count rate of data. |
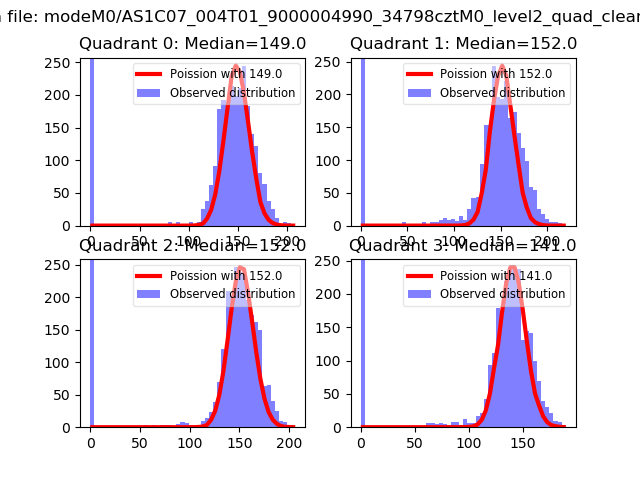 |
 |
| Quadrant-wise count rates Data is divided into 100 sec bins |
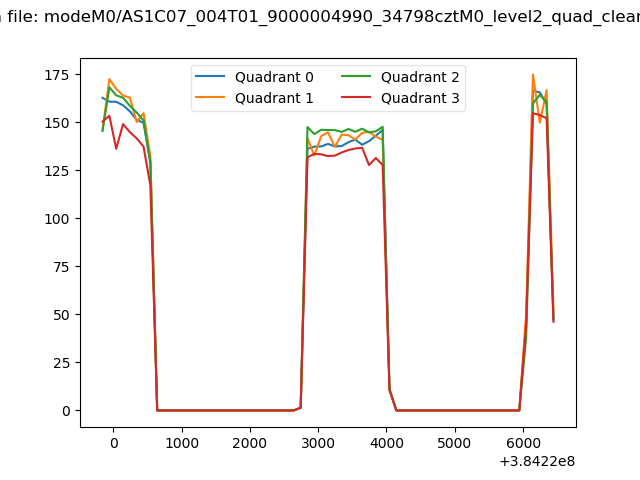 |
|
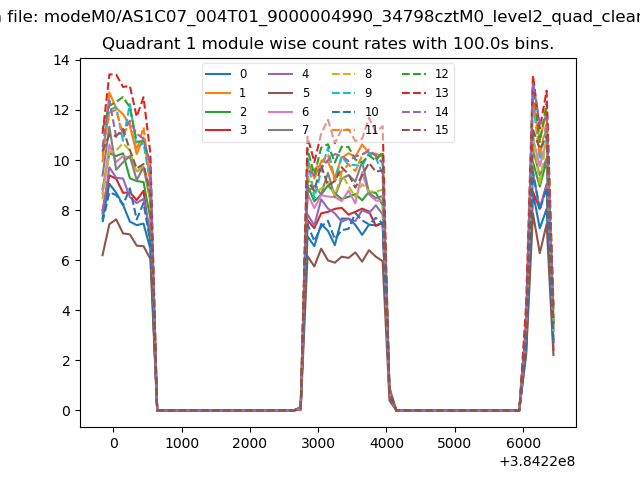
| Module-wise count rates for Quadrant A Data is divided into 100 sec bins |
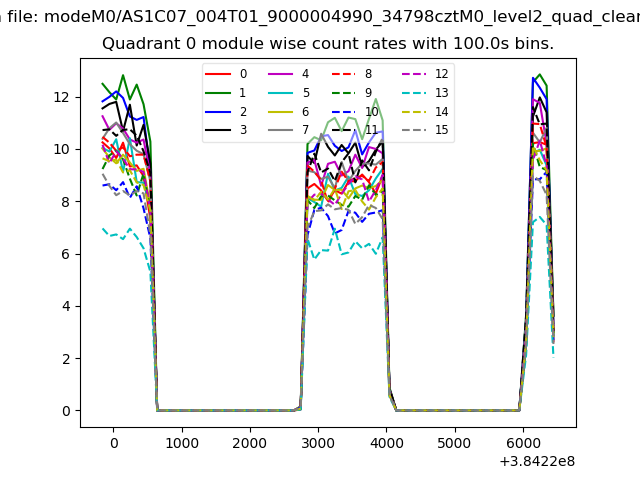 |
 |
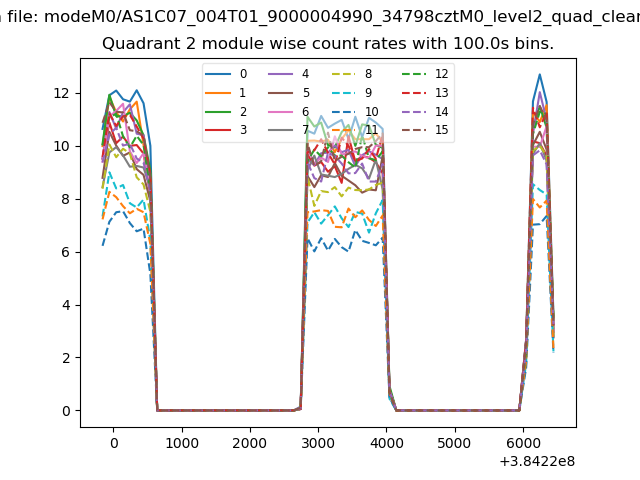
| Module-wise count rates for Quadrant B Data is divided into 100 sec bins |
 |
 |
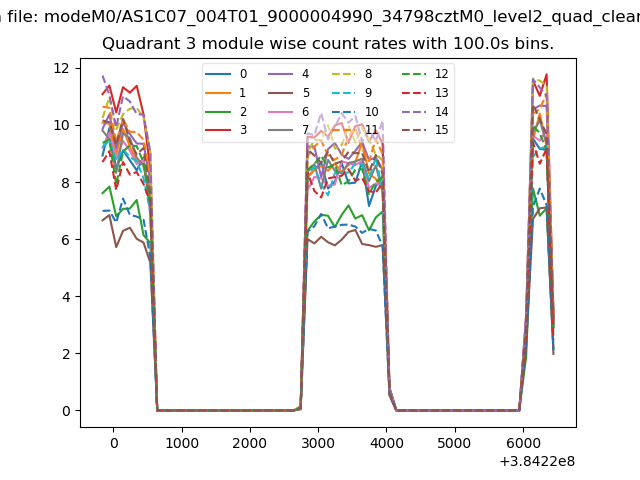
| Module-wise count rates for Quadrant C Data is divided into 100 sec bins |
 |
 |
| Module-wise count rates for Quadrant D Data is divided into 100 sec bins |
 |
 |
| Parameter | Plot |
|---|---|
| CZT HV Monitor | 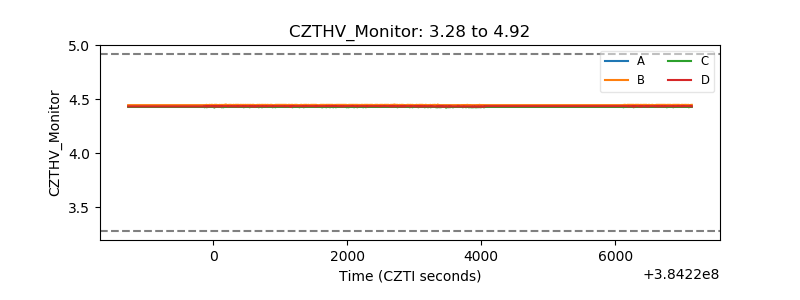 |
| D_VDD | 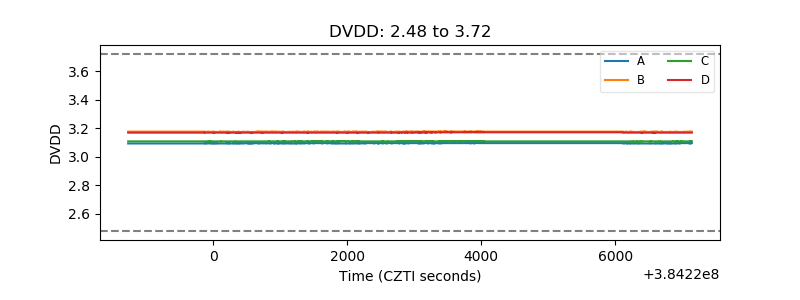 |
| Temperature 1 | 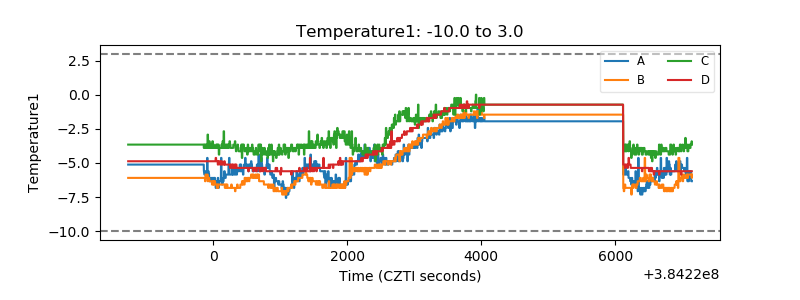 |
| Veto HV Monitor | 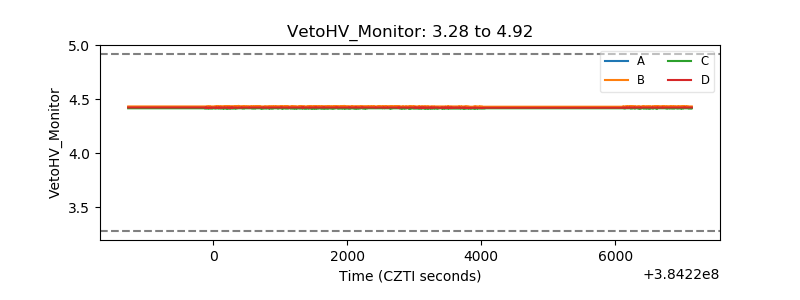 |
| Veto LLD | 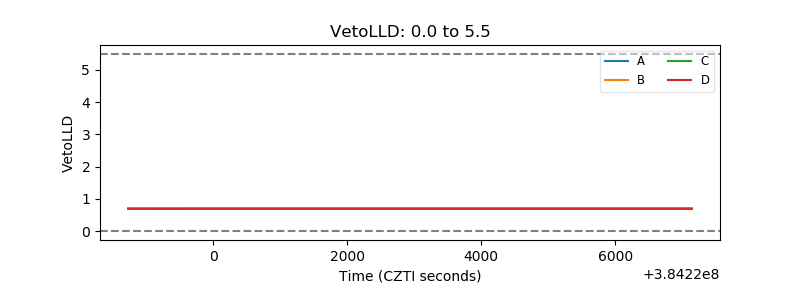 |
| Alpha Counter | 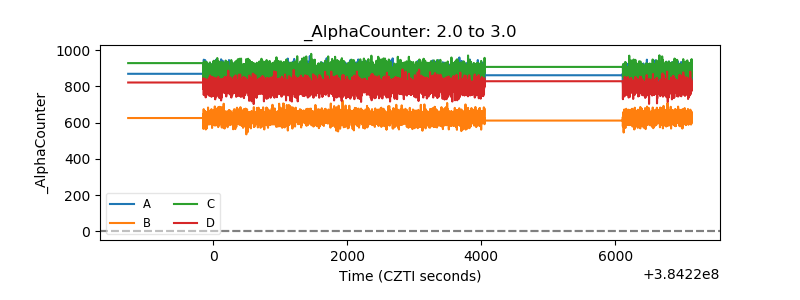 |
| _CPM_Rate | 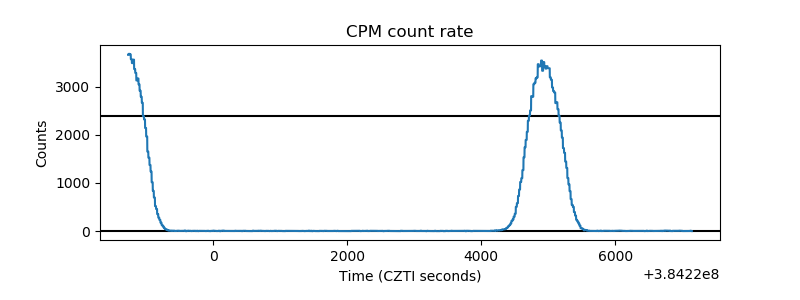 |
| CZT Counter | 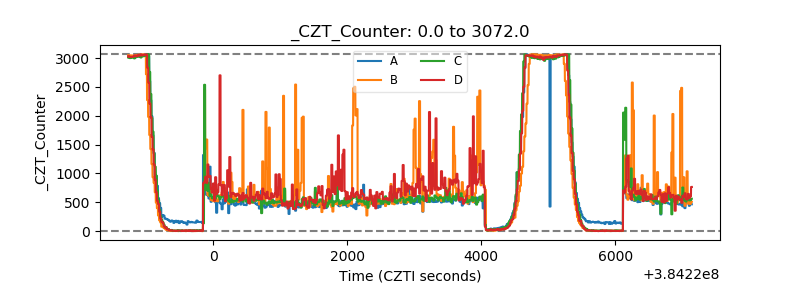 |
| +2.5 Volts monitor | 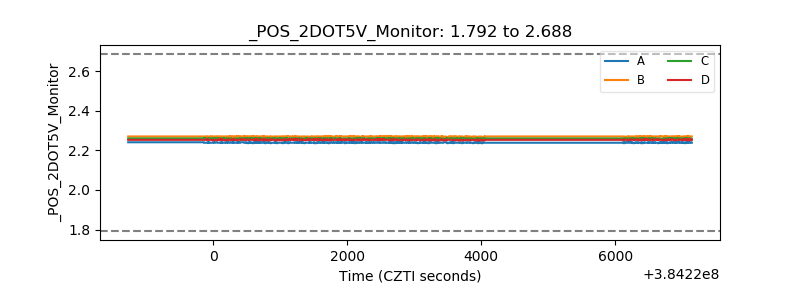 |
| +5 Volts monitor | 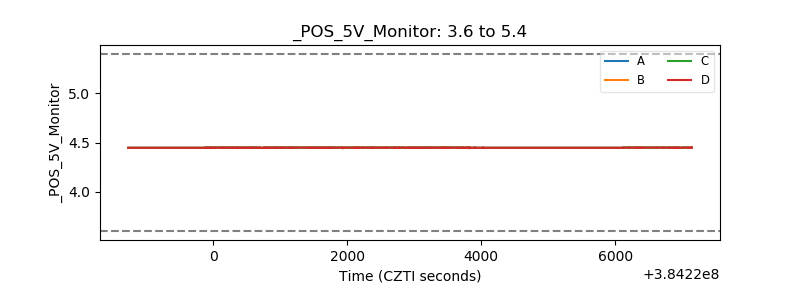 |
| _ROLL_ROT | 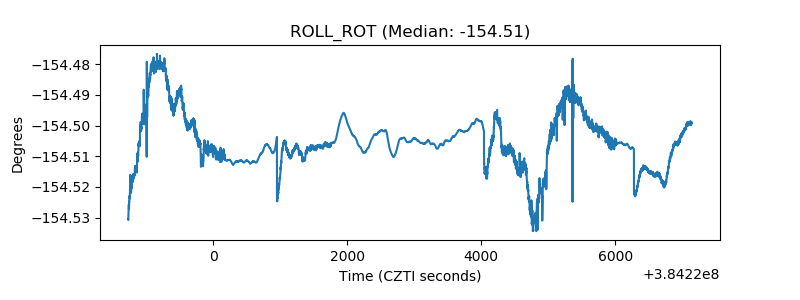 |
| _Roll_DEC | 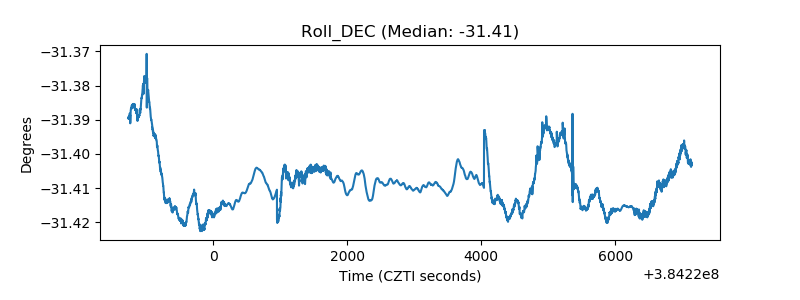 |
| _Roll_RA | 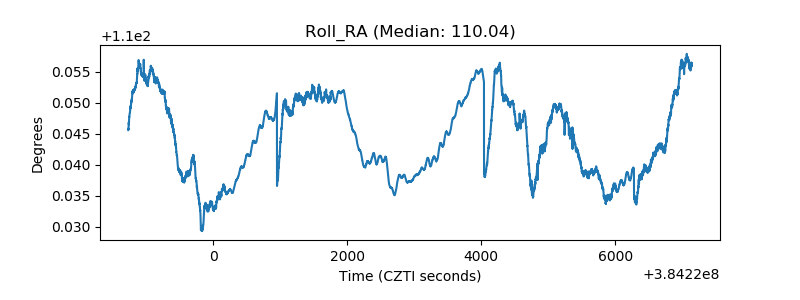 |
| Veto Counter | 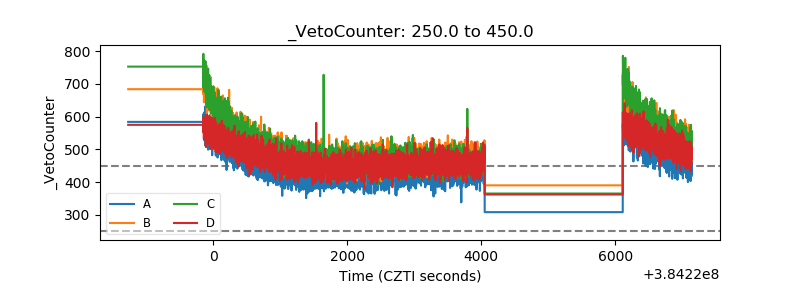 |