| Param | Original file | Final file |
|---|---|---|
| Filename | modeM0/AS1C07_004T01_9000004990_34797cztM0_level2.evt | modeM0/AS1C07_004T01_9000004990_34797cztM0_level2_quad_clean.evt |
| Size (bytes) | 456,042,240 | 62,933,760 |
| Size | 434.9 MB | 60.0 MB |
| Events in quadrant A | 2,443,901 | 400,745 |
| Events in quadrant B | 3,151,863 | 408,076 |
| Events in quadrant C | 2,823,904 | 402,230 |
| Events in quadrant D | 5,054,982 | 346,431 |
| Mode M9 | |||
|---|---|---|---|
| Quadrant | BADHDUFLAG | Total packets | Discarded packets |
| A | 0 | 29 | 0 |
| B | 0 | 29 | 0 |
| C | 0 | 29 | 0 |
| D | 0 | 30 | 0 |
| Mode M0 | |||
|---|---|---|---|
| Quadrant | BADHDUFLAG | Total packets | Discarded packets |
| A | 0 | 10268 | 3 |
| B | 0 | 12405 | 2 |
| C | 0 | 11207 | 2 |
| D | 0 | 18726 | 2 |
| Mode SS | |||
|---|---|---|---|
| Quadrant | BADHDUFLAG | Total packets | Discarded packets |
| A | 0 | 100 | 0 |
| B | 0 | 100 | 0 |
| C | 0 | 100 | 0 |
| D | 0 | 100 | 0 |
| Quadrant | Total seconds | Saturated seconds | Saturation percentage |
|---|---|---|---|
| A | 4965 | 6 | 0.120846% |
| B | 4965 | 115 | 2.316213% |
| C | 4965 | 66 | 1.329305% |
| D | 4965 | 633 | 12.749245% |
Noise dominated data is calculated using 1-second bins in cleaned event files. If a bin has >2000 counts, and if more than 50% of those come from <1% of pixels, then it is considered to be noise-dominated and hence unusable.
| Quadrant | # 1 sec bins | Bins with >0 counts | Bins with >2000 counts | High rate bins dominated by noise | Noise dominated (total time) | Noise dominated (detector-on time) | Marked lightcurve |
|---|---|---|---|---|---|---|---|
| A | 6938 | 4966 | 0 | 0 | 0.00% | 0.00% | 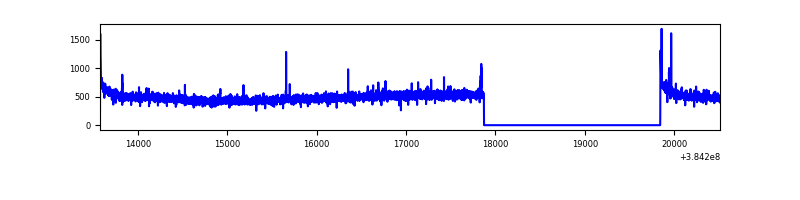 |
| B | 6938 | 4966 | 81 | 81 | 1.17% | 1.63% | 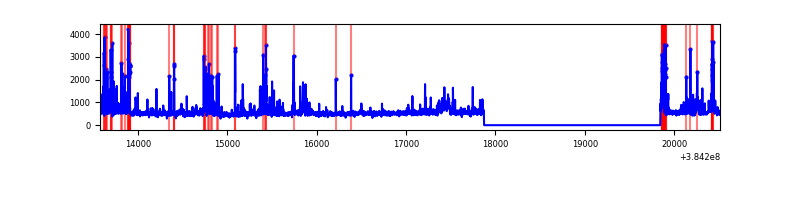 |
| C | 6938 | 4966 | 56 | 56 | 0.81% | 1.13% | 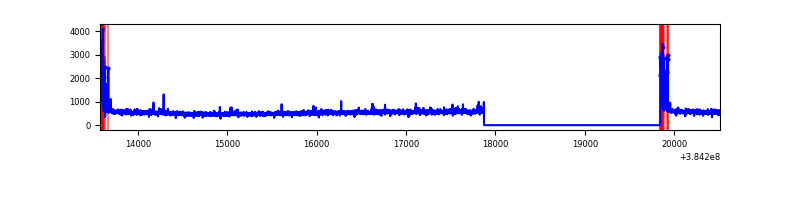 |
| D | 6938 | 4966 | 581 | 581 | 8.37% | 11.70% | 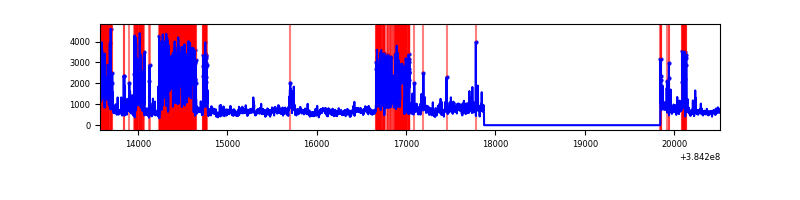 |
Top three noisy pixels from each quadrant. If the there are fewer than three noisy pixels in the level2.evt file, extra rows are filled as -1
| Pixel properties | Quadrant properties | ||||||
|---|---|---|---|---|---|---|---|
| Quadrant | DetID | PixID | Counts | Sigma | Mean | Median | Sigma |
| A | 10 | 83 | 47717 | 386.42 | 610 | 601 | 121.9 |
| A | 15 | 174 | 12741 | 99.57 | 610 | 601 | 121.9 |
| A | 7 | 16 | 12232 | 95.39 | 610 | 601 | 121.9 |
| B | 5 | 172 | 324245 | 2813.69 | 612 | 597 | 115.0 |
| B | 5 | 255 | 132567 | 1147.31 | 612 | 597 | 115.0 |
| B | 0 | 190 | 96782 | 836.2 | 612 | 597 | 115.0 |
| C | 15 | 214 | 211020 | 1511.89 | 600 | 605 | 139.2 |
| C | 0 | 10 | 192788 | 1380.89 | 600 | 605 | 139.2 |
| C | 14 | 67 | 71853 | 511.94 | 600 | 605 | 139.2 |
| D | 1 | 52 | 1728807 | 12448.35 | 564 | 548 | 138.8 |
| D | 8 | 195 | 707615 | 5092.88 | 564 | 548 | 138.8 |
| D | 13 | 249 | 167159 | 1200.07 | 564 | 548 | 138.8 |
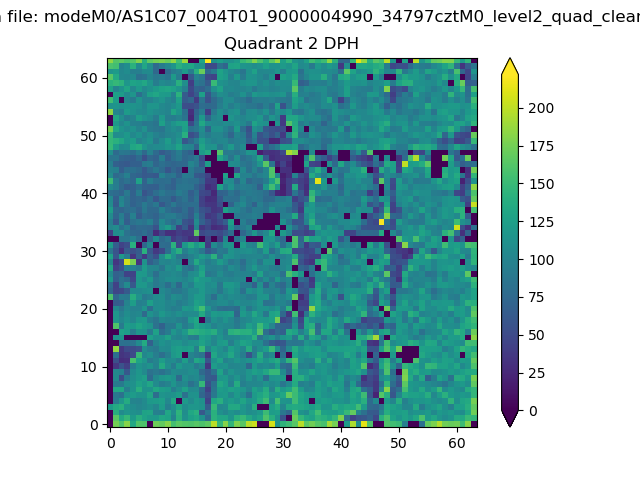
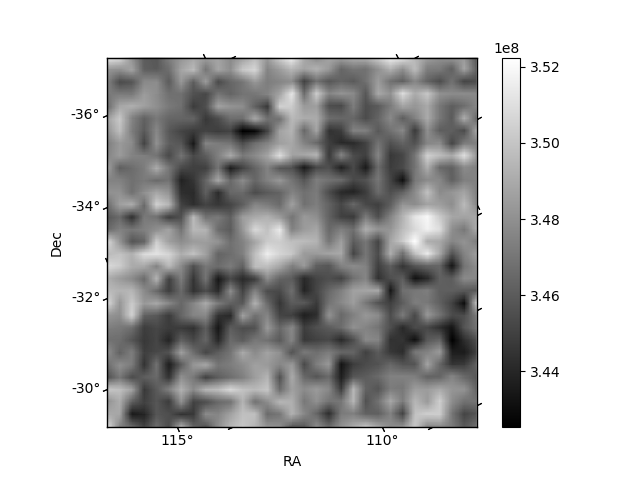
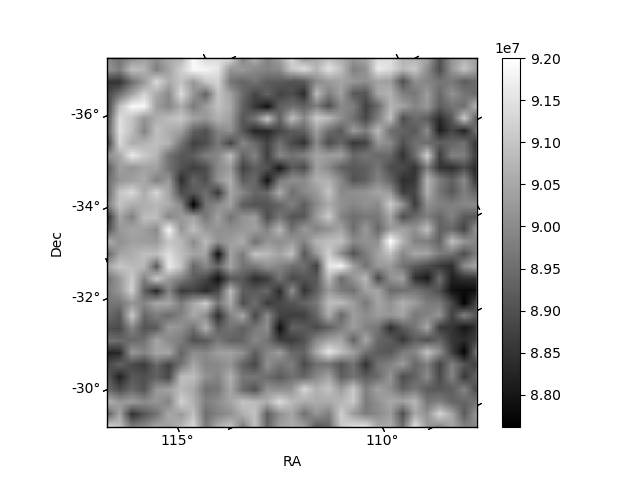
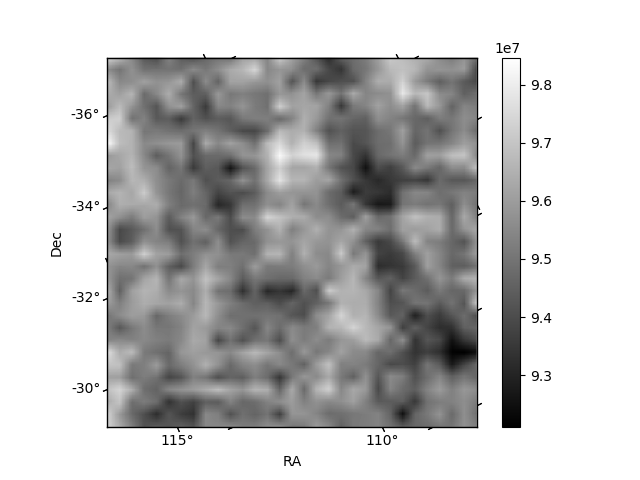
Histogram calculated using DETX and DETY for each event in the final _common_clean file
| Quadrant A | 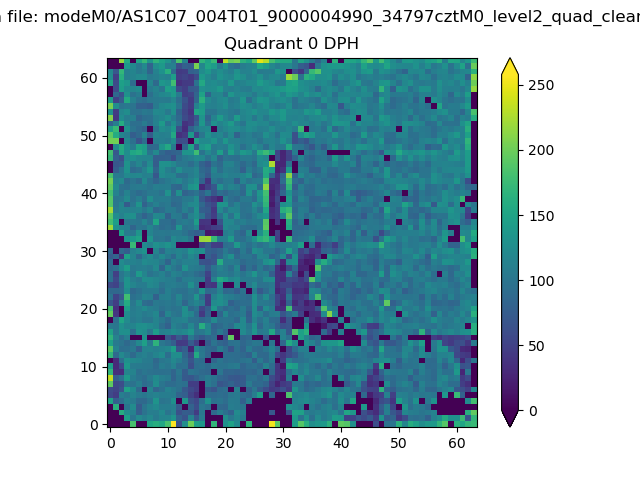 |
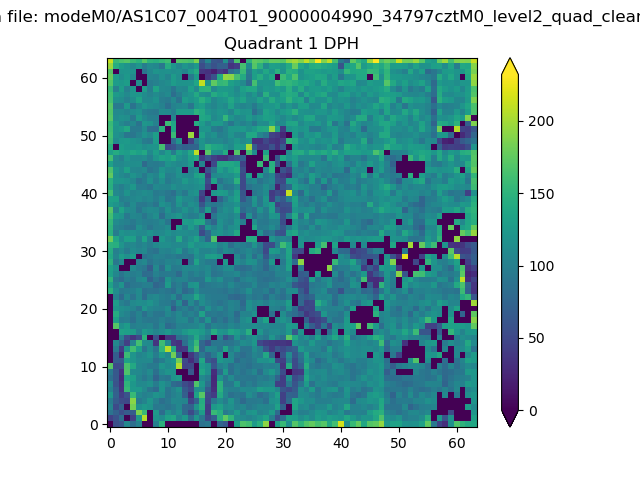 |
Quadrant B |
|---|---|---|---|
| Quadrant D | 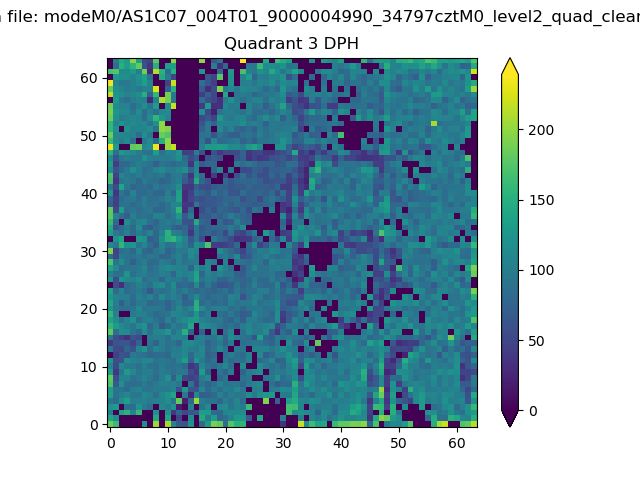 |
 |
Quadrant C |
| Plot type | Count rate plots | Images |
|---|---|---|
| Comparison with Poisson distribution Blue bars denote a histogram of data divided into 1 sec bins. Red curve is a Poisson curve with rate = median count rate of data. |
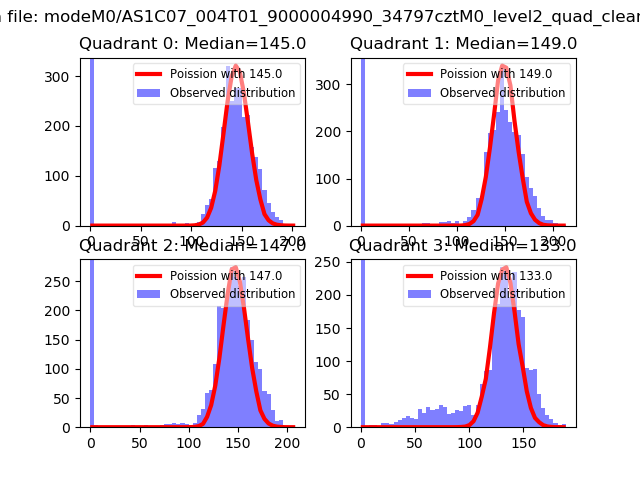 |
 |
| Quadrant-wise count rates Data is divided into 100 sec bins |
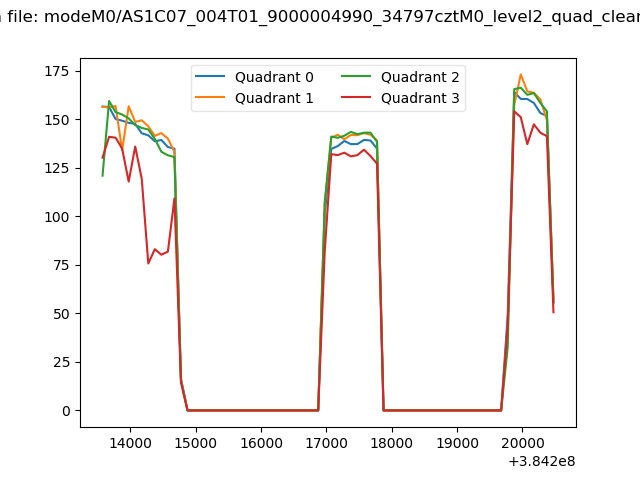 |
|
| Module-wise count rates for Quadrant A Data is divided into 100 sec bins |
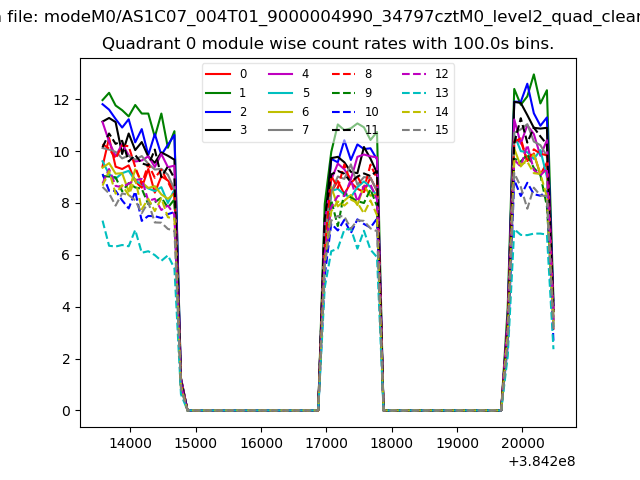 |
 |
| Module-wise count rates for Quadrant B Data is divided into 100 sec bins |
 |
 |
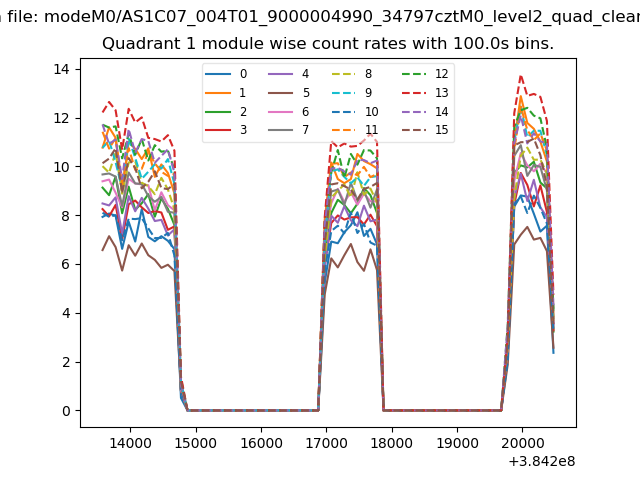
| Module-wise count rates for Quadrant C Data is divided into 100 sec bins |
 |
 |
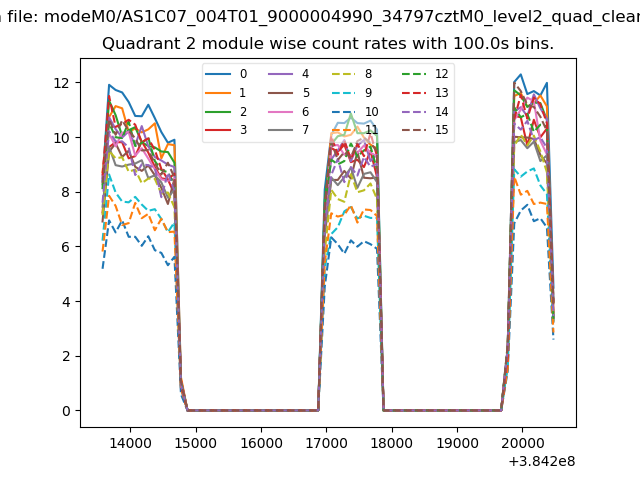
| Module-wise count rates for Quadrant D Data is divided into 100 sec bins |
 |
 |
| Parameter | Plot |
|---|---|
| CZT HV Monitor |  |
| D_VDD | 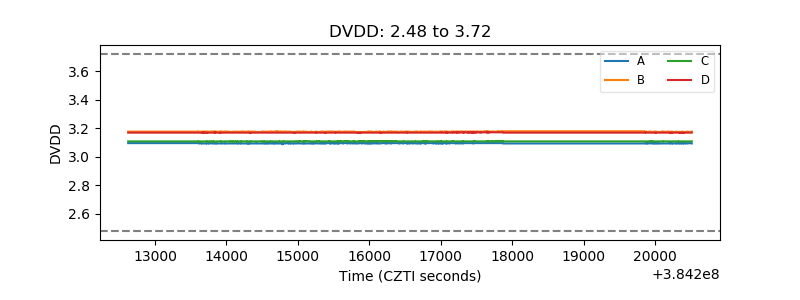 |
| Temperature 1 | 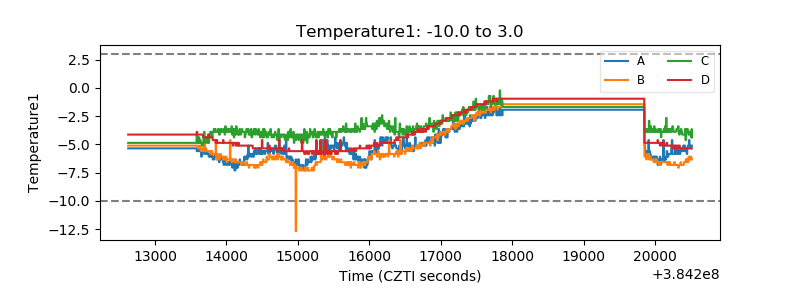 |
| Veto HV Monitor | 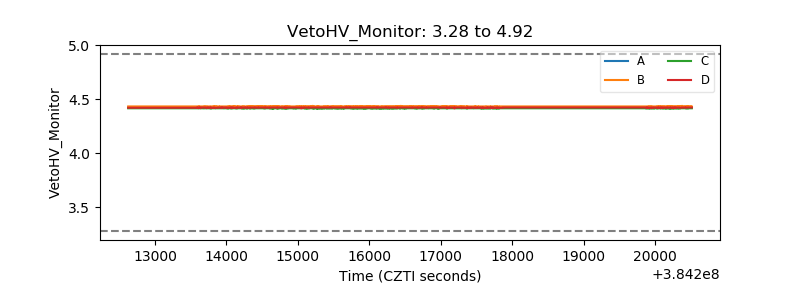 |
| Veto LLD | 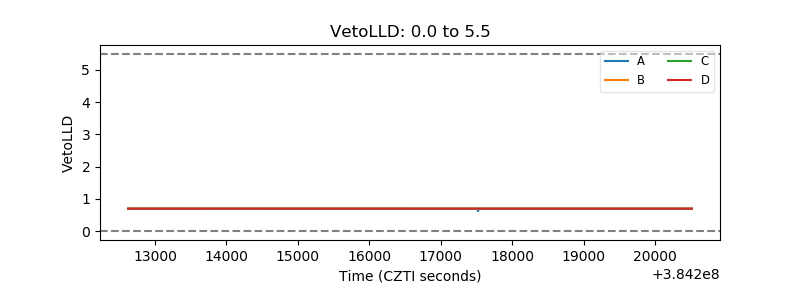 |
| Alpha Counter | 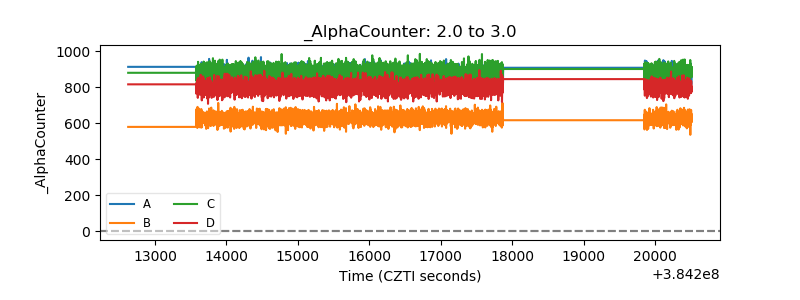 |
| _CPM_Rate | 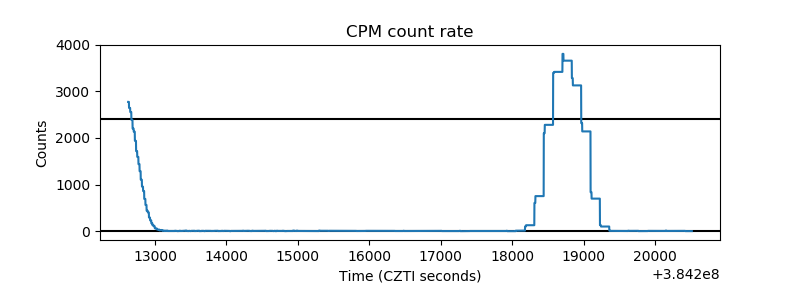 |
| CZT Counter | 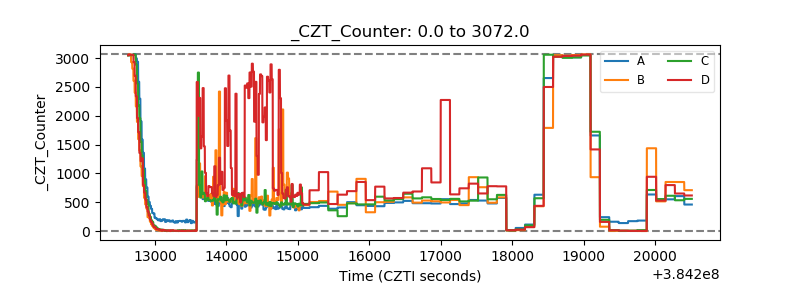 |
| +2.5 Volts monitor | 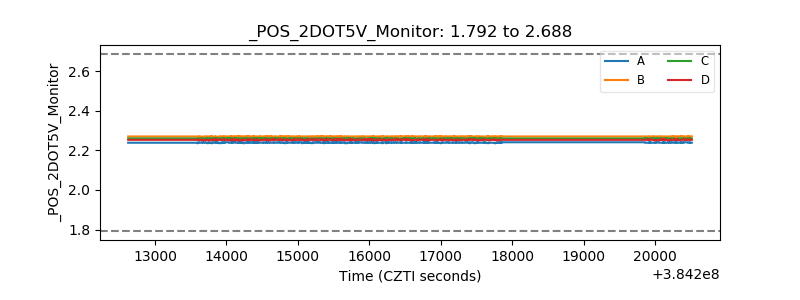 |
| +5 Volts monitor | 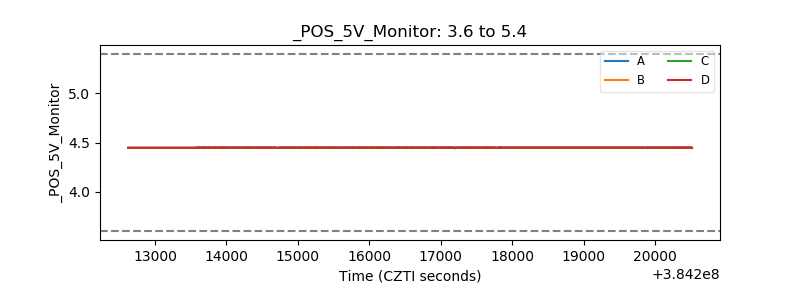 |
| _ROLL_ROT | 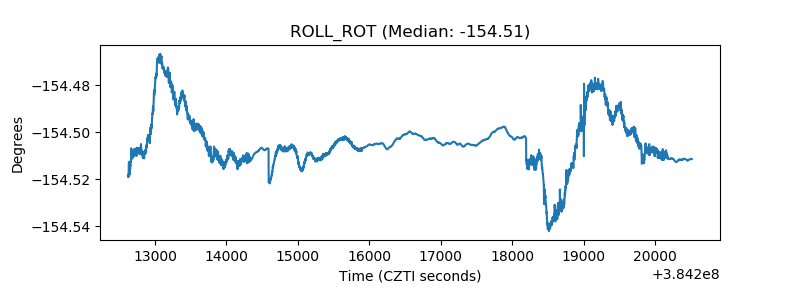 |
| _Roll_DEC | 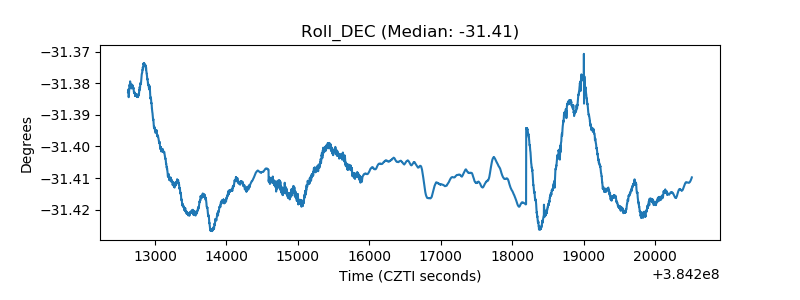 |
| _Roll_RA | 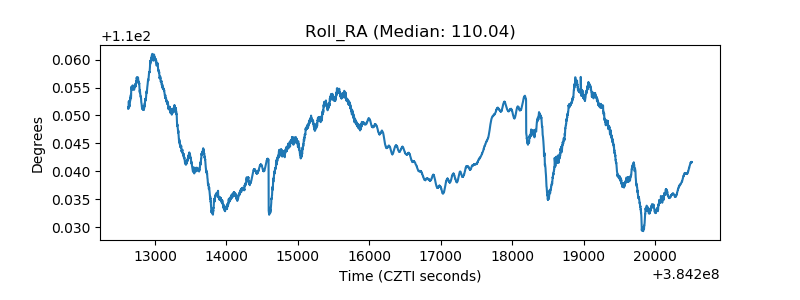 |
| Veto Counter | 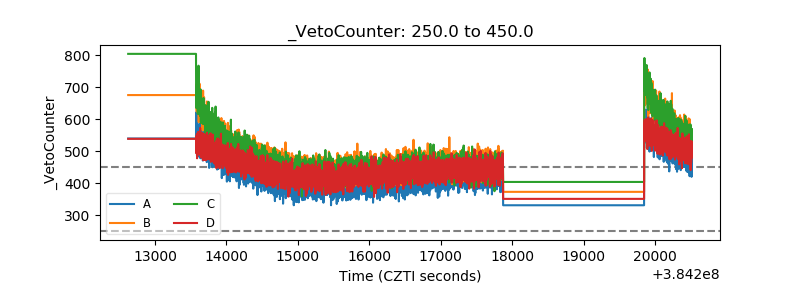 |