| Param | Original file | Final file |
|---|---|---|
| Filename | modeM0/AS1C07_004T01_9000004990_34796cztM0_level2.evt | modeM0/AS1C07_004T01_9000004990_34796cztM0_level2_quad_clean.evt |
| Size (bytes) | 440,942,400 | 64,958,400 |
| Size | 420.5 MB | 61.9 MB |
| Events in quadrant A | 2,509,299 | 409,385 |
| Events in quadrant B | 2,905,975 | 419,277 |
| Events in quadrant C | 2,890,424 | 409,368 |
| Events in quadrant D | 4,694,096 | 363,109 |
| Mode M9 | |||
|---|---|---|---|
| Quadrant | BADHDUFLAG | Total packets | Discarded packets |
| A | 0 | 30 | 0 |
| B | 0 | 30 | 0 |
| C | 0 | 30 | 0 |
| D | 0 | 31 | 0 |
| Mode M0 | |||
|---|---|---|---|
| Quadrant | BADHDUFLAG | Total packets | Discarded packets |
| A | 0 | 10789 | 3 |
| B | 0 | 11871 | 2 |
| C | 0 | 11552 | 2 |
| D | 0 | 17667 | 2 |
| Mode SS | |||
|---|---|---|---|
| Quadrant | BADHDUFLAG | Total packets | Discarded packets |
| A | 0 | 106 | 0 |
| B | 0 | 106 | 0 |
| C | 0 | 106 | 0 |
| D | 0 | 106 | 0 |
| Quadrant | Total seconds | Saturated seconds | Saturation percentage |
|---|---|---|---|
| A | 5219 | 7 | 0.134125% |
| B | 5219 | 63 | 1.207128% |
| C | 5219 | 88 | 1.686147% |
| D | 5219 | 346 | 6.629623% |
Noise dominated data is calculated using 1-second bins in cleaned event files. If a bin has >2000 counts, and if more than 50% of those come from <1% of pixels, then it is considered to be noise-dominated and hence unusable.
| Quadrant | # 1 sec bins | Bins with >0 counts | Bins with >2000 counts | High rate bins dominated by noise | Noise dominated (total time) | Noise dominated (detector-on time) | Marked lightcurve |
|---|---|---|---|---|---|---|---|
| A | 7072 | 5220 | 0 | 0 | 0.00% | 0.00% | 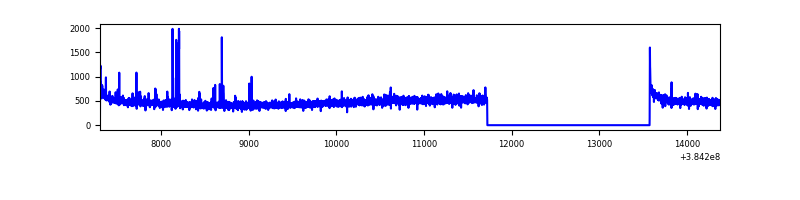 |
| B | 7072 | 5220 | 36 | 36 | 0.51% | 0.69% | 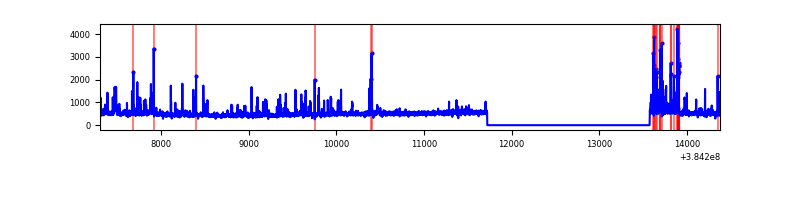 |
| C | 7072 | 5220 | 72 | 72 | 1.02% | 1.38% | 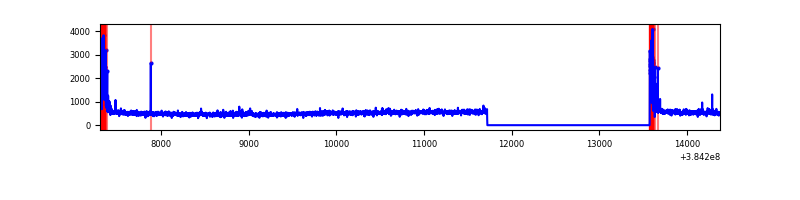 |
| D | 7072 | 5220 | 334 | 334 | 4.72% | 6.40% | 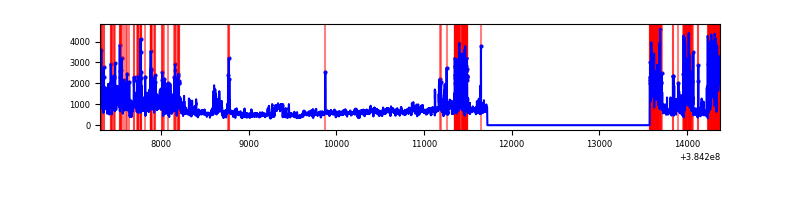 |
Top three noisy pixels from each quadrant. If the there are fewer than three noisy pixels in the level2.evt file, extra rows are filled as -1
| Pixel properties | Quadrant properties | ||||||
|---|---|---|---|---|---|---|---|
| Quadrant | DetID | PixID | Counts | Sigma | Mean | Median | Sigma |
| A | 10 | 83 | 49218 | 392.45 | 621 | 612 | 123.9 |
| A | 7 | 16 | 42885 | 341.31 | 621 | 612 | 123.9 |
| A | 13 | 6 | 9714 | 73.49 | 621 | 612 | 123.9 |
| B | 5 | 172 | 142617 | 1187.26 | 623 | 606 | 119.6 |
| B | 5 | 255 | 90850 | 754.47 | 623 | 606 | 119.6 |
| B | 4 | 232 | 80978 | 671.93 | 623 | 606 | 119.6 |
| C | 0 | 10 | 248955 | 1757.47 | 606 | 612 | 141.3 |
| C | 15 | 214 | 222857 | 1572.78 | 606 | 612 | 141.3 |
| C | 14 | 67 | 41221 | 287.38 | 606 | 612 | 141.3 |
| D | 8 | 195 | 1135238 | 7883.44 | 585 | 570 | 143.9 |
| D | 1 | 52 | 507333 | 3520.88 | 585 | 570 | 143.9 |
| D | 12 | 6 | 246532 | 1708.89 | 585 | 570 | 143.9 |
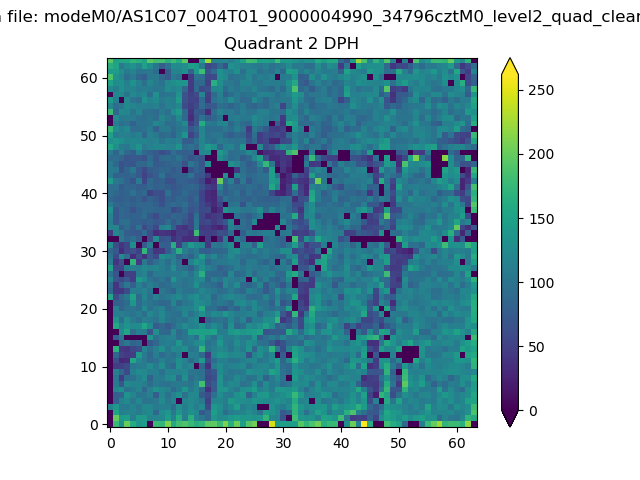
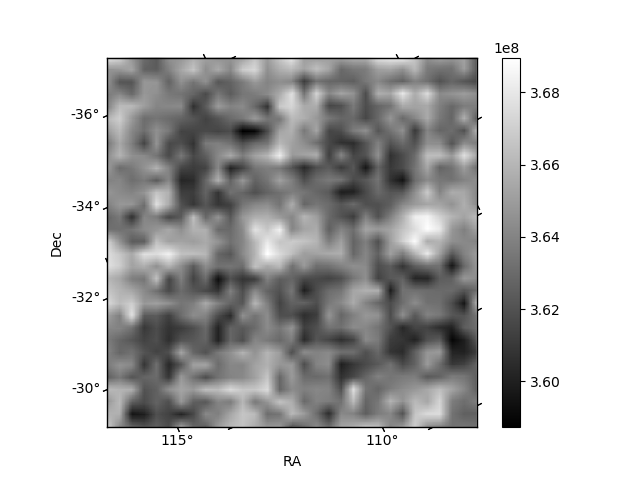
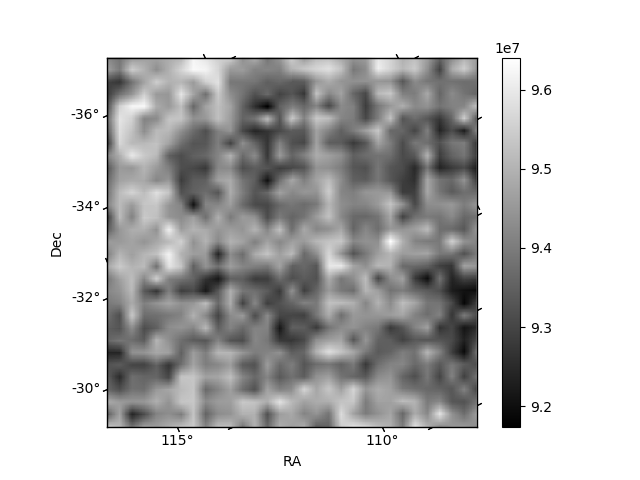
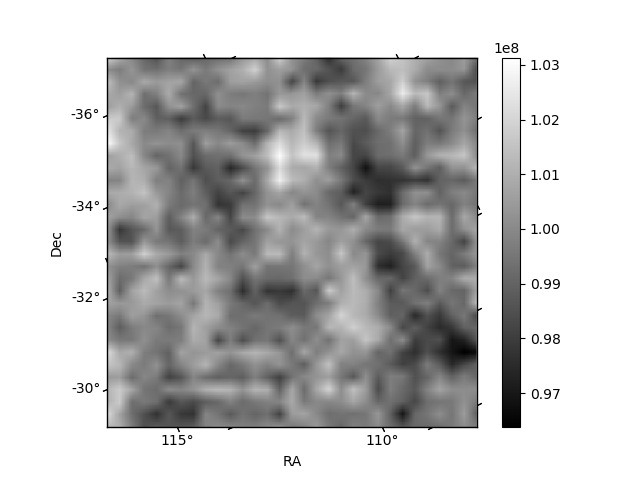
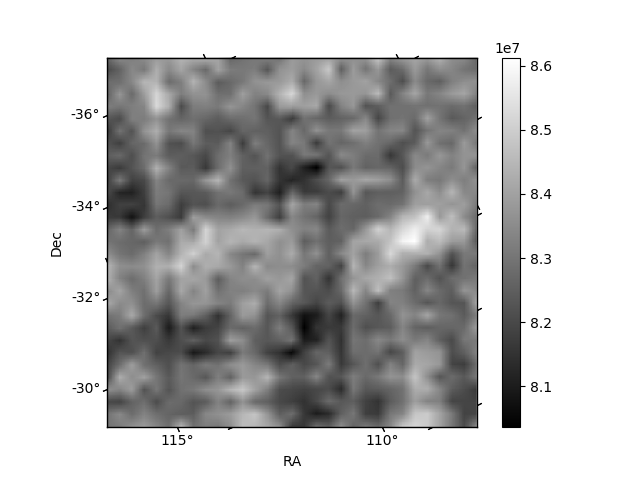
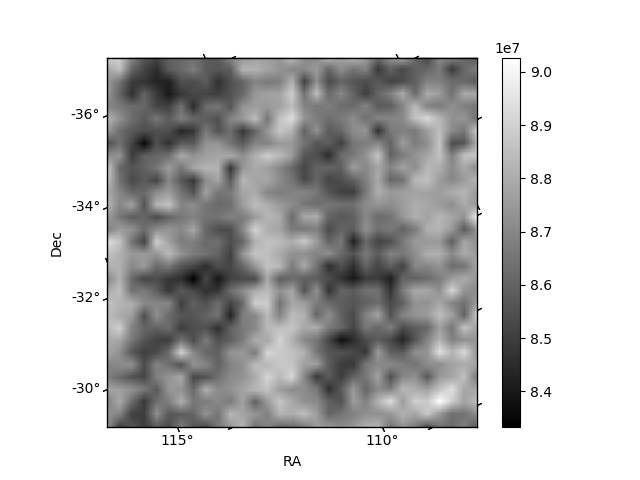
Histogram calculated using DETX and DETY for each event in the final _common_clean file
| Quadrant A | 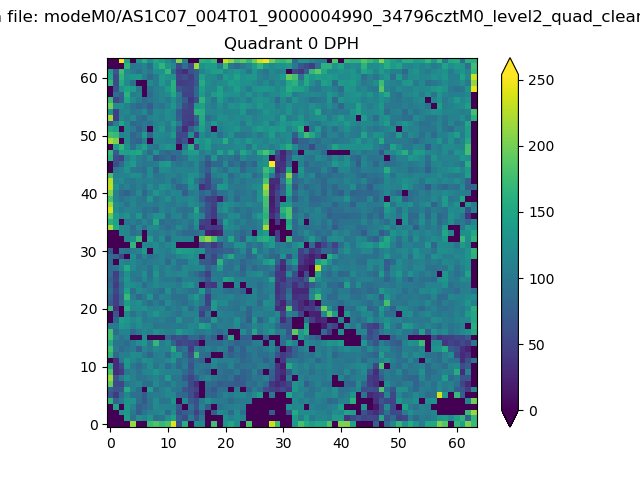 |
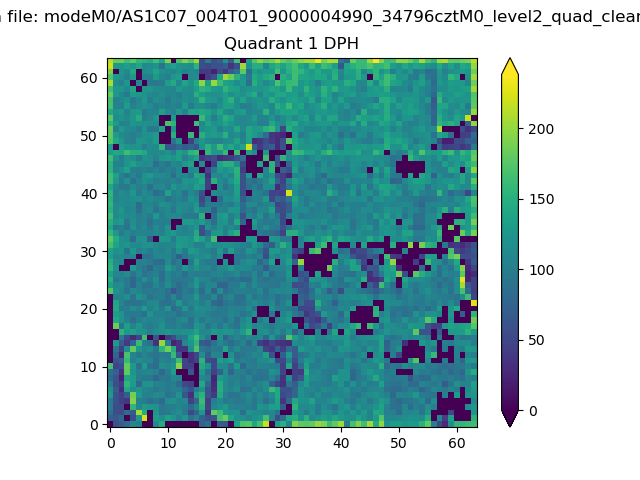 |
Quadrant B |
|---|---|---|---|
| Quadrant D | 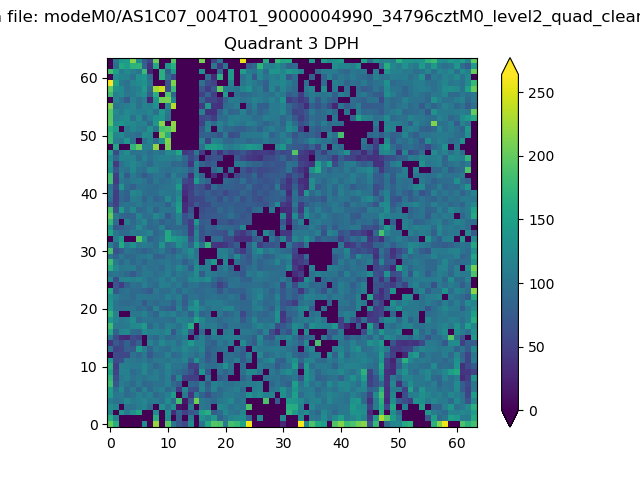 |
 |
Quadrant C |
| Plot type | Count rate plots | Images |
|---|---|---|
| Comparison with Poisson distribution Blue bars denote a histogram of data divided into 1 sec bins. Red curve is a Poisson curve with rate = median count rate of data. |
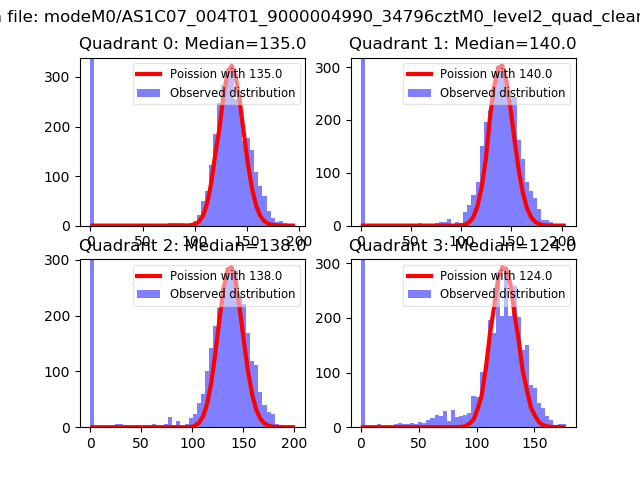 |
 |
| Quadrant-wise count rates Data is divided into 100 sec bins |
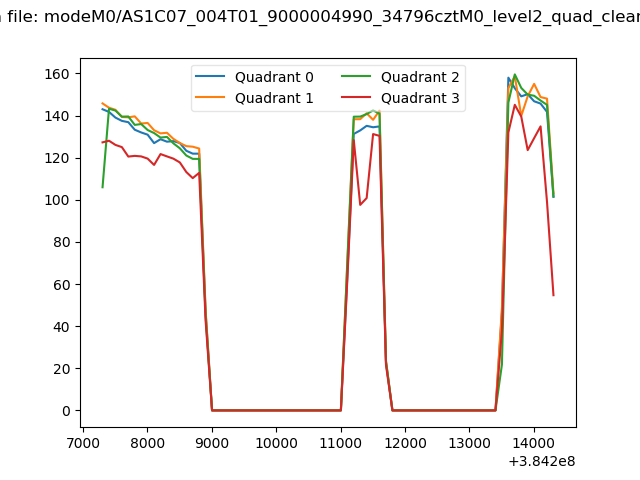 |
|
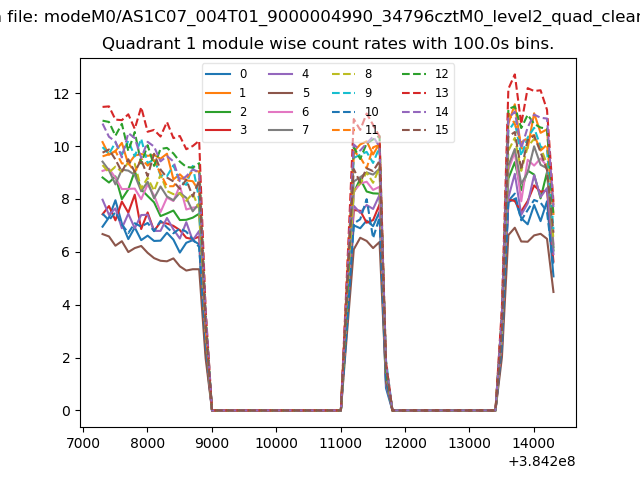
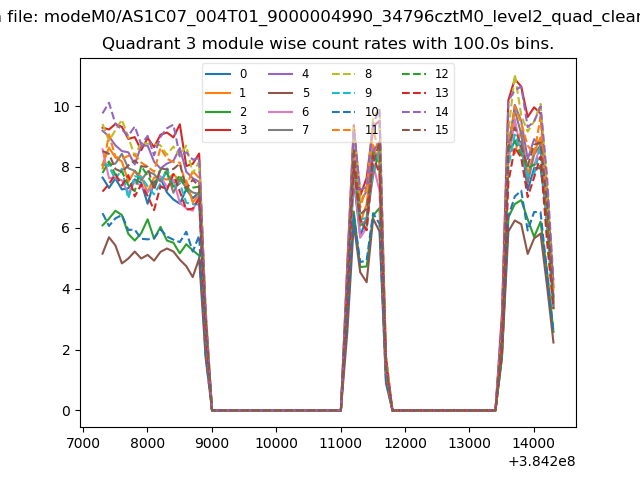
| Module-wise count rates for Quadrant A Data is divided into 100 sec bins |
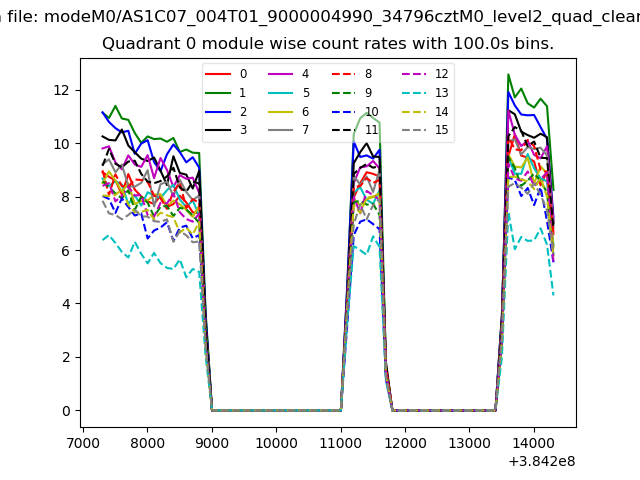 |
 |
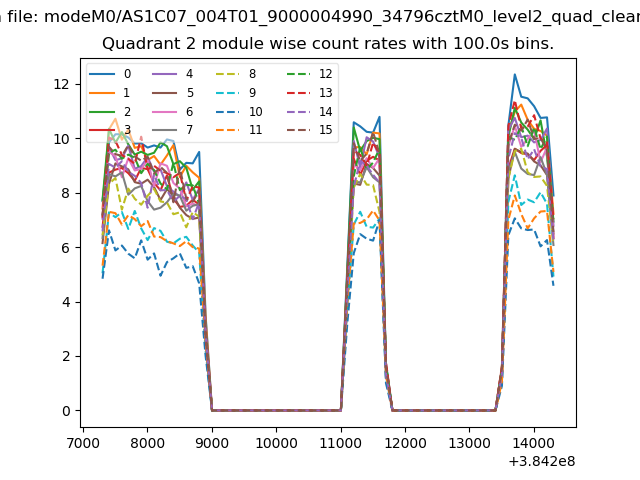
| Module-wise count rates for Quadrant B Data is divided into 100 sec bins |
 |
 |
| Module-wise count rates for Quadrant C Data is divided into 100 sec bins |
 |
 |
| Module-wise count rates for Quadrant D Data is divided into 100 sec bins |
 |
 |
| Parameter | Plot |
|---|---|
| CZT HV Monitor | 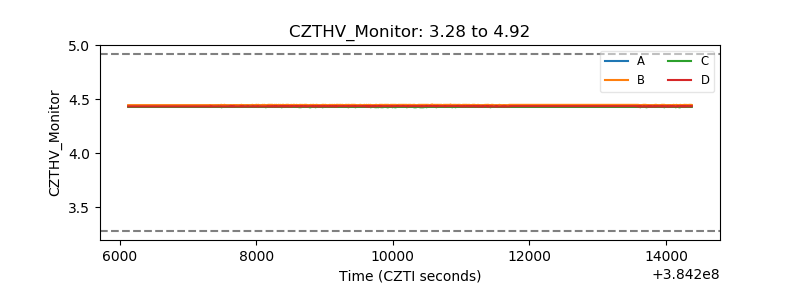 |
| D_VDD | 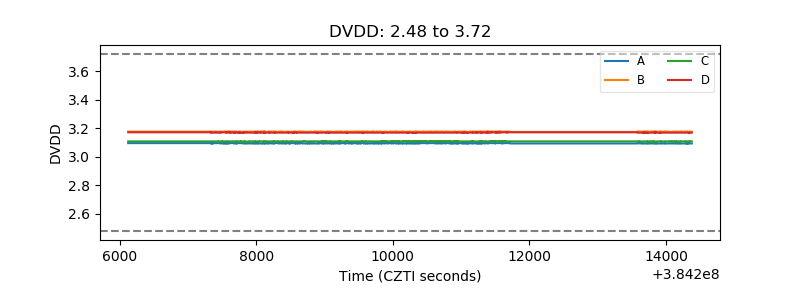 |
| Temperature 1 | 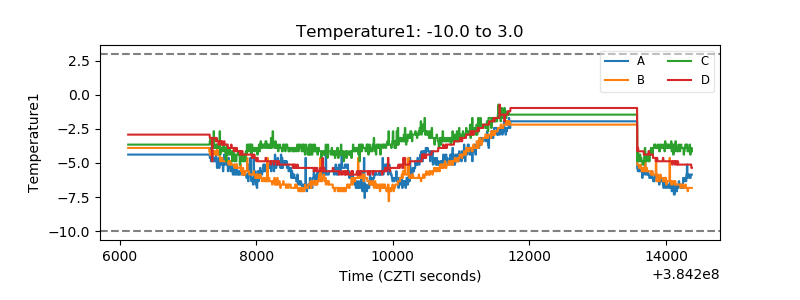 |
| Veto HV Monitor | 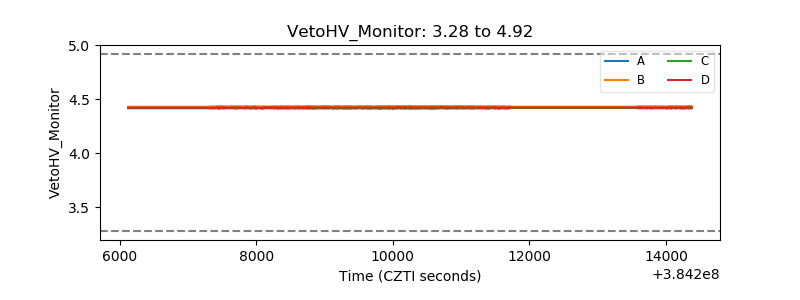 |
| Veto LLD | 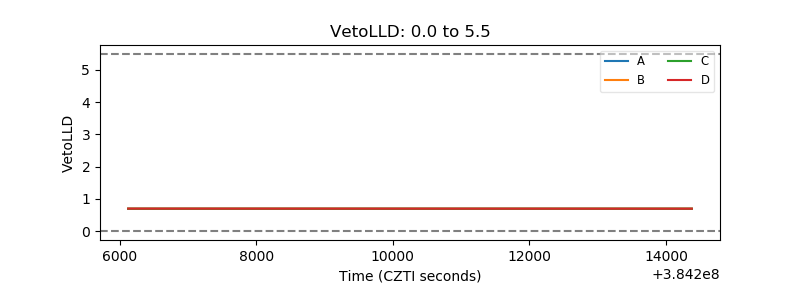 |
| Alpha Counter | 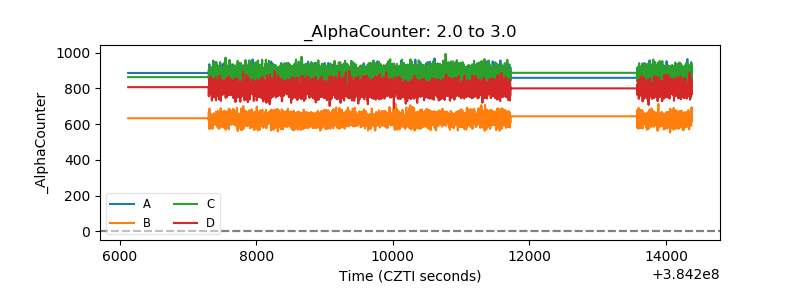 |
| _CPM_Rate | 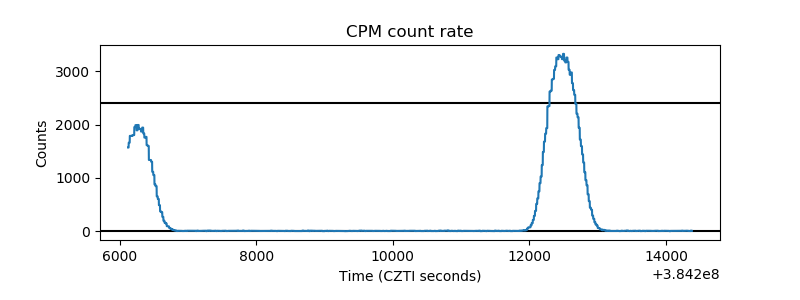 |
| CZT Counter | 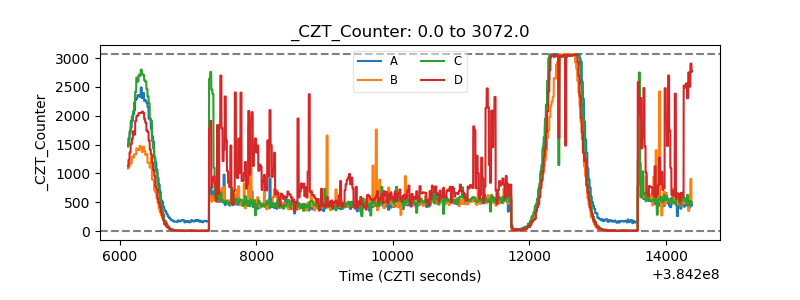 |
| +2.5 Volts monitor | 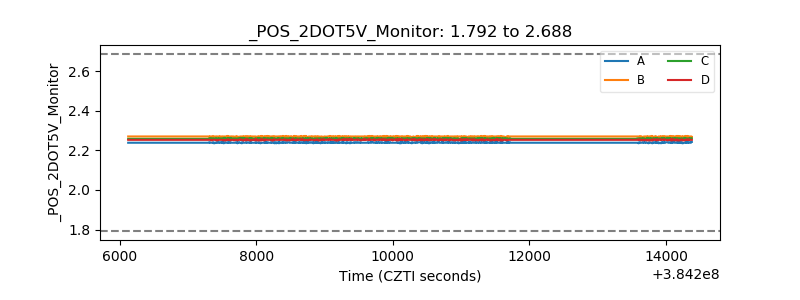 |
| +5 Volts monitor | 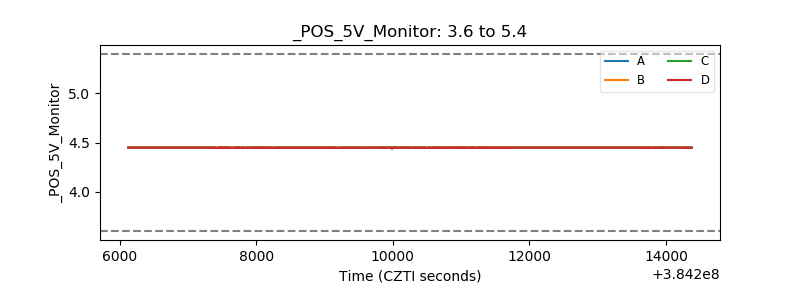 |
| _ROLL_ROT | 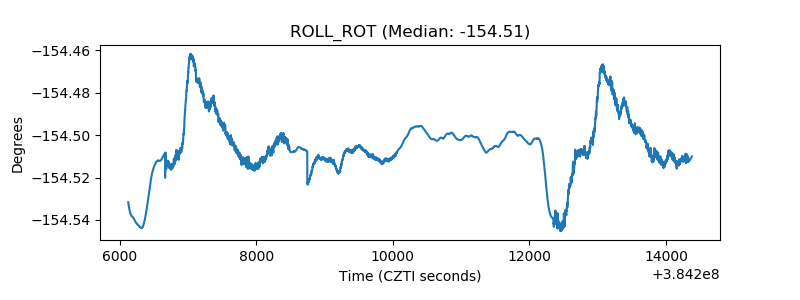 |
| _Roll_DEC | 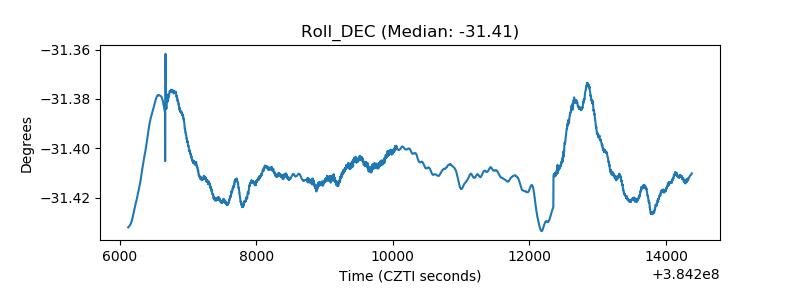 |
| _Roll_RA | 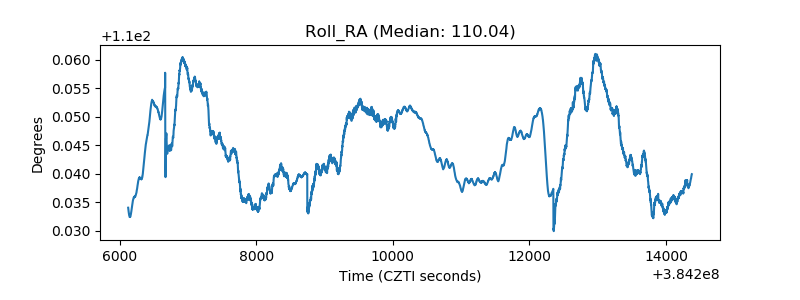 |
| Veto Counter | 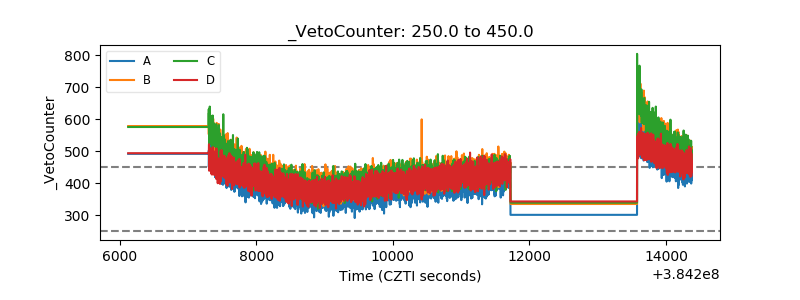 |