| Param | Original file | Final file |
|---|---|---|
| Filename | modeM0/AS1C07_004T01_9000004990_34794cztM0_level2.evt | modeM0/AS1C07_004T01_9000004990_34794cztM0_level2_quad_clean.evt |
| Size (bytes) | 470,160,000 | 62,971,200 |
| Size | 448.4 MB | 60.1 MB |
| Events in quadrant A | 2,474,606 | 397,681 |
| Events in quadrant B | 3,617,643 | 392,324 |
| Events in quadrant C | 2,949,797 | 395,124 |
| Events in quadrant D | 4,836,449 | 349,302 |
| Mode M9 | |||
|---|---|---|---|
| Quadrant | BADHDUFLAG | Total packets | Discarded packets |
| A | 0 | 29 | 0 |
| B | 0 | 29 | 0 |
| C | 0 | 29 | 0 |
| D | 0 | 30 | 0 |
| Mode M0 | |||
|---|---|---|---|
| Quadrant | BADHDUFLAG | Total packets | Discarded packets |
| A | 0 | 10908 | 3 |
| B | 0 | 14100 | 2 |
| C | 0 | 11955 | 2 |
| D | 0 | 17934 | 2 |
| Mode SS | |||
|---|---|---|---|
| Quadrant | BADHDUFLAG | Total packets | Discarded packets |
| A | 0 | 108 | 0 |
| B | 0 | 108 | 0 |
| C | 0 | 108 | 0 |
| D | 0 | 108 | 0 |
| Quadrant | Total seconds | Saturated seconds | Saturation percentage |
|---|---|---|---|
| A | 5312 | 7 | 0.131777% |
| B | 5312 | 364 | 6.852410% |
| C | 5312 | 94 | 1.769578% |
| D | 5312 | 453 | 8.527861% |
Noise dominated data is calculated using 1-second bins in cleaned event files. If a bin has >2000 counts, and if more than 50% of those come from <1% of pixels, then it is considered to be noise-dominated and hence unusable.
| Quadrant | # 1 sec bins | Bins with >0 counts | Bins with >2000 counts | High rate bins dominated by noise | Noise dominated (total time) | Noise dominated (detector-on time) | Marked lightcurve |
|---|---|---|---|---|---|---|---|
| A | 7015 | 5313 | 1 | 1 | 0.01% | 0.02% | 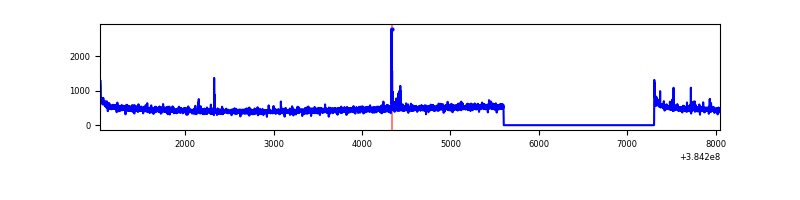 |
| B | 7015 | 5313 | 265 | 265 | 3.78% | 4.99% | 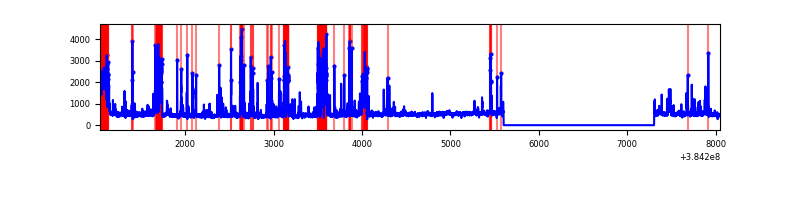 |
| C | 7015 | 5313 | 78 | 78 | 1.11% | 1.47% | 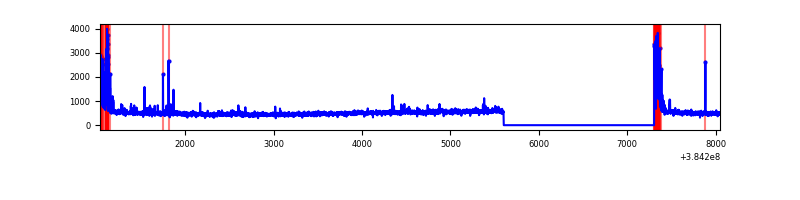 |
| D | 7015 | 5313 | 462 | 462 | 6.59% | 8.70% | 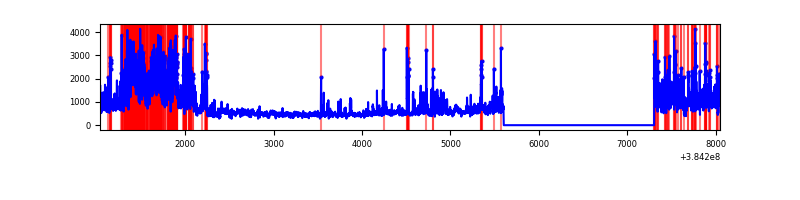 |
Top three noisy pixels from each quadrant. If the there are fewer than three noisy pixels in the level2.evt file, extra rows are filled as -1
| Pixel properties | Quadrant properties | ||||||
|---|---|---|---|---|---|---|---|
| Quadrant | DetID | PixID | Counts | Sigma | Mean | Median | Sigma |
| A | 10 | 83 | 50182 | 393.89 | 618 | 607 | 125.9 |
| A | 7 | 16 | 25536 | 198.07 | 618 | 607 | 125.9 |
| A | 13 | 254 | 9483 | 70.52 | 618 | 607 | 125.9 |
| B | 5 | 172 | 815221 | 7010.46 | 604 | 589 | 116.2 |
| B | 5 | 255 | 195374 | 1676.26 | 604 | 589 | 116.2 |
| B | 4 | 171 | 129274 | 1107.42 | 604 | 589 | 116.2 |
| C | 0 | 10 | 303061 | 2137.19 | 602 | 607 | 141.5 |
| C | 15 | 214 | 229804 | 1619.54 | 602 | 607 | 141.5 |
| C | 14 | 67 | 46245 | 322.49 | 602 | 607 | 141.5 |
| D | 8 | 195 | 1006553 | 7136.2 | 579 | 563 | 141.0 |
| D | 13 | 249 | 766124 | 5430.67 | 579 | 563 | 141.0 |
| D | 2 | 250 | 324405 | 2297.24 | 579 | 563 | 141.0 |
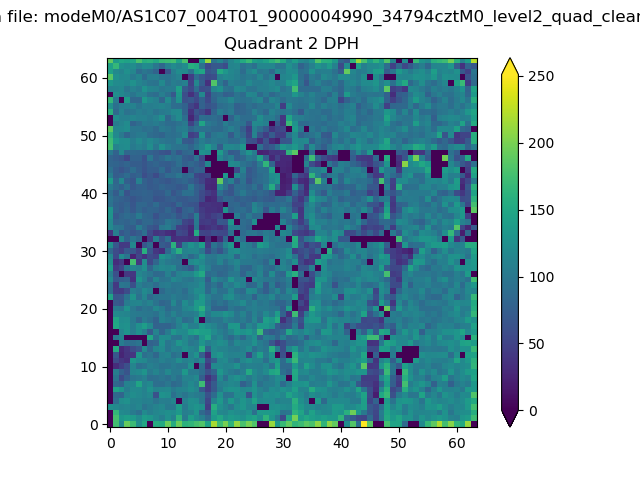
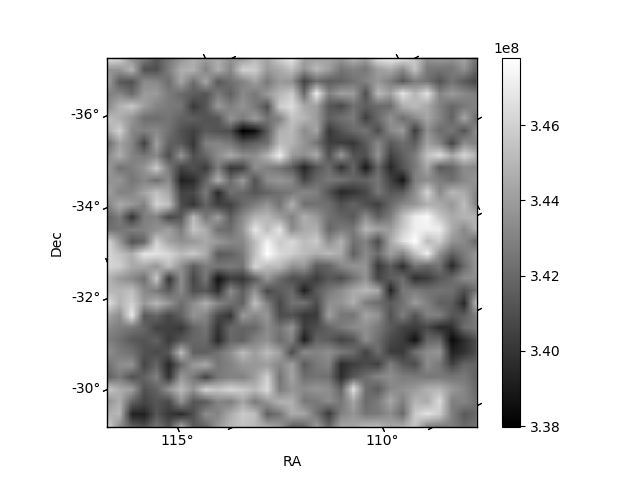
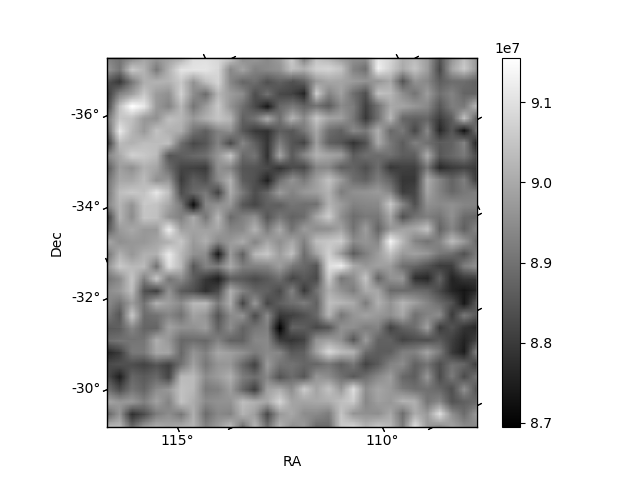
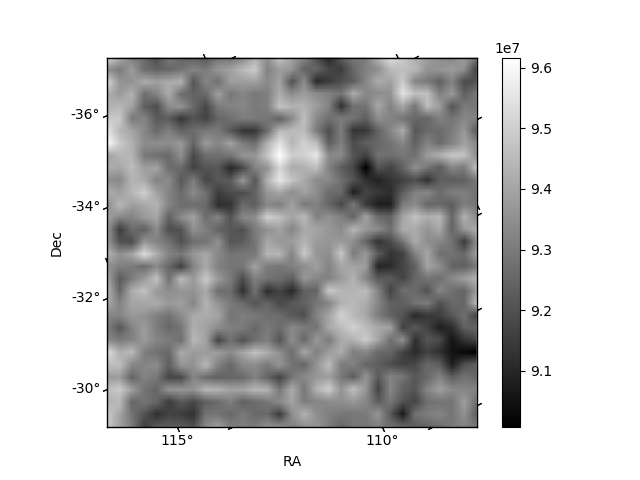
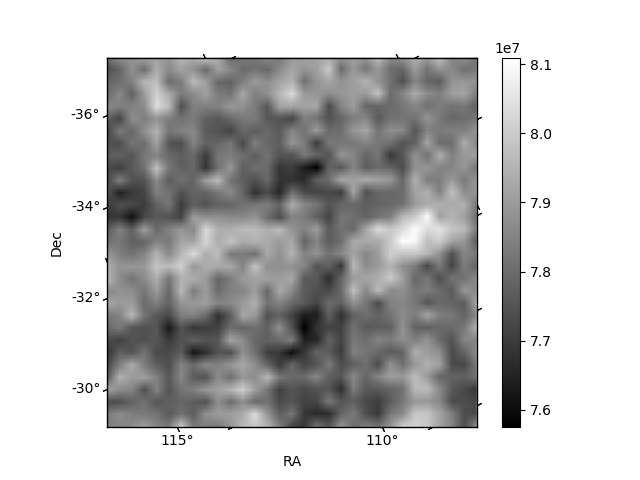
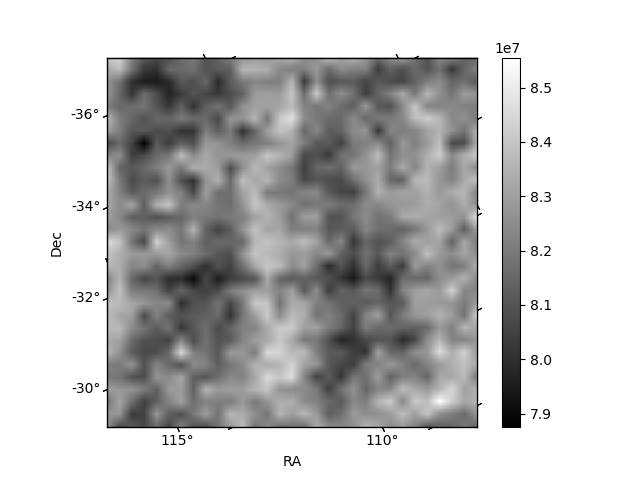
Histogram calculated using DETX and DETY for each event in the final _common_clean file
| Quadrant A | 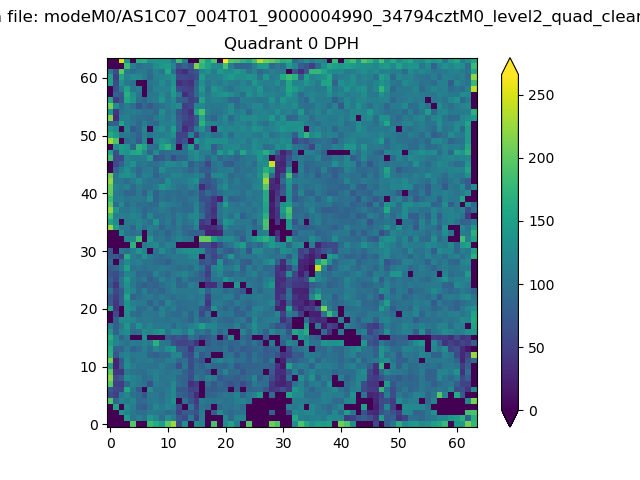 |
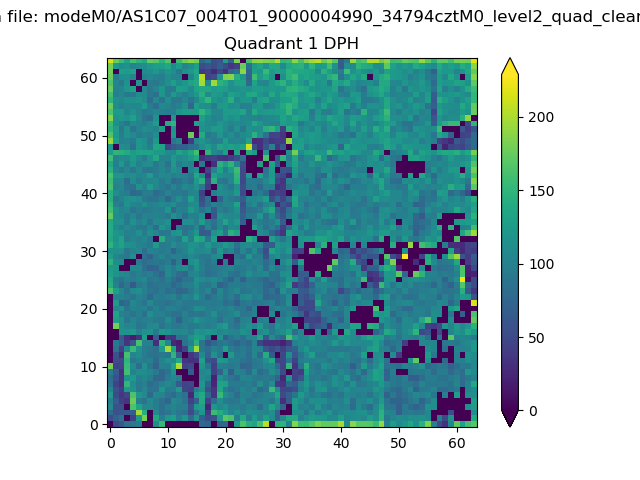 |
Quadrant B |
|---|---|---|---|
| Quadrant D | 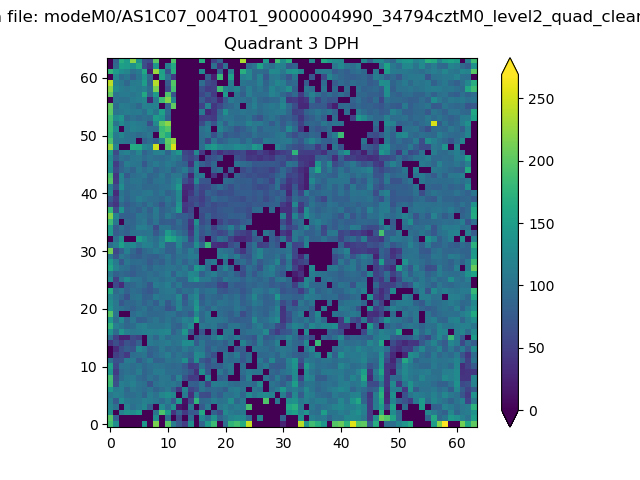 |
 |
Quadrant C |
| Plot type | Count rate plots | Images |
|---|---|---|
| Comparison with Poisson distribution Blue bars denote a histogram of data divided into 1 sec bins. Red curve is a Poisson curve with rate = median count rate of data. |
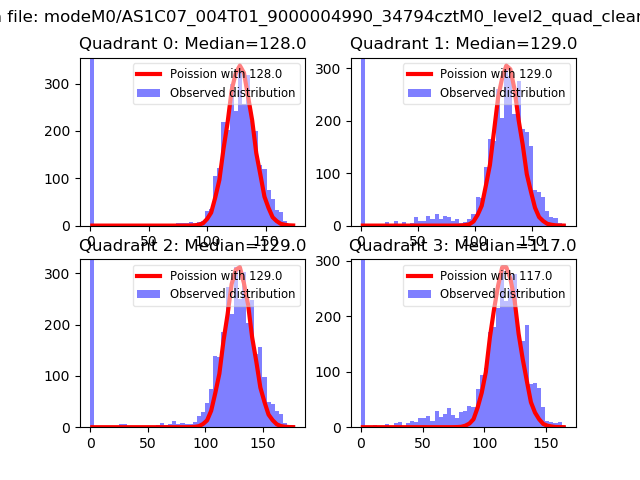 |
 |
| Quadrant-wise count rates Data is divided into 100 sec bins |
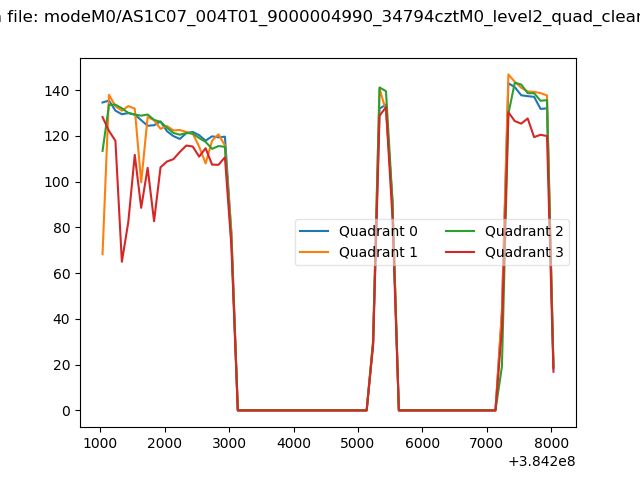 |
|
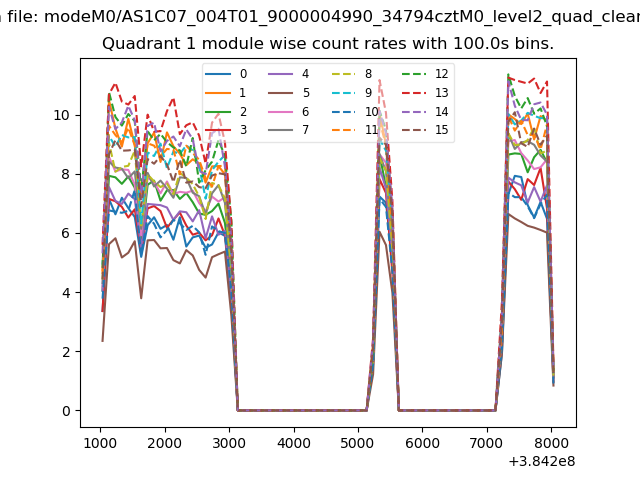
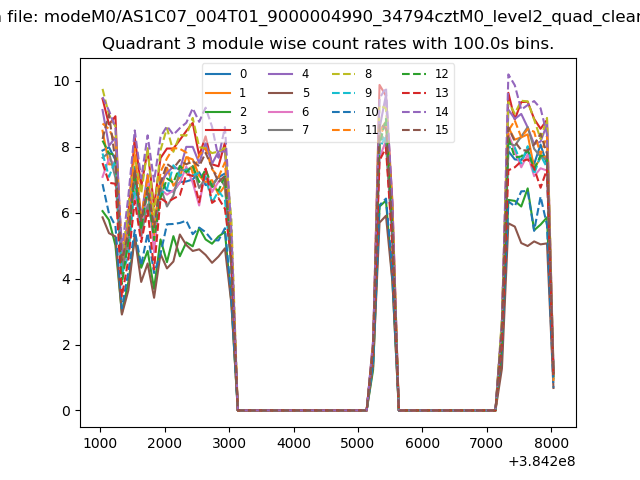
| Module-wise count rates for Quadrant A Data is divided into 100 sec bins |
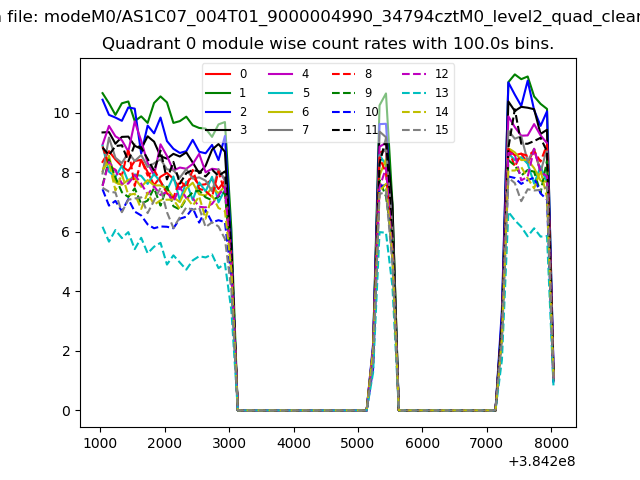 |
 |
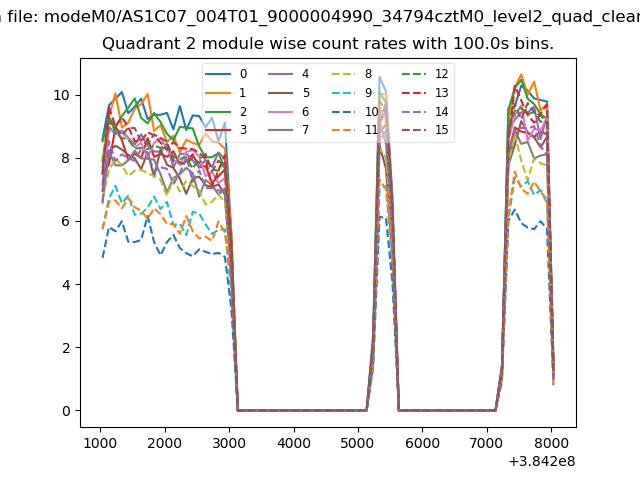
| Module-wise count rates for Quadrant B Data is divided into 100 sec bins |
 |
 |
| Module-wise count rates for Quadrant C Data is divided into 100 sec bins |
 |
 |
| Module-wise count rates for Quadrant D Data is divided into 100 sec bins |
 |
 |
| Parameter | Plot |
|---|---|
| CZT HV Monitor | 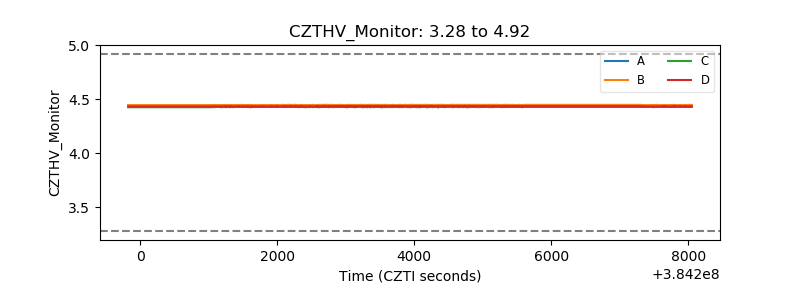 |
| D_VDD | 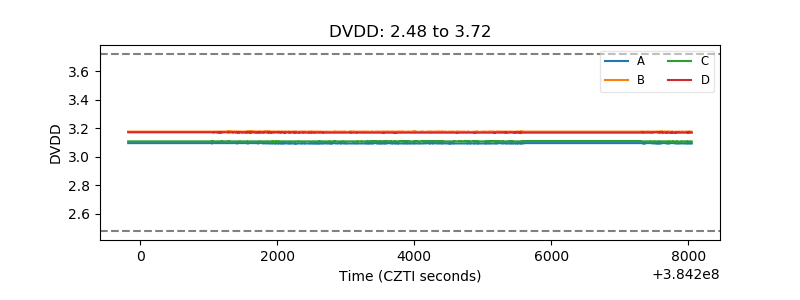 |
| Temperature 1 | 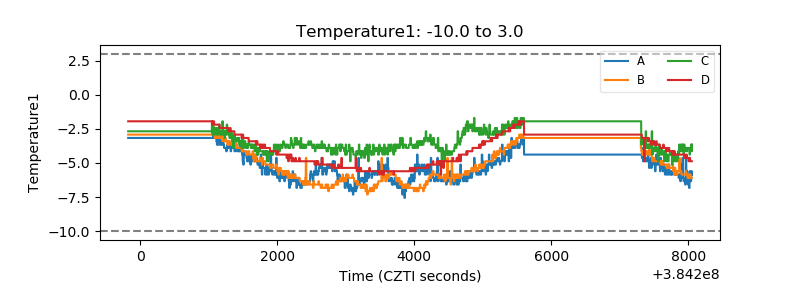 |
| Veto HV Monitor | 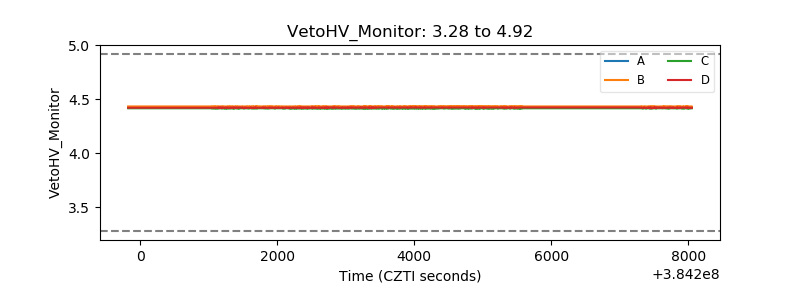 |
| Veto LLD | 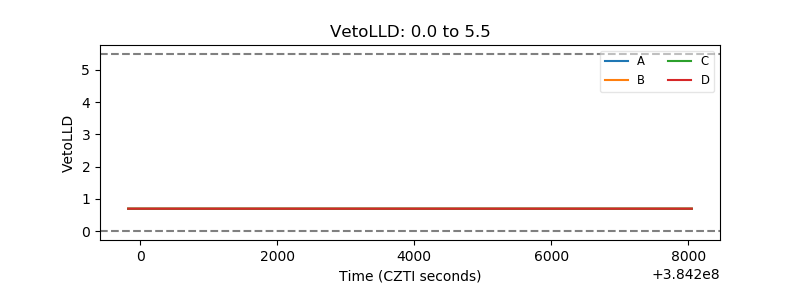 |
| Alpha Counter | 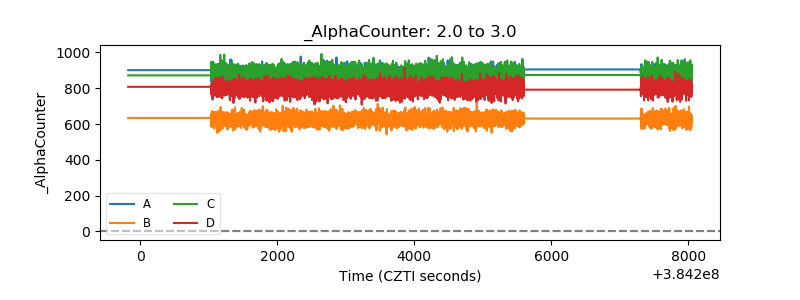 |
| _CPM_Rate | 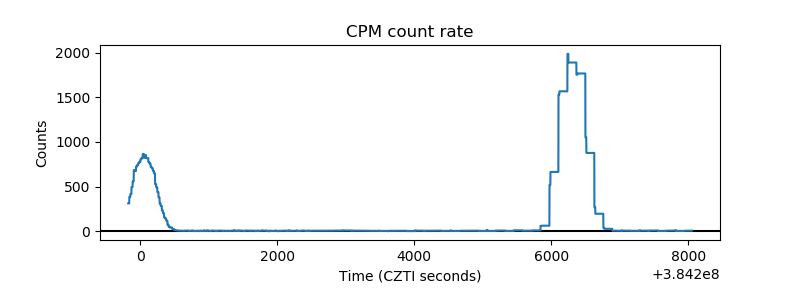 |
| CZT Counter | 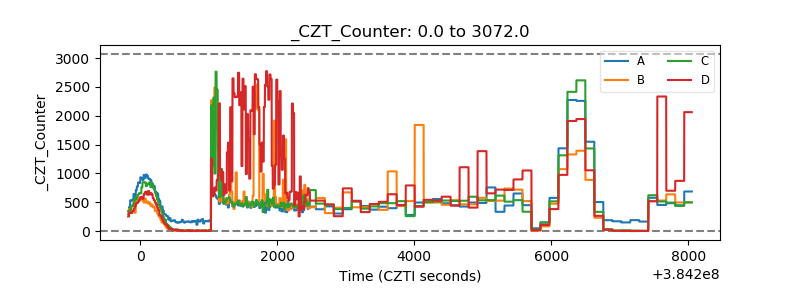 |
| +2.5 Volts monitor | 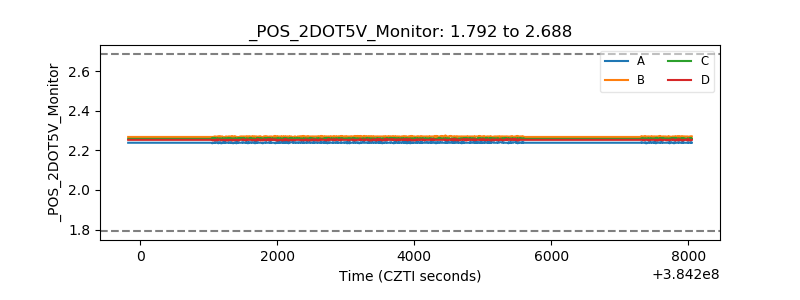 |
| +5 Volts monitor | 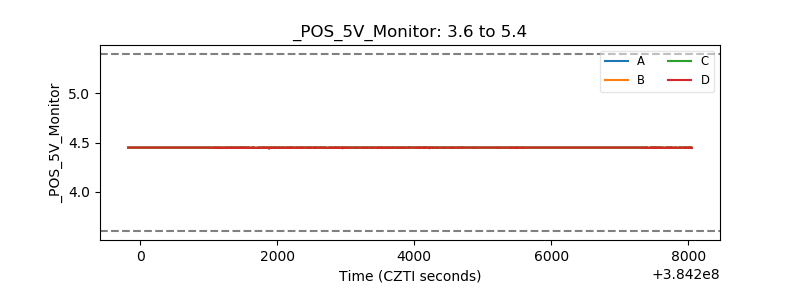 |
| _ROLL_ROT | 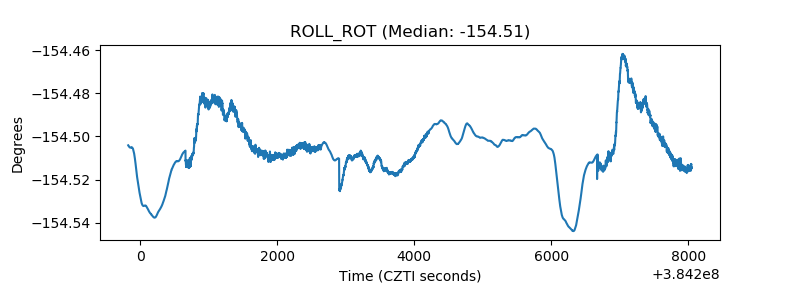 |
| _Roll_DEC | 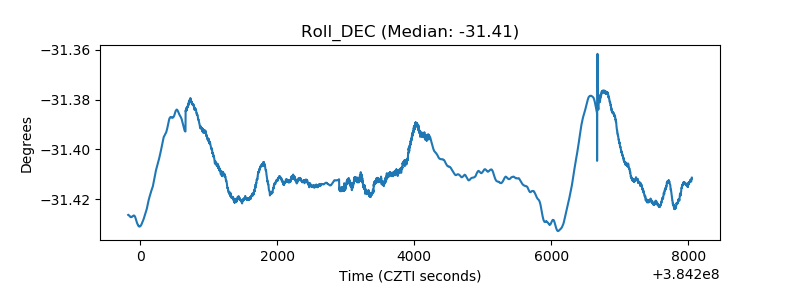 |
| _Roll_RA | 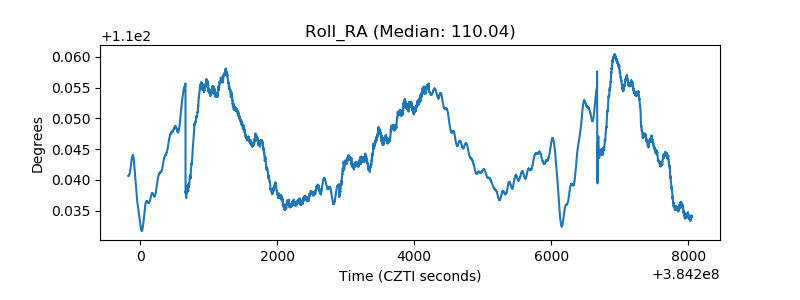 |
| Veto Counter | 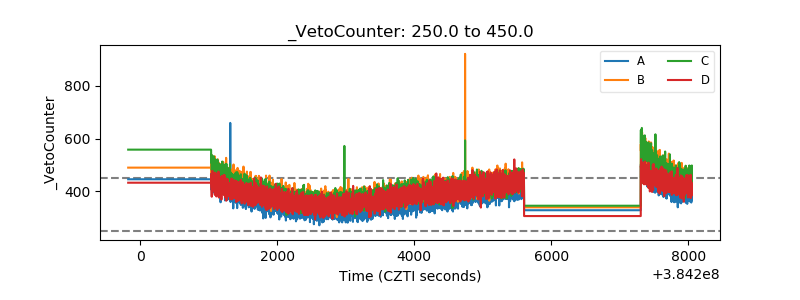 |