| Param | Original file | Final file |
|---|---|---|
| Filename | modeM0/AS1C07_004T01_9000004990_34781cztM0_level2.evt | modeM0/AS1C07_004T01_9000004990_34781cztM0_level2_quad_clean.evt |
| Size (bytes) | 424,725,120 | 68,512,320 |
| Size | 405.0 MB | 65.3 MB |
| Events in quadrant A | 2,730,149 | 426,862 |
| Events in quadrant B | 3,385,689 | 437,506 |
| Events in quadrant C | 2,895,828 | 428,375 |
| Events in quadrant D | 3,482,730 | 402,139 |
| Mode M9 | |||
|---|---|---|---|
| Quadrant | BADHDUFLAG | Total packets | Discarded packets |
| A | 0 | 28 | 0 |
| B | 0 | 28 | 0 |
| C | 0 | 28 | 0 |
| D | 0 | 29 | 0 |
| Mode M0 | |||
|---|---|---|---|
| Quadrant | BADHDUFLAG | Total packets | Discarded packets |
| A | 0 | 11524 | 2 |
| B | 0 | 13470 | 1 |
| C | 0 | 11735 | 1 |
| D | 0 | 14012 | 1 |
| Mode SS | |||
|---|---|---|---|
| Quadrant | BADHDUFLAG | Total packets | Discarded packets |
| A | 0 | 110 | 0 |
| B | 0 | 110 | 0 |
| C | 0 | 110 | 0 |
| D | 0 | 110 | 0 |
| Quadrant | Total seconds | Saturated seconds | Saturation percentage |
|---|---|---|---|
| A | 5423 | 15 | 0.276600% |
| B | 5423 | 227 | 4.185875% |
| C | 5423 | 54 | 0.995759% |
| D | 5423 | 71 | 1.309238% |
Noise dominated data is calculated using 1-second bins in cleaned event files. If a bin has >2000 counts, and if more than 50% of those come from <1% of pixels, then it is considered to be noise-dominated and hence unusable.
| Quadrant | # 1 sec bins | Bins with >0 counts | Bins with >2000 counts | High rate bins dominated by noise | Noise dominated (total time) | Noise dominated (detector-on time) | Marked lightcurve |
|---|---|---|---|---|---|---|---|
| A | 7186 | 5424 | 2 | 2 | 0.03% | 0.04% | 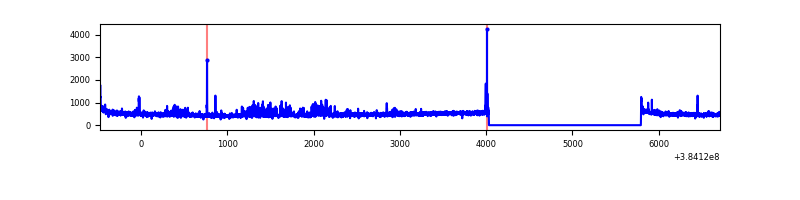 |
| B | 7186 | 5424 | 134 | 134 | 1.86% | 2.47% | 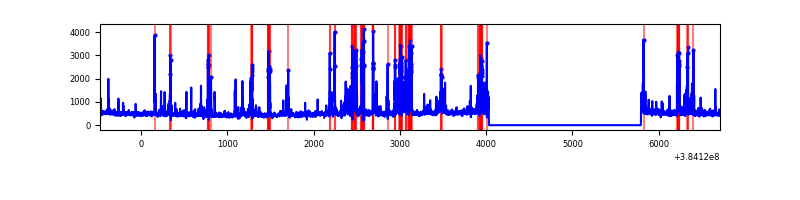 |
| C | 7186 | 5424 | 39 | 39 | 0.54% | 0.72% | 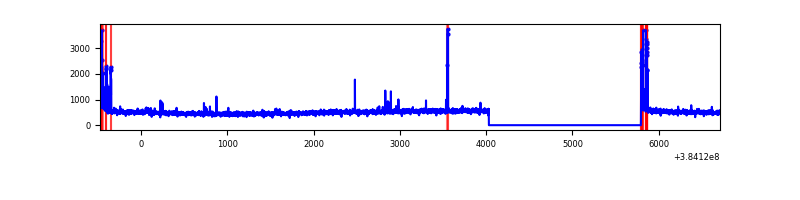 |
| D | 7186 | 5424 | 53 | 53 | 0.74% | 0.98% | 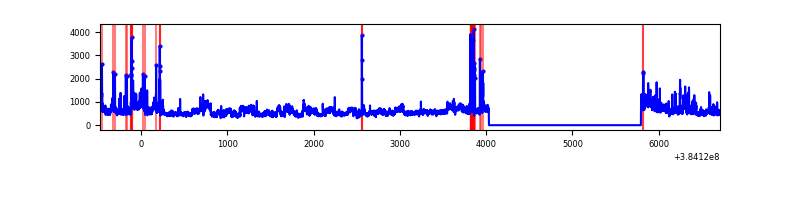 |
Top three noisy pixels from each quadrant. If the there are fewer than three noisy pixels in the level2.evt file, extra rows are filled as -1
| Pixel properties | Quadrant properties | ||||||
|---|---|---|---|---|---|---|---|
| Quadrant | DetID | PixID | Counts | Sigma | Mean | Median | Sigma |
| A | 15 | 223 | 123177 | 955.91 | 637 | 625 | 128.2 |
| A | 10 | 83 | 49601 | 382.01 | 637 | 625 | 128.2 |
| A | 7 | 16 | 49148 | 378.48 | 637 | 625 | 128.2 |
| B | 5 | 172 | 755152 | 6184.76 | 633 | 617 | 122.0 |
| B | 5 | 255 | 39831 | 321.43 | 633 | 617 | 122.0 |
| B | 0 | 190 | 36537 | 294.43 | 633 | 617 | 122.0 |
| C | 15 | 214 | 231811 | 1605.3 | 623 | 627 | 144.0 |
| C | 0 | 10 | 125538 | 867.36 | 623 | 627 | 144.0 |
| C | 15 | 208 | 49296 | 337.95 | 623 | 627 | 144.0 |
| D | 8 | 195 | 655270 | 4320.87 | 614 | 598 | 151.5 |
| D | 1 | 52 | 145878 | 958.86 | 614 | 598 | 151.5 |
| D | 12 | 6 | 135448 | 890.02 | 614 | 598 | 151.5 |
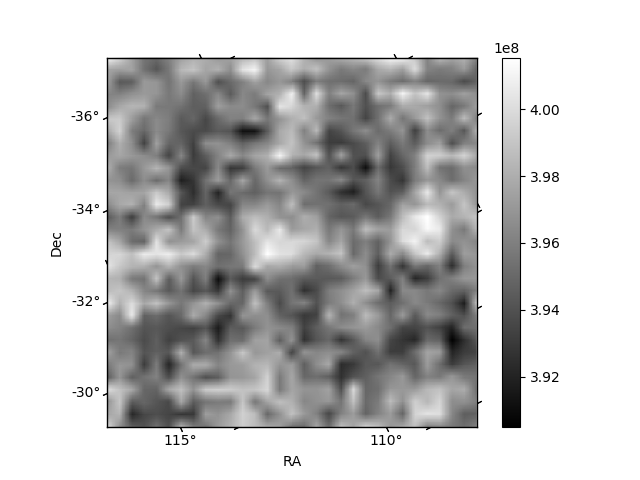
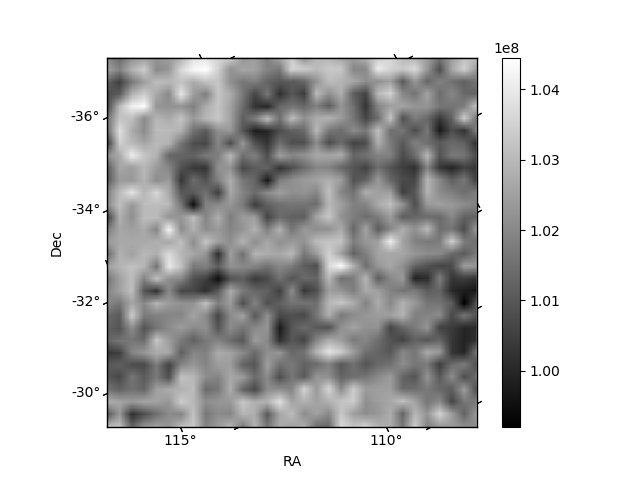
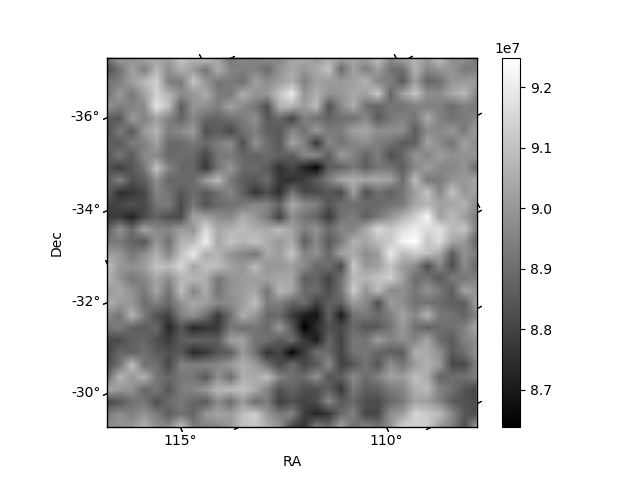
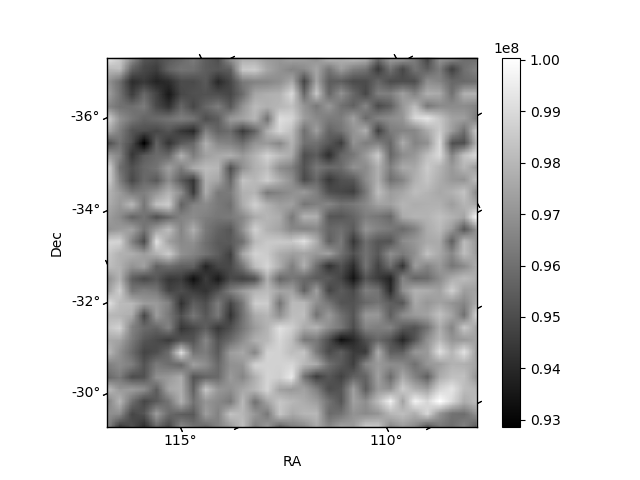
Histogram calculated using DETX and DETY for each event in the final _common_clean file
| Quadrant A | 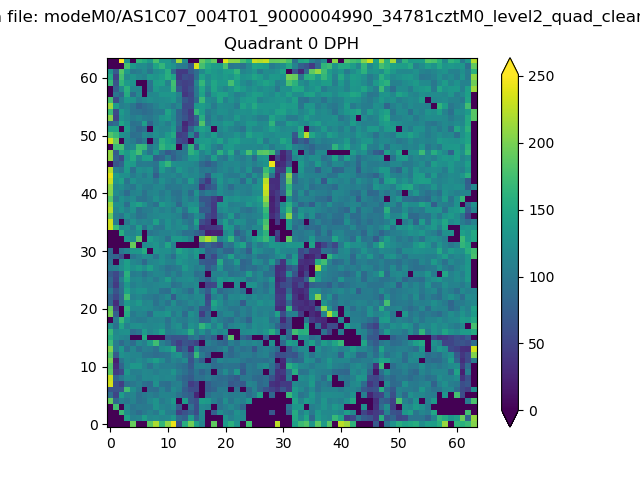 |
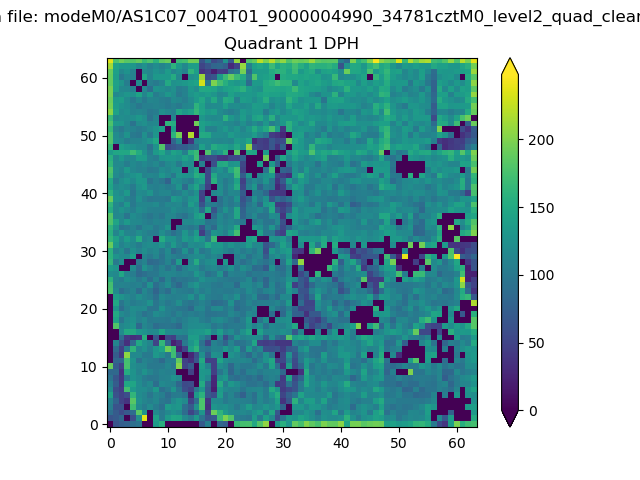 |
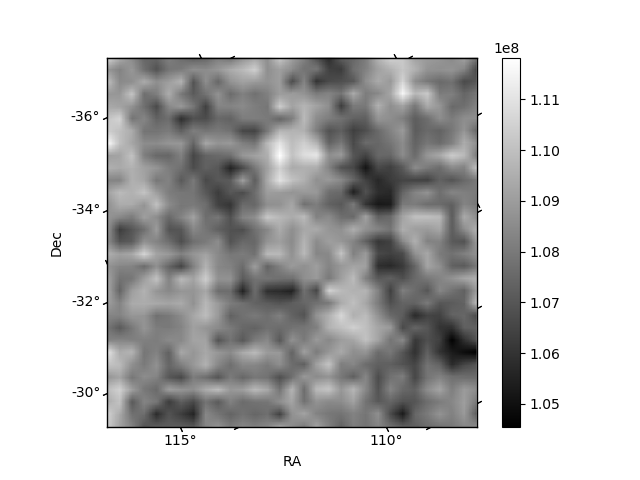
Quadrant B |
|---|---|---|---|
| Quadrant D | 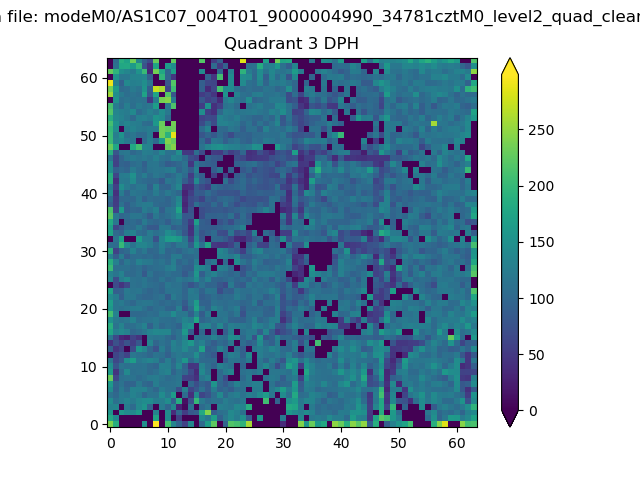 |
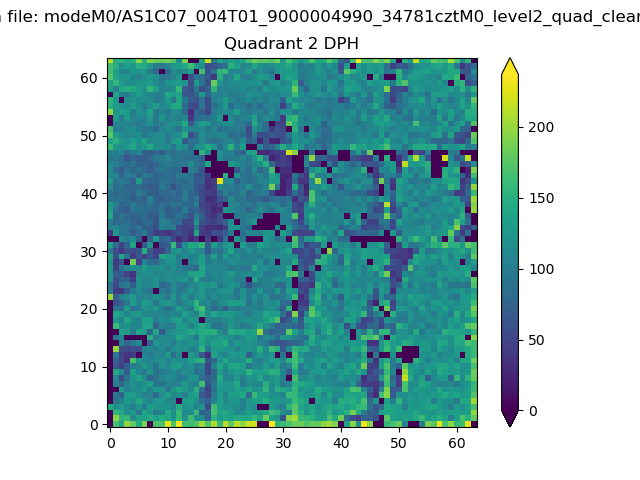 |
Quadrant C |
| Plot type | Count rate plots | Images |
|---|---|---|
| Comparison with Poisson distribution Blue bars denote a histogram of data divided into 1 sec bins. Red curve is a Poisson curve with rate = median count rate of data. |
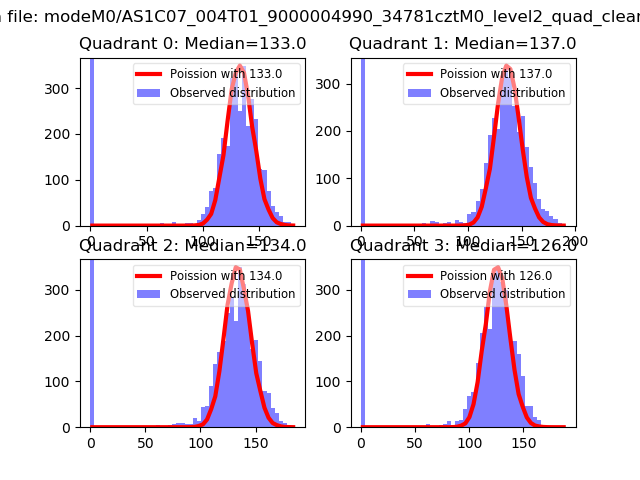 |
 |
| Quadrant-wise count rates Data is divided into 100 sec bins |
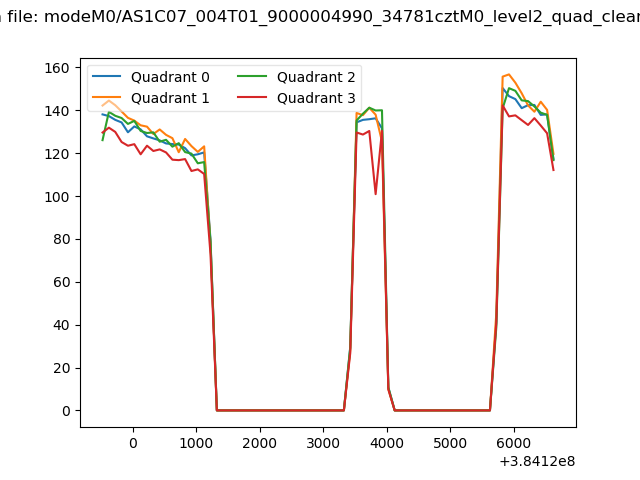 |
|
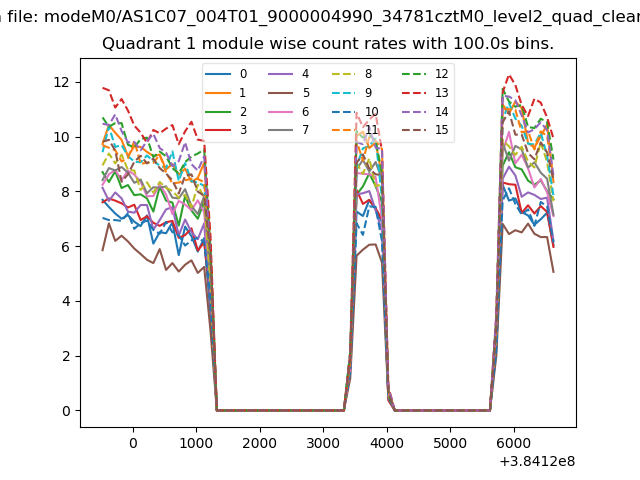
| Module-wise count rates for Quadrant A Data is divided into 100 sec bins |
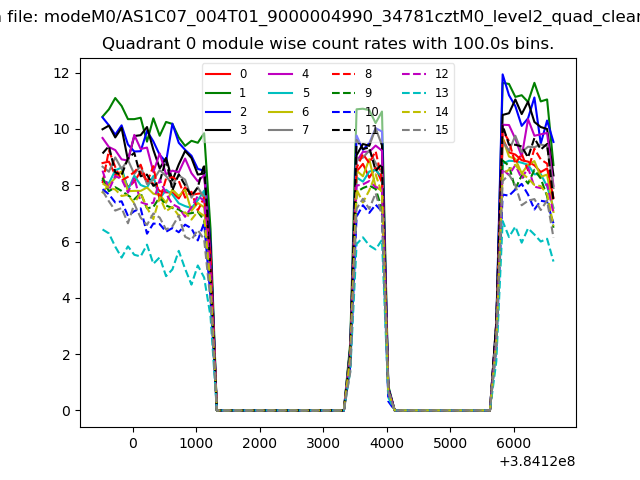 |
 |
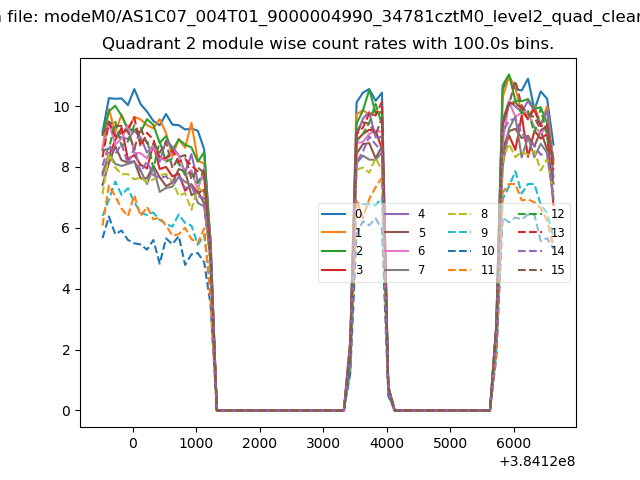
| Module-wise count rates for Quadrant B Data is divided into 100 sec bins |
 |
 |
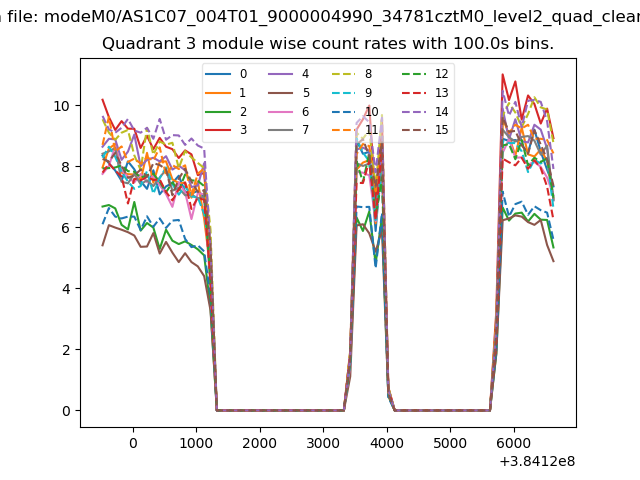
| Module-wise count rates for Quadrant C Data is divided into 100 sec bins |
 |
 |
| Module-wise count rates for Quadrant D Data is divided into 100 sec bins |
 |
 |
| Parameter | Plot |
|---|---|
| CZT HV Monitor | 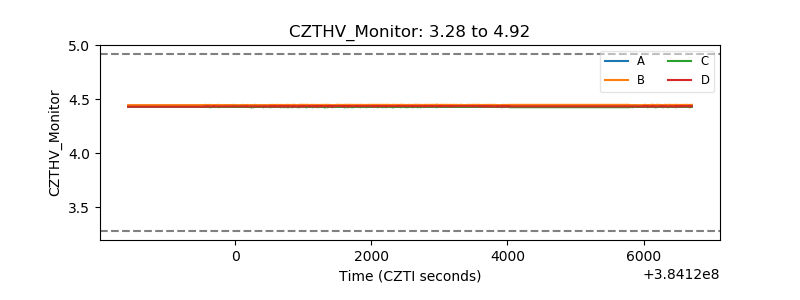 |
| D_VDD | 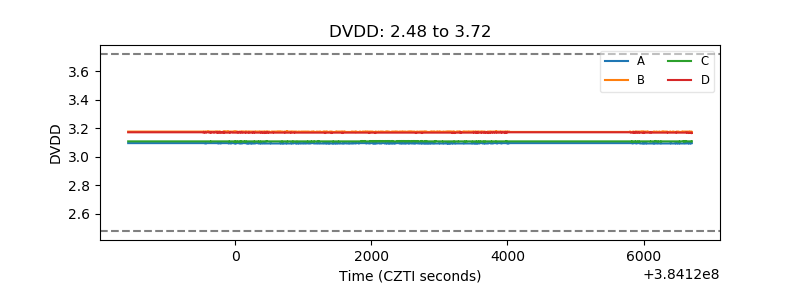 |
| Temperature 1 | 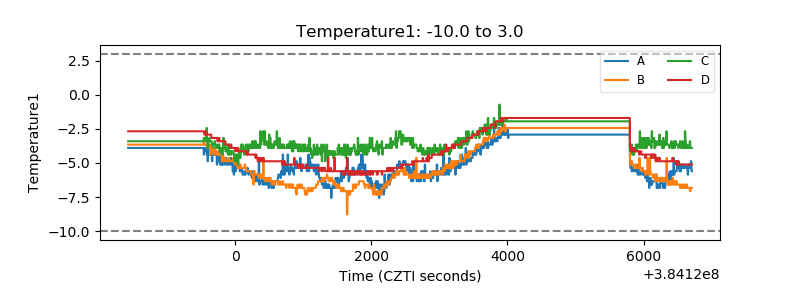 |
| Veto HV Monitor | 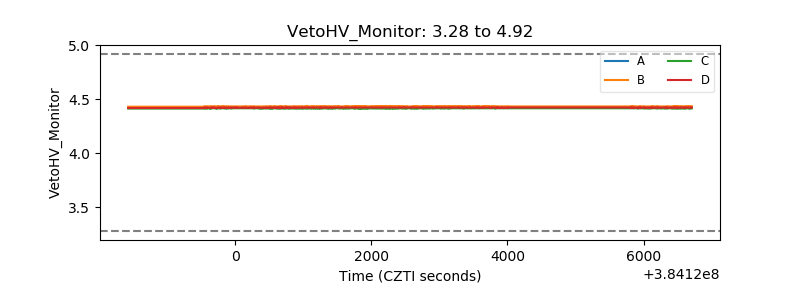 |
| Veto LLD | 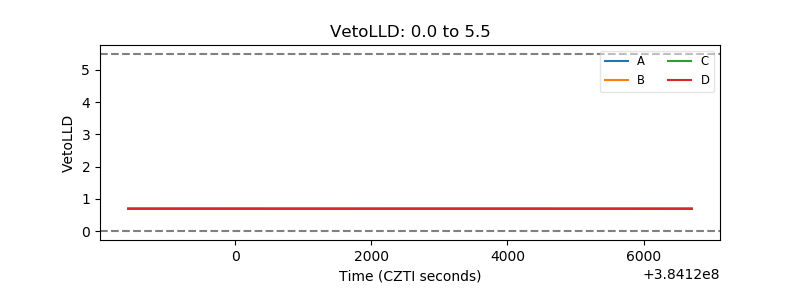 |
| Alpha Counter | 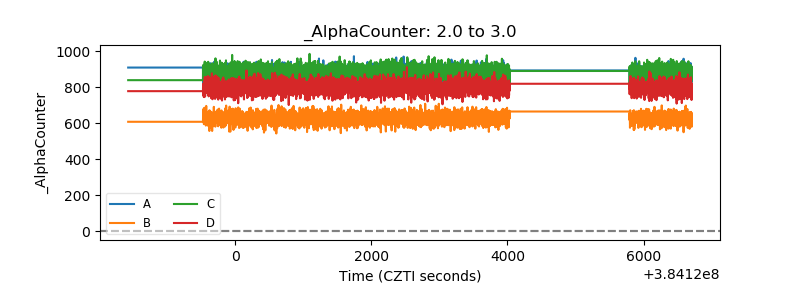 |
| _CPM_Rate | 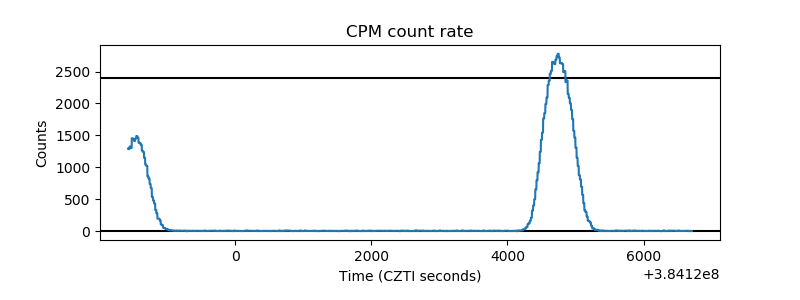 |
| CZT Counter | 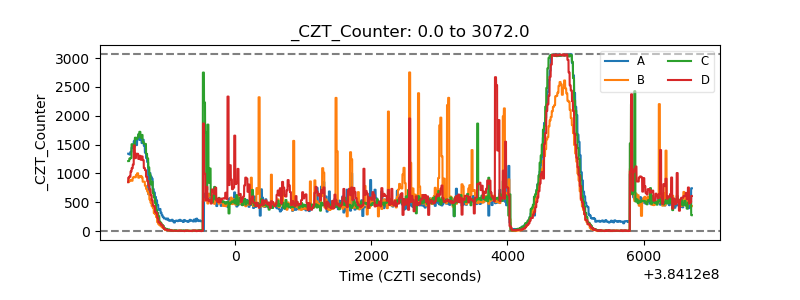 |
| +2.5 Volts monitor | 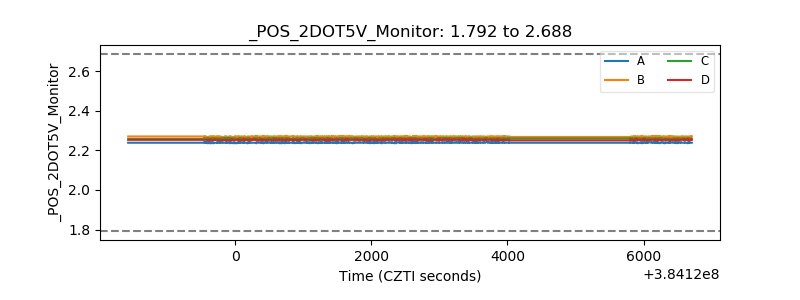 |
| +5 Volts monitor | 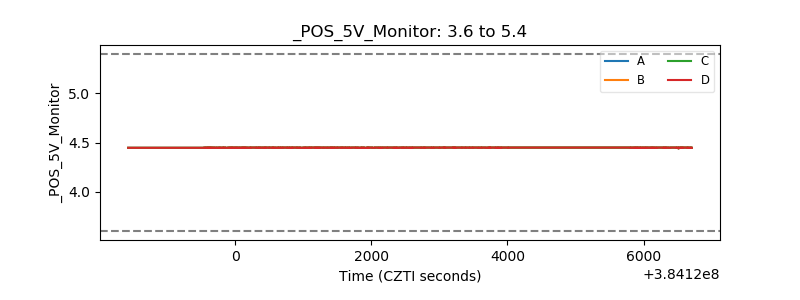 |
| _ROLL_ROT | 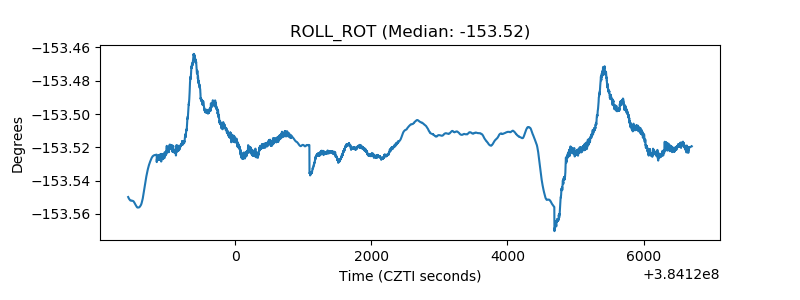 |
| _Roll_DEC | 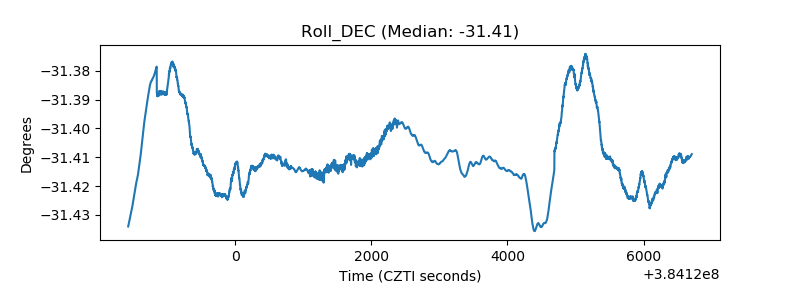 |
| _Roll_RA | 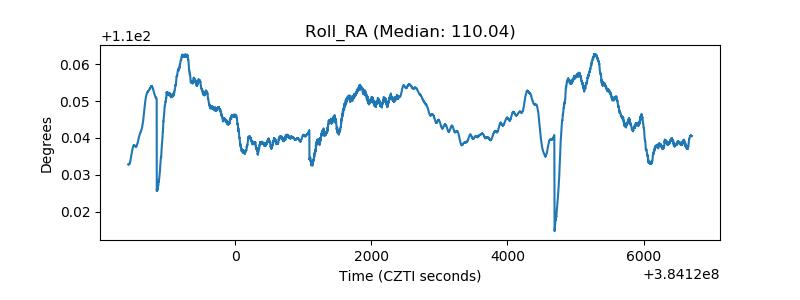 |
| Veto Counter | 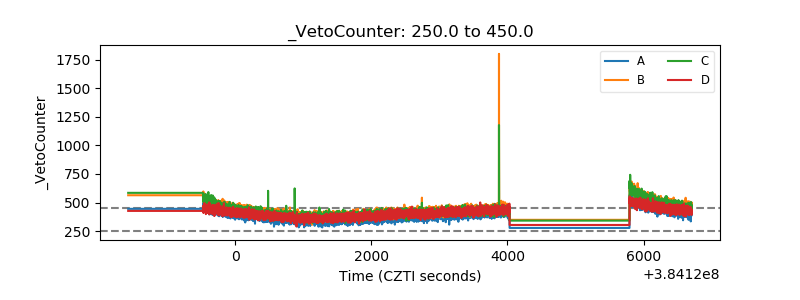 |