| Param | Original file | Final file |
|---|---|---|
| Filename | modeM0/AS1C07_004T01_9000004990_34778cztM0_level2.evt | modeM0/AS1C07_004T01_9000004990_34778cztM0_level2_quad_clean.evt |
| Size (bytes) | 866,882,880 | 129,683,520 |
| Size | 826.7 MB | 123.7 MB |
| Events in quadrant A | 5,229,049 | 816,259 |
| Events in quadrant B | 6,820,737 | 817,402 |
| Events in quadrant C | 5,208,224 | 827,450 |
| Events in quadrant D | 8,319,301 | 772,245 |
| Mode M9 | |||
|---|---|---|---|
| Quadrant | BADHDUFLAG | Total packets | Discarded packets |
| A | 0 | 27 | 0 |
| B | 0 | 27 | 0 |
| C | 0 | 27 | 0 |
| D | 0 | 28 | 0 |
| Mode M0 | |||
|---|---|---|---|
| Quadrant | BADHDUFLAG | Total packets | Discarded packets |
| A | 0 | 21930 | 4 |
| B | 0 | 26796 | 3 |
| C | 0 | 21525 | 3 |
| D | 0 | 31646 | 3 |
| Mode SS | |||
|---|---|---|---|
| Quadrant | BADHDUFLAG | Total packets | Discarded packets |
| A | 0 | 204 | 0 |
| B | 0 | 204 | 0 |
| C | 0 | 204 | 0 |
| D | 0 | 204 | 0 |
| Quadrant | Total seconds | Saturated seconds | Saturation percentage |
|---|---|---|---|
| A | 10015 | 41 | 0.409386% |
| B | 10015 | 588 | 5.871193% |
| C | 10015 | 50 | 0.499251% |
| D | 10015 | 472 | 4.712931% |
Noise dominated data is calculated using 1-second bins in cleaned event files. If a bin has >2000 counts, and if more than 50% of those come from <1% of pixels, then it is considered to be noise-dominated and hence unusable.
| Quadrant | # 1 sec bins | Bins with >0 counts | Bins with >2000 counts | High rate bins dominated by noise | Noise dominated (total time) | Noise dominated (detector-on time) | Marked lightcurve |
|---|---|---|---|---|---|---|---|
| A | 12730 | 10017 | 26 | 26 | 0.20% | 0.26% | 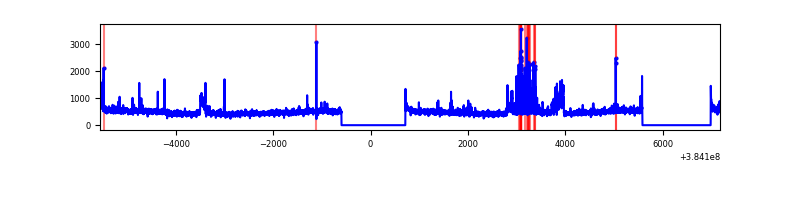 |
| B | 12730 | 10017 | 386 | 386 | 3.03% | 3.85% | 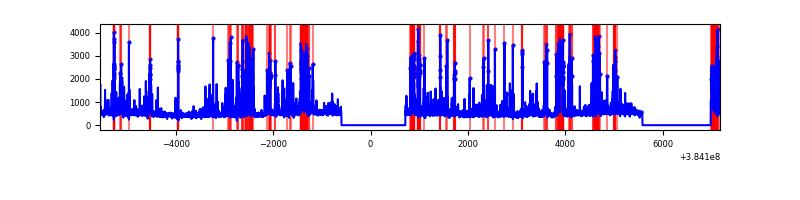 |
| C | 12730 | 10017 | 32 | 32 | 0.25% | 0.32% | 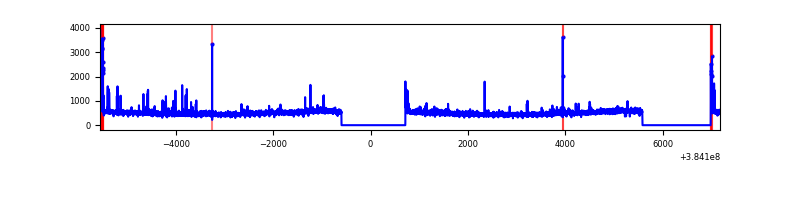 |
| D | 12730 | 10017 | 352 | 352 | 2.77% | 3.51% | 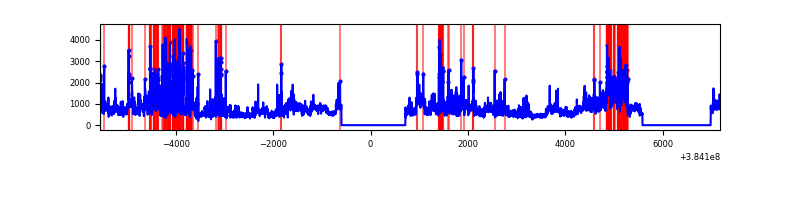 |
Top three noisy pixels from each quadrant. If the there are fewer than three noisy pixels in the level2.evt file, extra rows are filled as -1
| Pixel properties | Quadrant properties | ||||||
|---|---|---|---|---|---|---|---|
| Quadrant | DetID | PixID | Counts | Sigma | Mean | Median | Sigma |
| A | 15 | 169 | 573331 | 2454.65 | 1159 | 1138 | 233.1 |
| A | 10 | 83 | 75619 | 319.52 | 1159 | 1138 | 233.1 |
| A | 7 | 16 | 57892 | 243.47 | 1159 | 1138 | 233.1 |
| B | 5 | 172 | 1568764 | 7164.46 | 1137 | 1107 | 218.8 |
| B | 4 | 232 | 208311 | 946.96 | 1137 | 1107 | 218.8 |
| B | 5 | 200 | 168903 | 766.86 | 1137 | 1107 | 218.8 |
| C | 15 | 214 | 426057 | 1612.12 | 1132 | 1142 | 263.6 |
| C | 0 | 10 | 148695 | 559.81 | 1132 | 1142 | 263.6 |
| C | 14 | 67 | 116493 | 437.64 | 1132 | 1142 | 263.6 |
| D | 8 | 195 | 2005783 | 7347.59 | 1115 | 1083 | 272.8 |
| D | 1 | 52 | 775163 | 2837.14 | 1115 | 1083 | 272.8 |
| D | 10 | 199 | 443154 | 1620.27 | 1115 | 1083 | 272.8 |
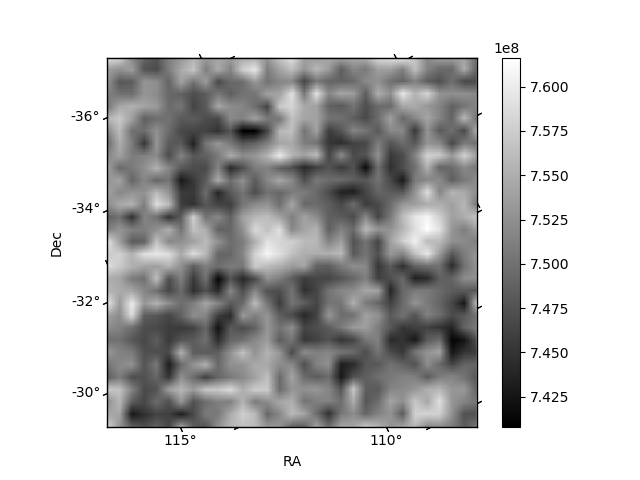
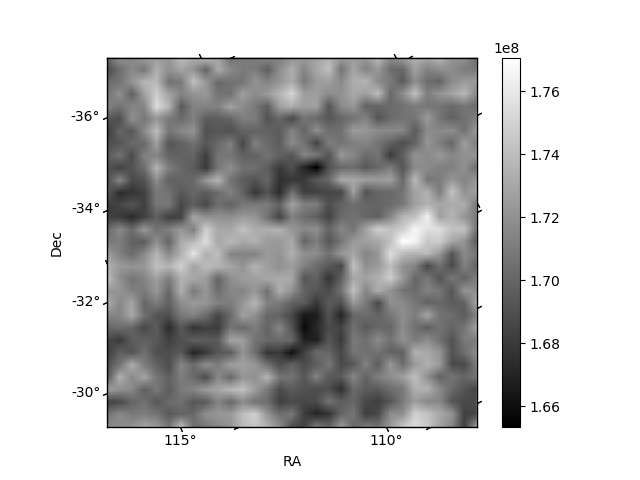
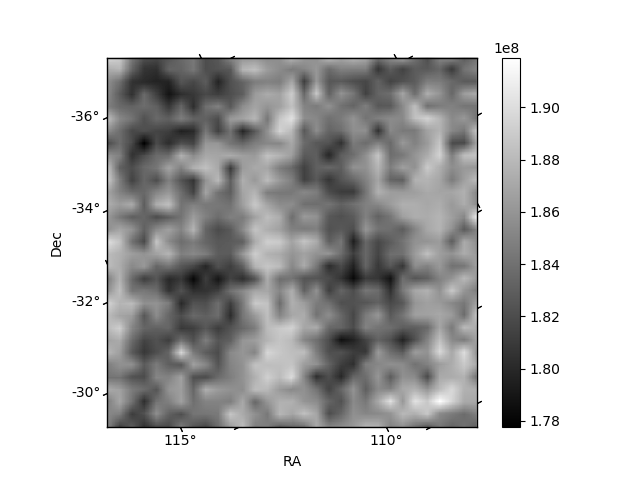
Histogram calculated using DETX and DETY for each event in the final _common_clean file
| Quadrant A | 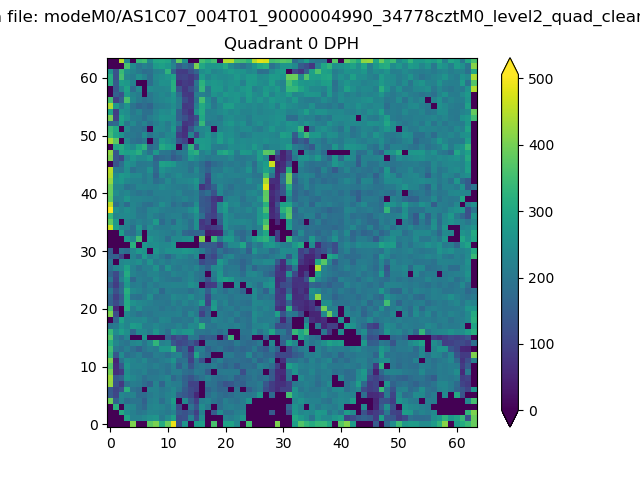 |
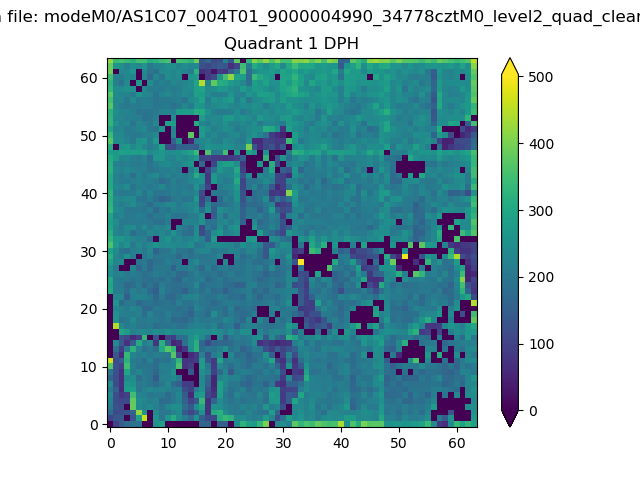 |
Quadrant B |
|---|---|---|---|
| Quadrant D | 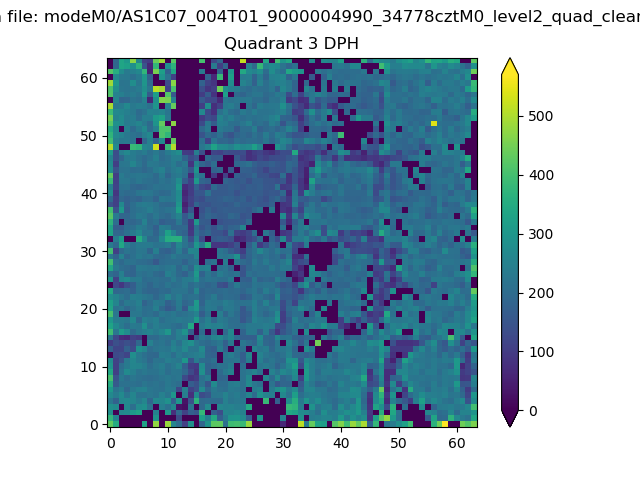 |
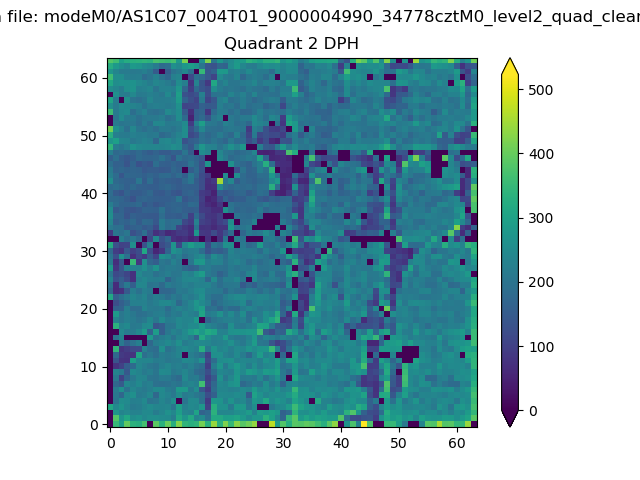 |
Quadrant C |
| Plot type | Count rate plots | Images |
|---|---|---|
| Comparison with Poisson distribution Blue bars denote a histogram of data divided into 1 sec bins. Red curve is a Poisson curve with rate = median count rate of data. |
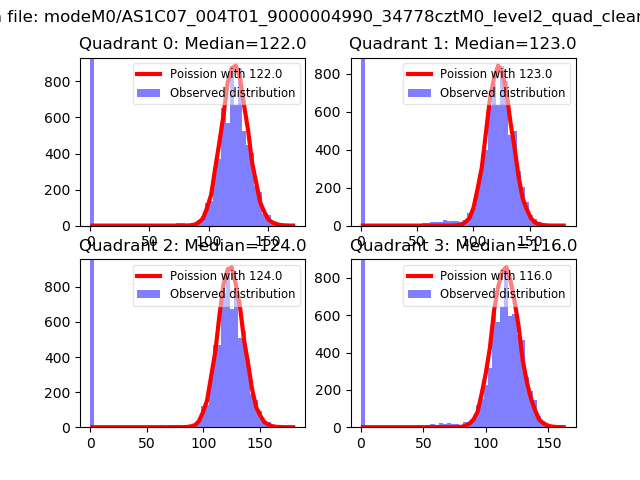 |
 |
| Quadrant-wise count rates Data is divided into 100 sec bins |
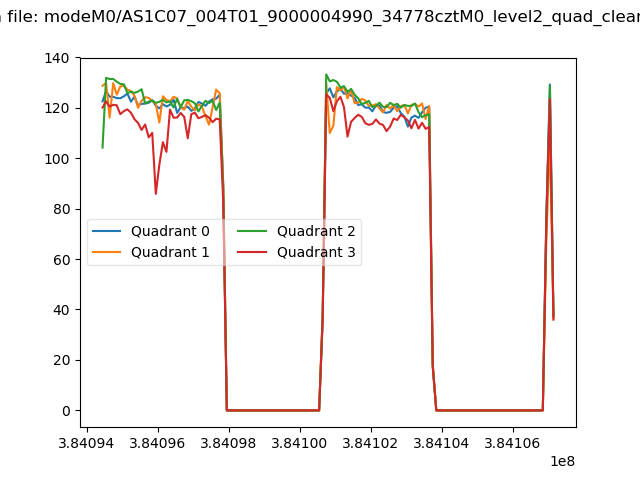 |
|
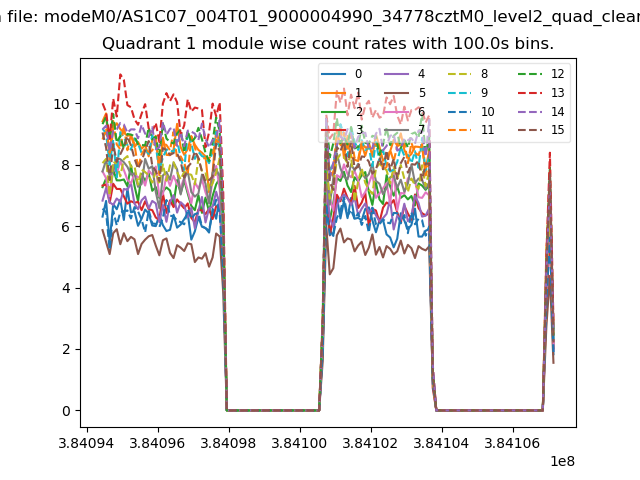
| Module-wise count rates for Quadrant A Data is divided into 100 sec bins |
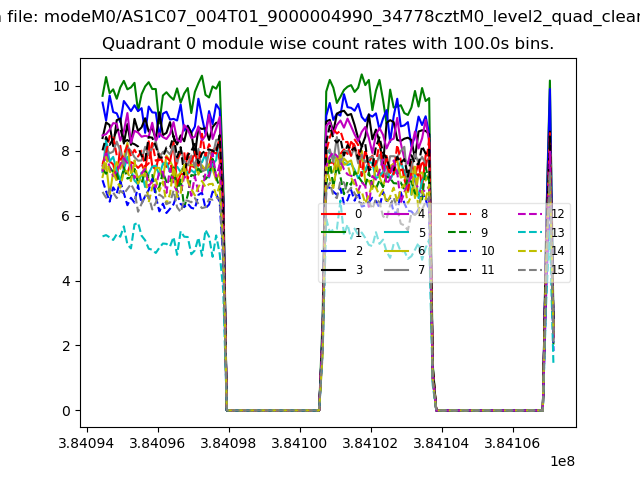 |
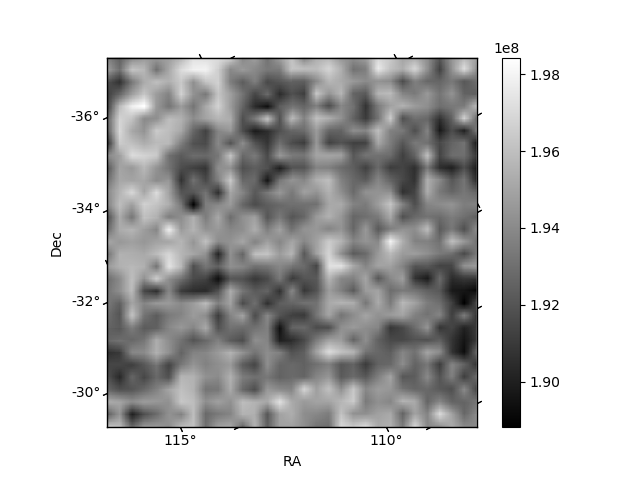 |
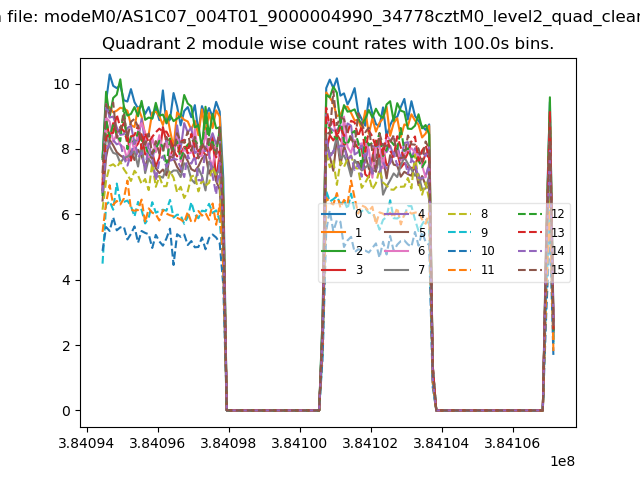
| Module-wise count rates for Quadrant B Data is divided into 100 sec bins |
 |
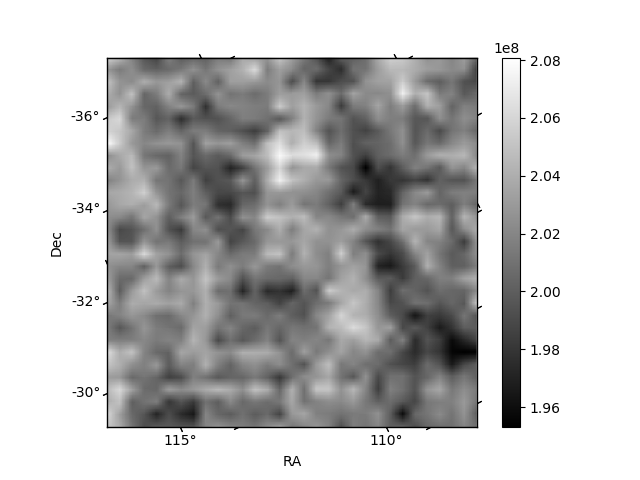 |
| Module-wise count rates for Quadrant C Data is divided into 100 sec bins |
 |
 |
| Module-wise count rates for Quadrant D Data is divided into 100 sec bins |
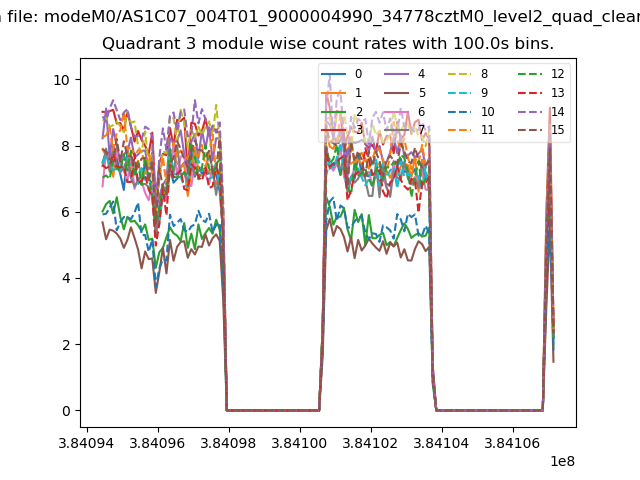 |
 |
| Parameter | Plot |
|---|---|
| CZT HV Monitor | 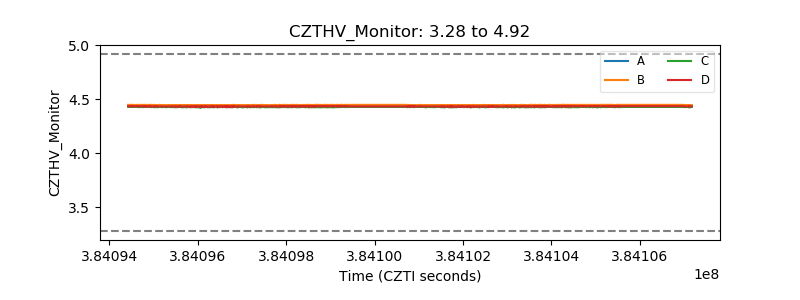 |
| D_VDD | 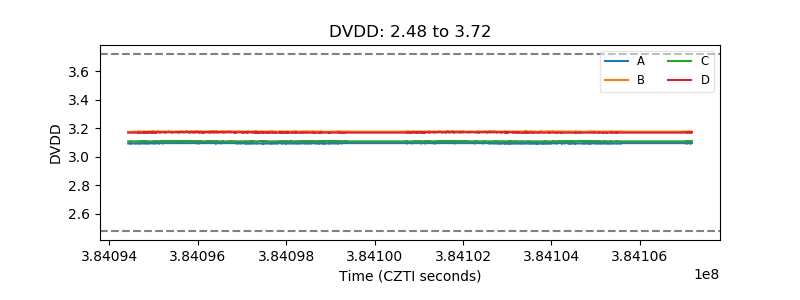 |
| Temperature 1 | 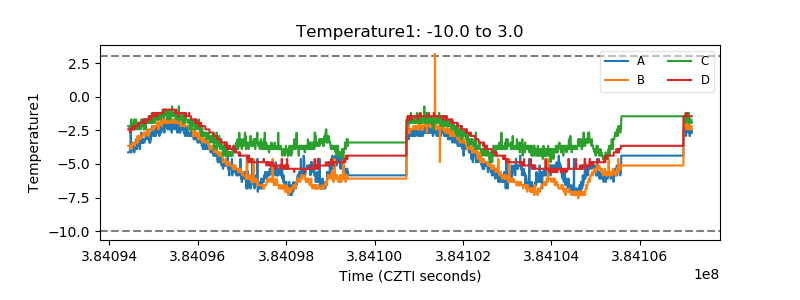 |
| Veto HV Monitor | 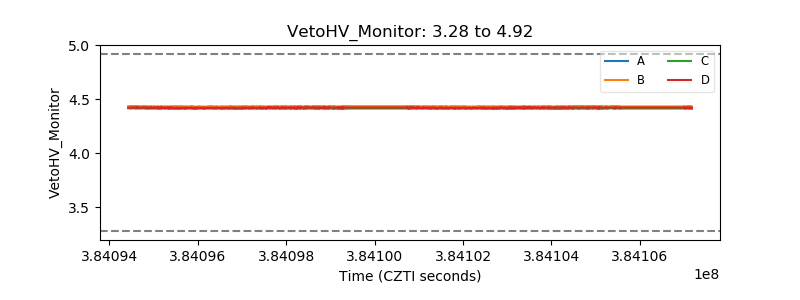 |
| Veto LLD | 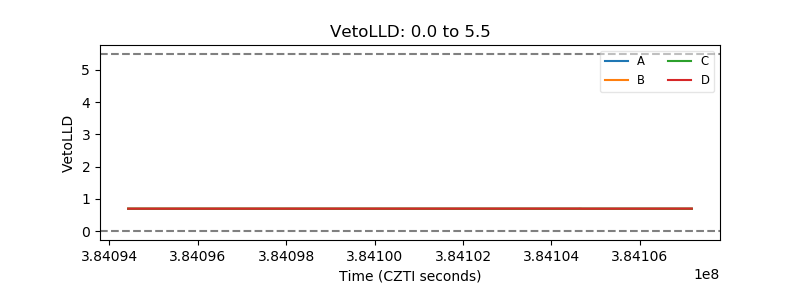 |
| Alpha Counter | 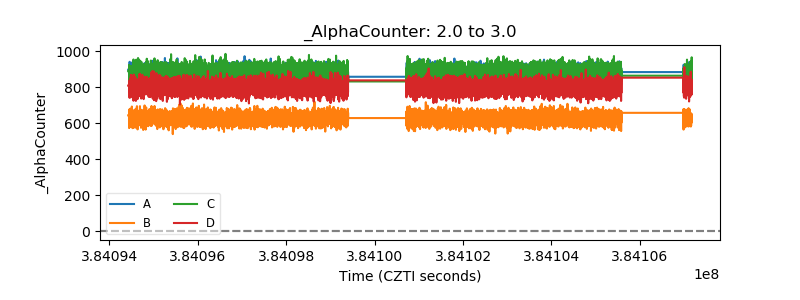 |
| _CPM_Rate | 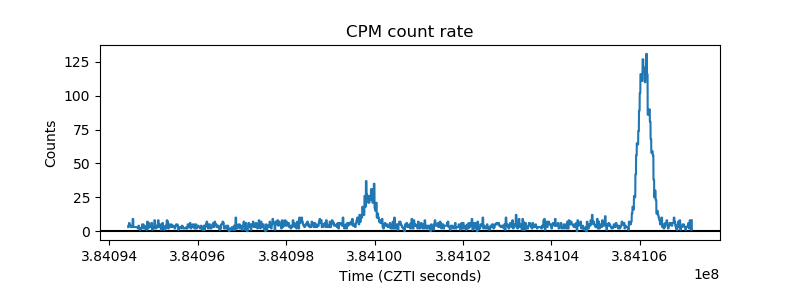 |
| CZT Counter | 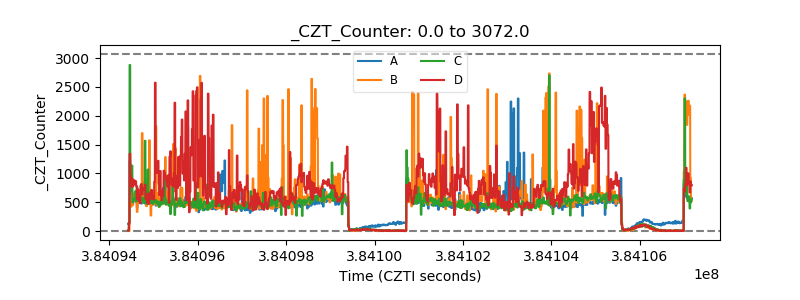 |
| +2.5 Volts monitor | 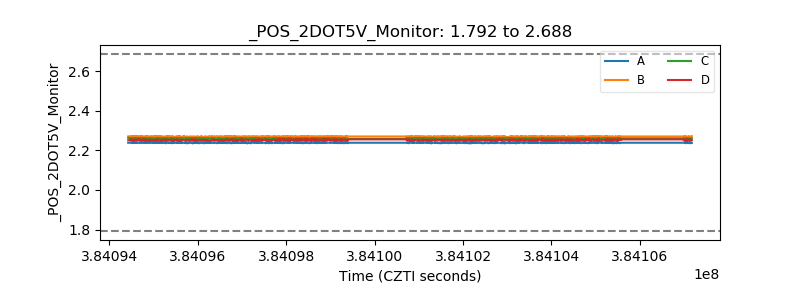 |
| +5 Volts monitor | 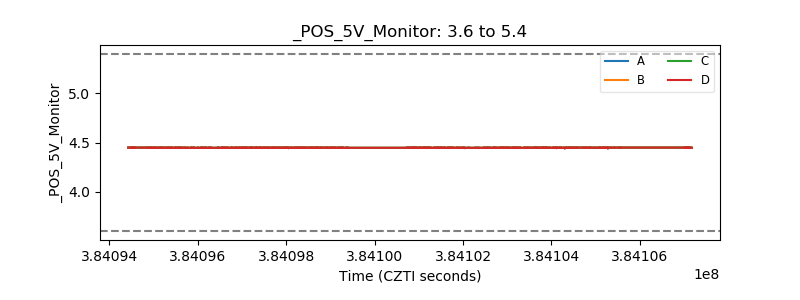 |
| _ROLL_ROT | 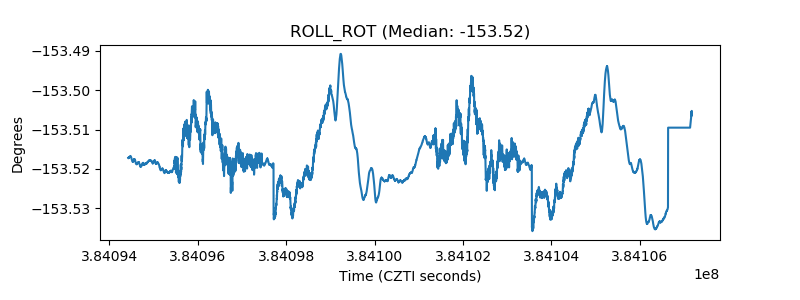 |
| _Roll_DEC | 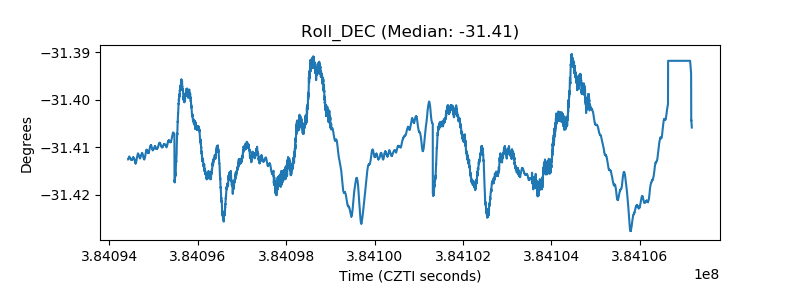 |
| _Roll_RA | 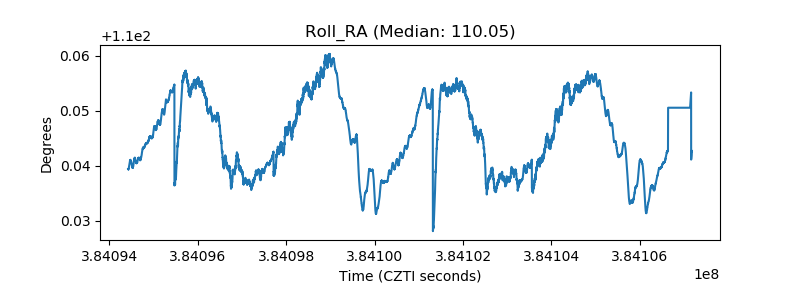 |
| Veto Counter | 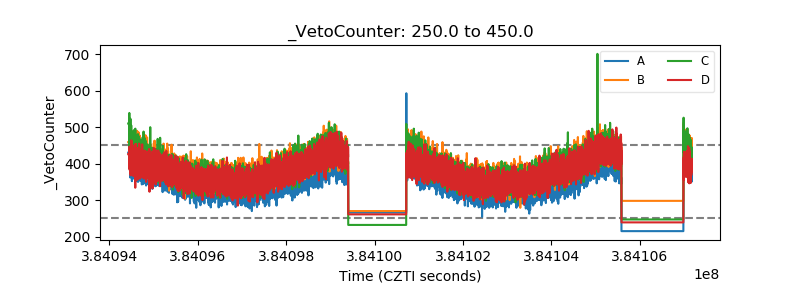 |