| Param | Original file | Final file |
|---|---|---|
| Filename | modeM0/AS1C07_004T01_9000004990_34774cztM0_level2.evt | modeM0/AS1C07_004T01_9000004990_34774cztM0_level2_quad_clean.evt |
| Size (bytes) | 523,742,400 | 83,047,680 |
| Size | 499.5 MB | 79.2 MB |
| Events in quadrant A | 2,752,716 | 538,933 |
| Events in quadrant B | 3,370,769 | 549,928 |
| Events in quadrant C | 3,091,996 | 553,075 |
| Events in quadrant D | 6,252,633 | 466,911 |
| Mode M9 | |||
|---|---|---|---|
| Quadrant | BADHDUFLAG | Total packets | Discarded packets |
| A | 0 | 26 | 0 |
| B | 0 | 26 | 0 |
| C | 0 | 26 | 0 |
| D | 0 | 27 | 0 |
| Mode M0 | |||
|---|---|---|---|
| Quadrant | BADHDUFLAG | Total packets | Discarded packets |
| A | 0 | 11860 | 3 |
| B | 0 | 13575 | 2 |
| C | 0 | 12474 | 2 |
| D | 0 | 22473 | 2 |
| Mode SS | |||
|---|---|---|---|
| Quadrant | BADHDUFLAG | Total packets | Discarded packets |
| A | 0 | 118 | 0 |
| B | 0 | 118 | 0 |
| C | 0 | 118 | 0 |
| D | 0 | 118 | 0 |
| Quadrant | Total seconds | Saturated seconds | Saturation percentage |
|---|---|---|---|
| A | 5801 | 10 | 0.172384% |
| B | 5801 | 139 | 2.396139% |
| C | 5801 | 35 | 0.603344% |
| D | 5801 | 908 | 15.652474% |
Noise dominated data is calculated using 1-second bins in cleaned event files. If a bin has >2000 counts, and if more than 50% of those come from <1% of pixels, then it is considered to be noise-dominated and hence unusable.
| Quadrant | # 1 sec bins | Bins with >0 counts | Bins with >2000 counts | High rate bins dominated by noise | Noise dominated (total time) | Noise dominated (detector-on time) | Marked lightcurve |
|---|---|---|---|---|---|---|---|
| A | 7204 | 5802 | 3 | 3 | 0.04% | 0.05% | 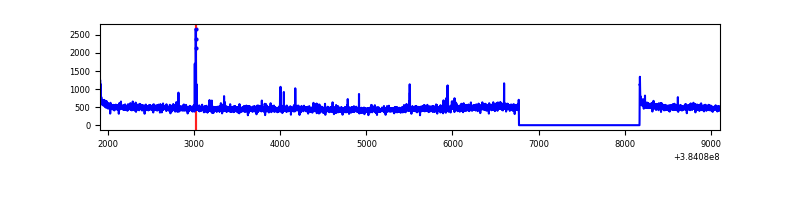 |
| B | 7204 | 5802 | 73 | 73 | 1.01% | 1.26% | 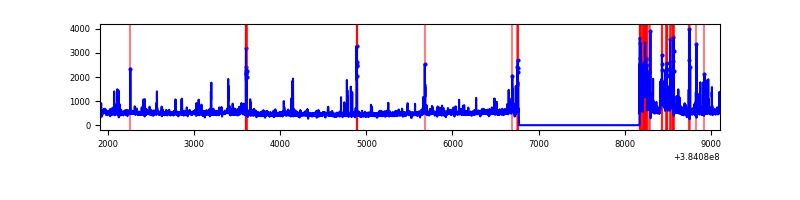 |
| C | 7204 | 5802 | 22 | 22 | 0.31% | 0.38% | 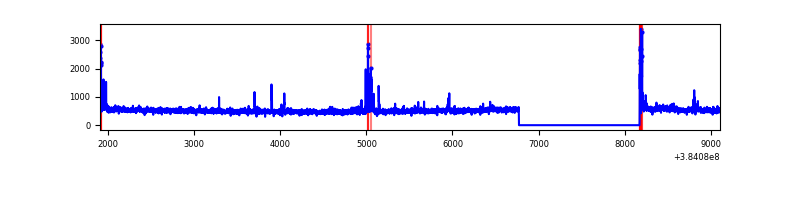 |
| D | 7204 | 5802 | 770 | 770 | 10.69% | 13.27% | 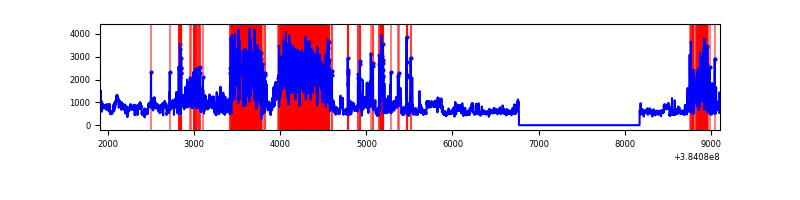 |
Top three noisy pixels from each quadrant. If the there are fewer than three noisy pixels in the level2.evt file, extra rows are filled as -1
| Pixel properties | Quadrant properties | ||||||
|---|---|---|---|---|---|---|---|
| Quadrant | DetID | PixID | Counts | Sigma | Mean | Median | Sigma |
| A | 10 | 83 | 49643 | 357.8 | 681 | 668 | 136.9 |
| A | 13 | 6 | 26948 | 191.99 | 681 | 668 | 136.9 |
| A | 15 | 174 | 21552 | 152.57 | 681 | 668 | 136.9 |
| B | 5 | 172 | 238063 | 1833.73 | 675 | 659 | 129.5 |
| B | 5 | 255 | 126020 | 968.3 | 675 | 659 | 129.5 |
| B | 5 | 200 | 105001 | 805.95 | 675 | 659 | 129.5 |
| C | 15 | 214 | 249786 | 1600.59 | 666 | 670 | 155.6 |
| C | 0 | 10 | 90002 | 573.97 | 666 | 670 | 155.6 |
| C | 14 | 67 | 72870 | 463.89 | 666 | 670 | 155.6 |
| D | 10 | 118 | 1922338 | 12520.06 | 627 | 610 | 153.5 |
| D | 8 | 195 | 1365433 | 8891.82 | 627 | 610 | 153.5 |
| D | 12 | 233 | 181618 | 1179.27 | 627 | 610 | 153.5 |
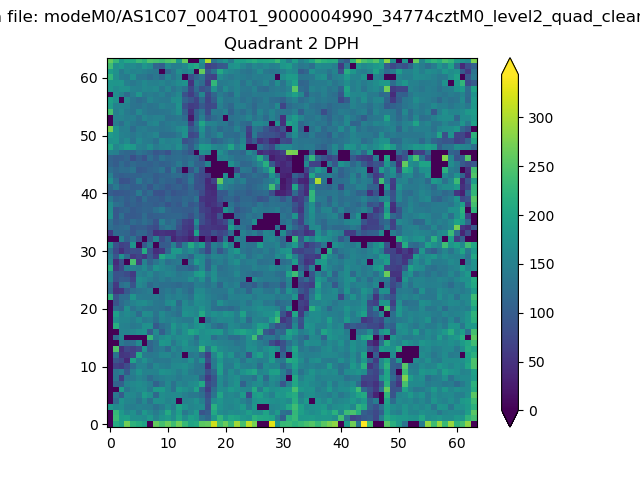
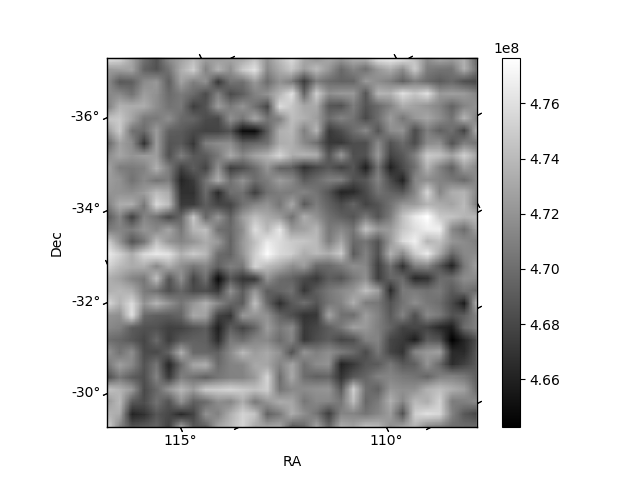
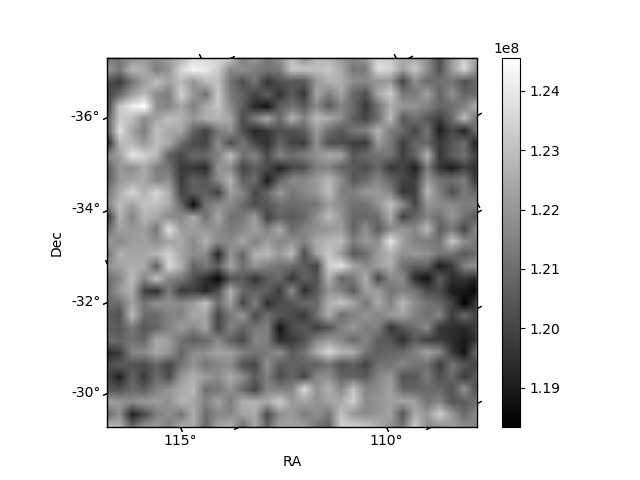
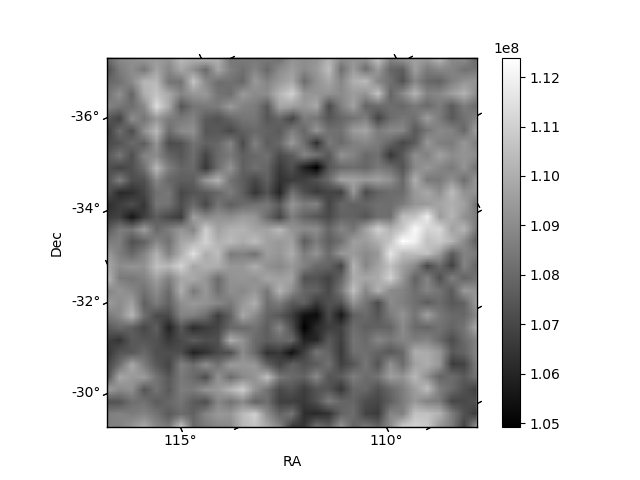
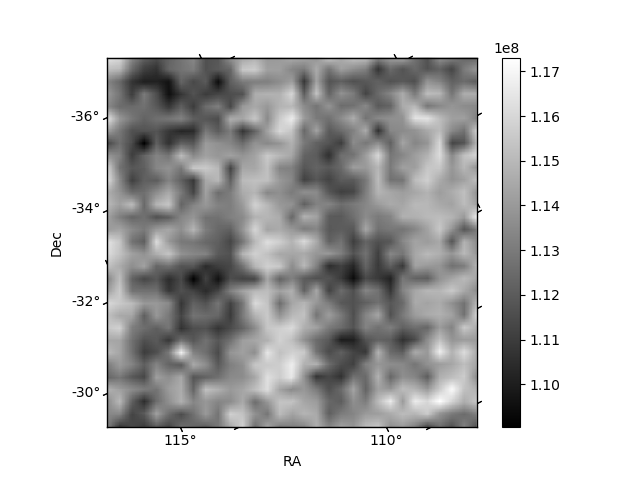
Histogram calculated using DETX and DETY for each event in the final _common_clean file
| Quadrant A | 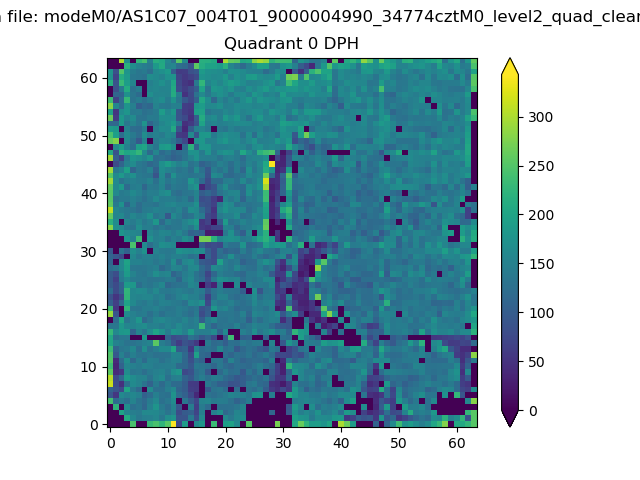 |
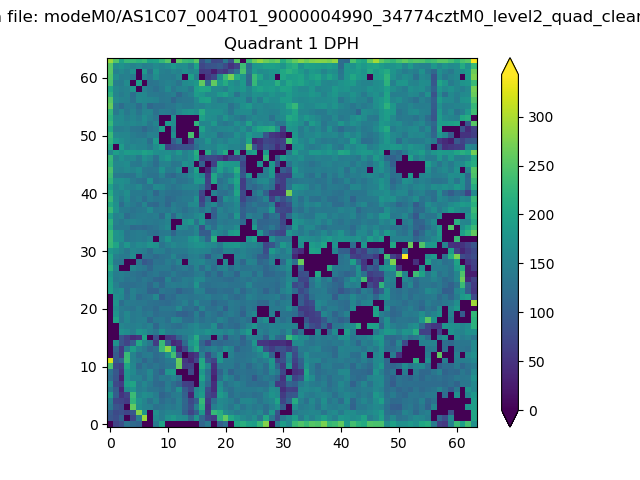 |
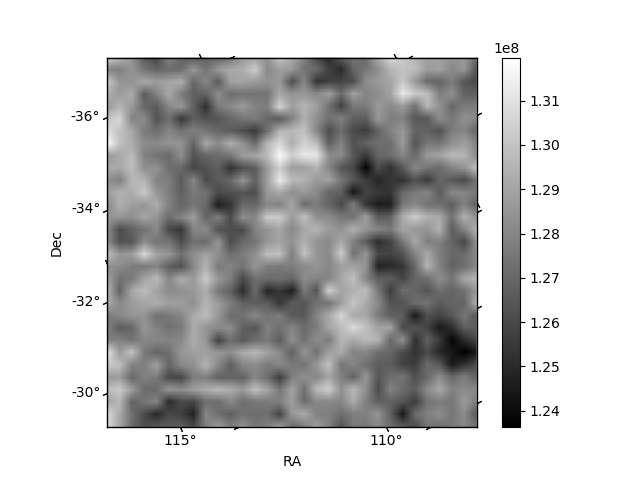
Quadrant B |
|---|---|---|---|
| Quadrant D | 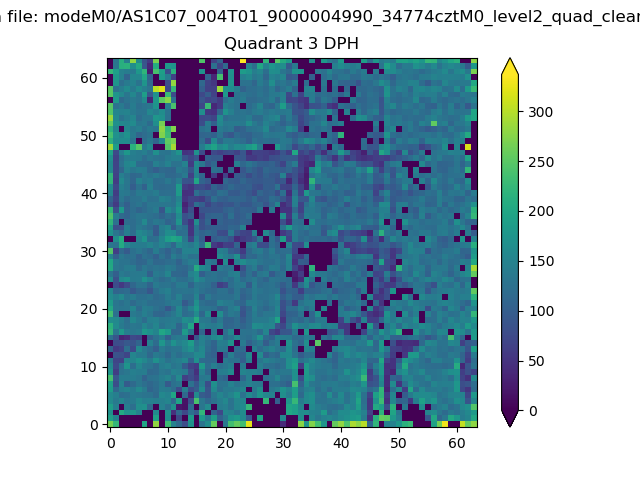 |
 |
Quadrant C |
| Plot type | Count rate plots | Images |
|---|---|---|
| Comparison with Poisson distribution Blue bars denote a histogram of data divided into 1 sec bins. Red curve is a Poisson curve with rate = median count rate of data. |
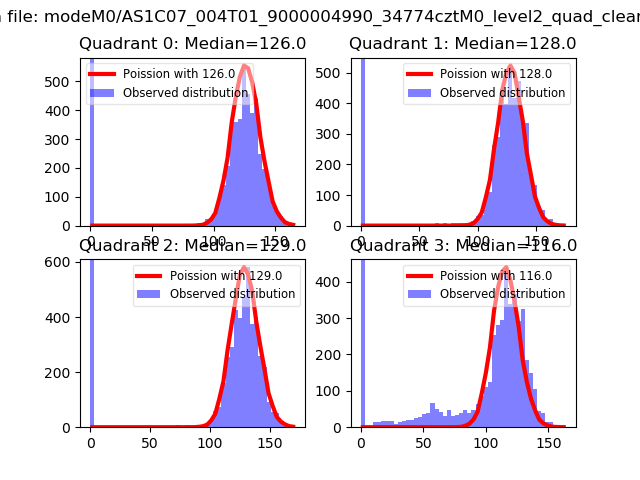 |
 |
| Quadrant-wise count rates Data is divided into 100 sec bins |
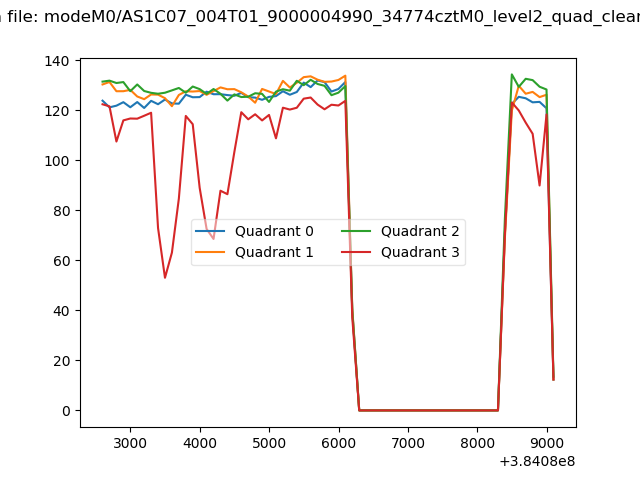 |
|
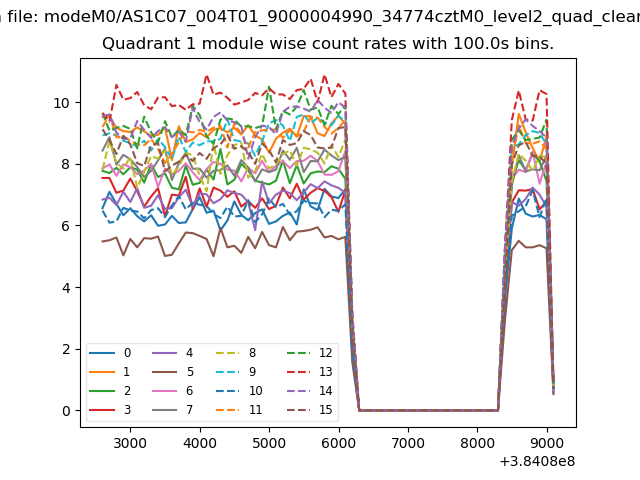
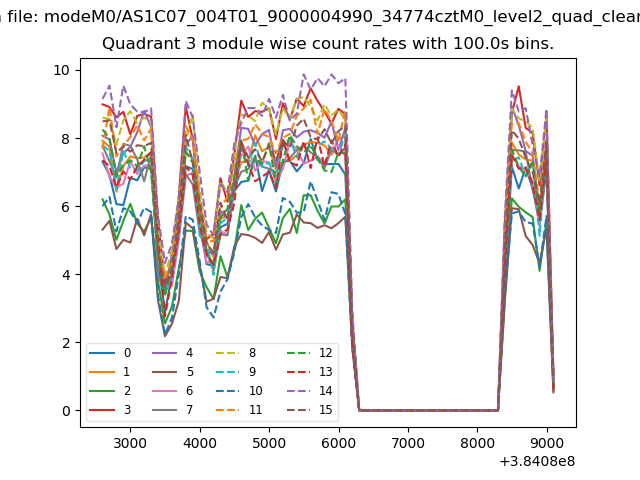
| Module-wise count rates for Quadrant A Data is divided into 100 sec bins |
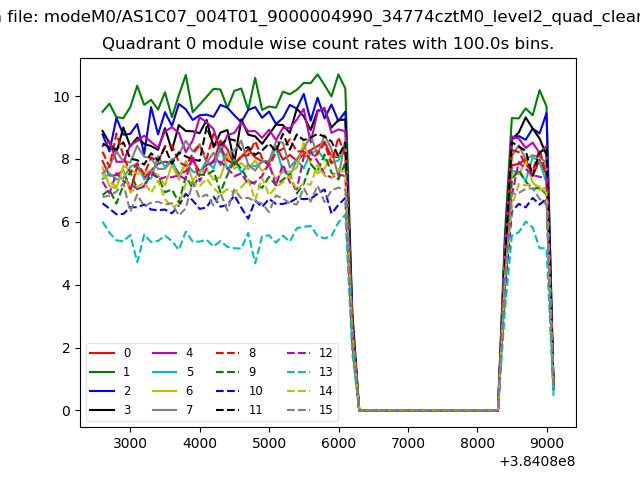 |
 |
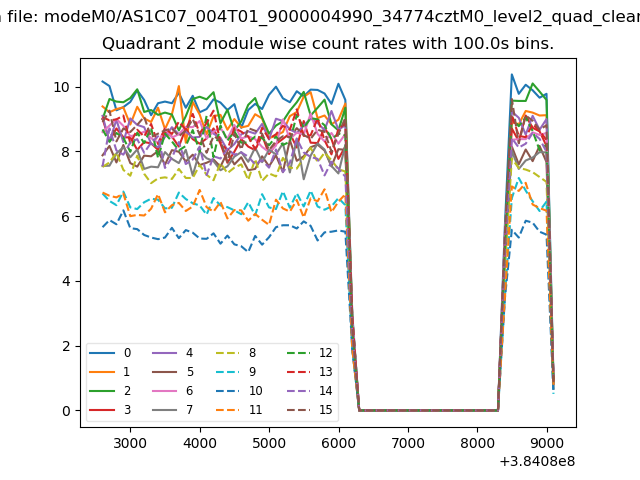
| Module-wise count rates for Quadrant B Data is divided into 100 sec bins |
 |
 |
| Module-wise count rates for Quadrant C Data is divided into 100 sec bins |
 |
 |
| Module-wise count rates for Quadrant D Data is divided into 100 sec bins |
 |
 |
| Parameter | Plot |
|---|---|
| CZT HV Monitor | 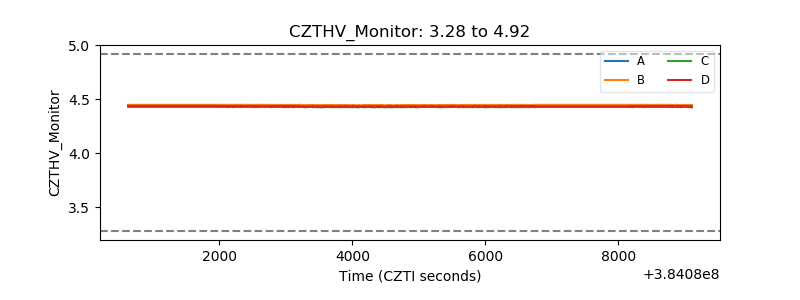 |
| D_VDD | 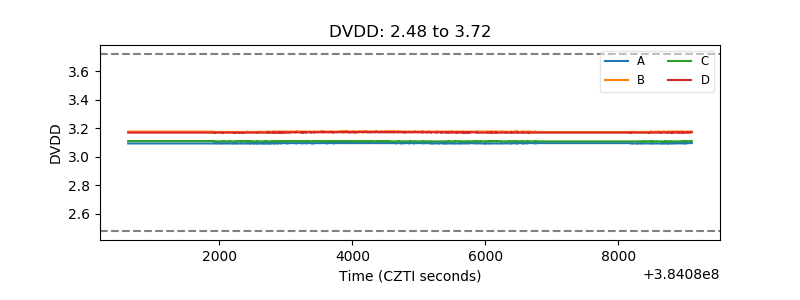 |
| Temperature 1 | 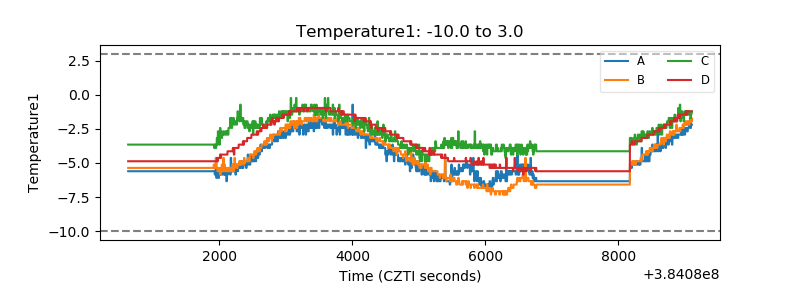 |
| Veto HV Monitor | 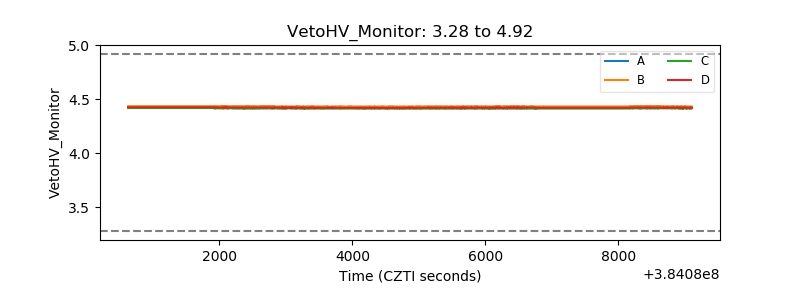 |
| Veto LLD | 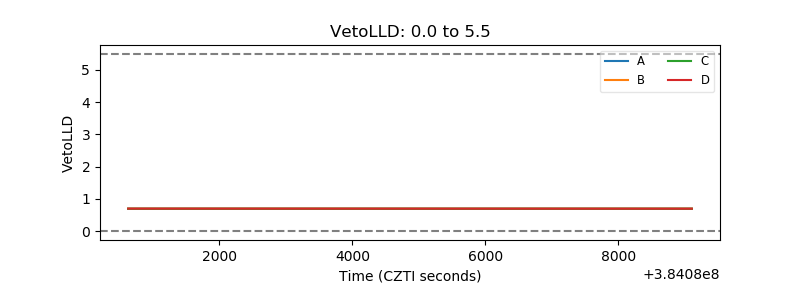 |
| Alpha Counter | 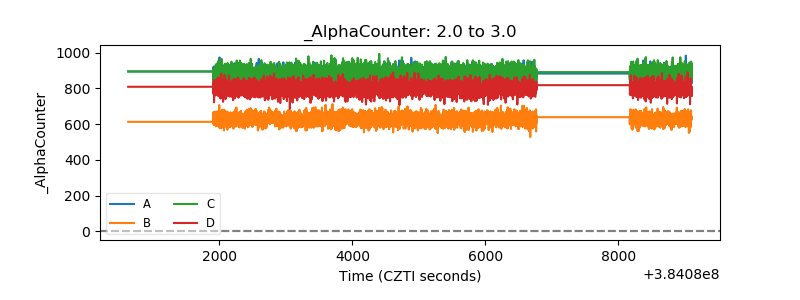 |
| _CPM_Rate | 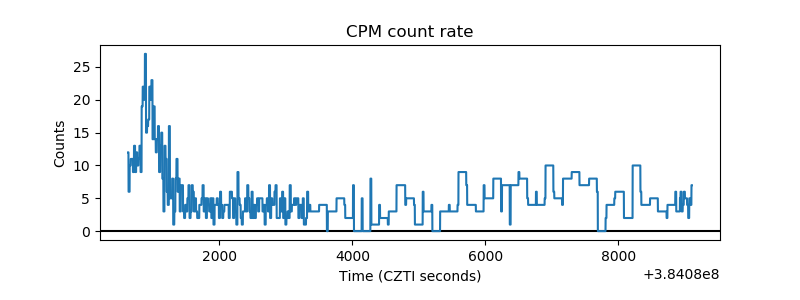 |
| CZT Counter | 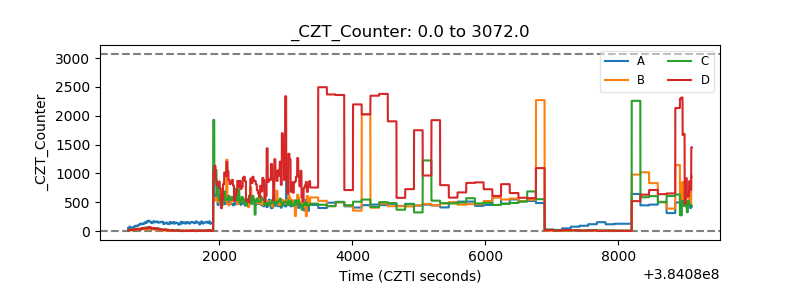 |
| +2.5 Volts monitor | 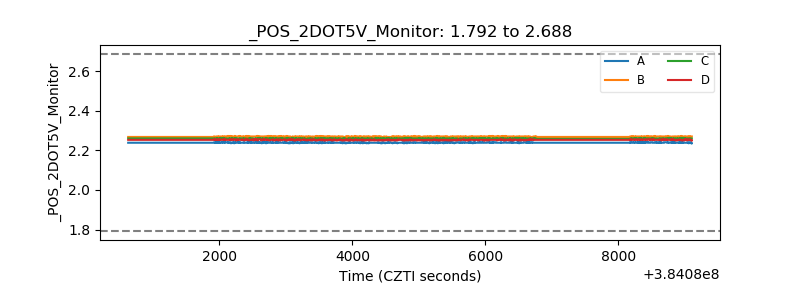 |
| +5 Volts monitor | 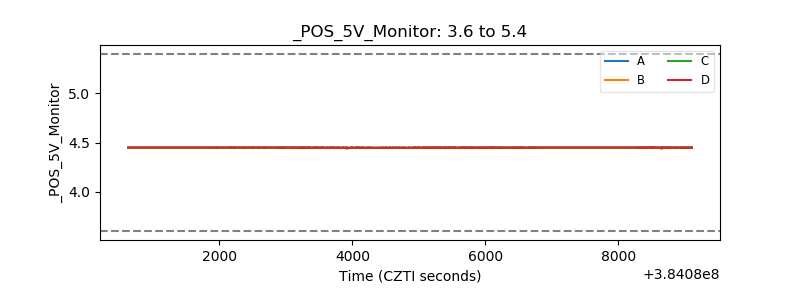 |
| _ROLL_ROT | 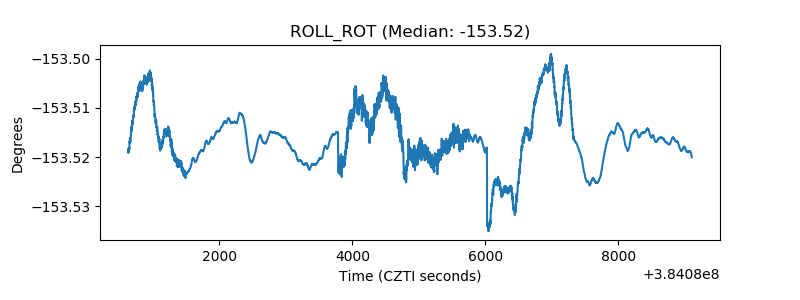 |
| _Roll_DEC | 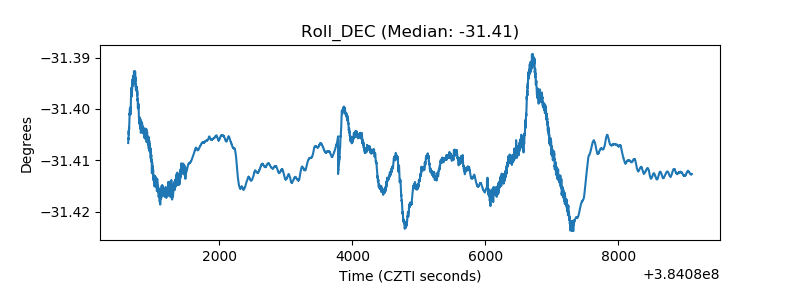 |
| _Roll_RA | 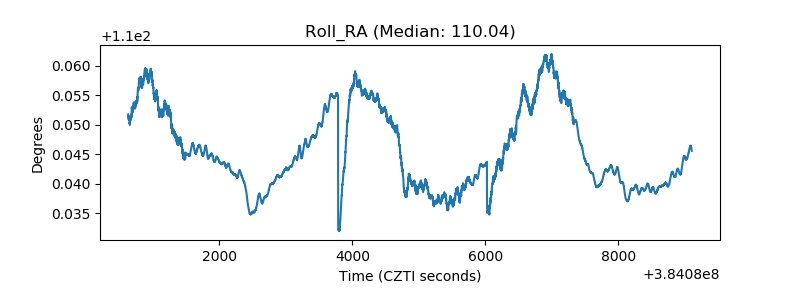 |
| Veto Counter | 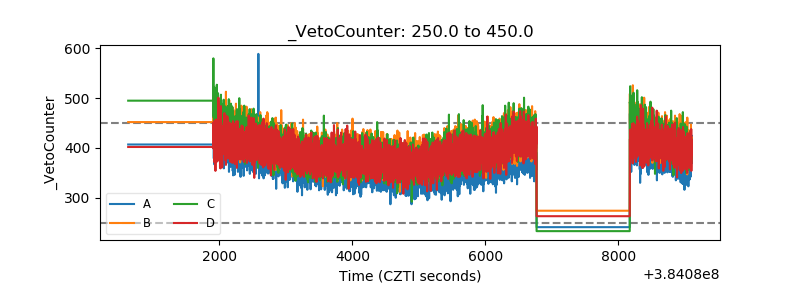 |